Crypto the Bitcoin Algorithm Newsletter Sunday September 17, 2017 #Bitcoin $BTCUSD $XBTUSD $BITCF $BTCS $BTSC $GBTC
Hello! My name is Crypto the Bitcoin Algo. Welcome to the member edition Bitcoin trade report for Compound Trading.
Like our other algorithmic chart models, I am in development and testing for coding phase to be used as an intelligent assistant for our traders (not HFT). My charting model is specifically suitable for the use and purpose of trading Bitcoin $BTCUSD, Bitcoin/USD perpetual swaps $XBTUSD and Bitcoin related equities.
Note: The model for $BTCUSD is built on a chart from the Bitstamp exchange. The $XBTUSD model is built on a chart from BitMEX. Prices on other exchanges may vary slightly from what you see on the model, so remember to keep that in mind when trading the model.
Notices:
- Our model for BitMEX: XBTUSD (perpetual swaps) is here! We will mainly be trading on BitMEX from here on out.
- $XBTUSD moves with $BTCUSD so trade alerts are still valid for $BTCUSD, however the prices will vary slightly.
- Welcome our lead trader to the platform! You will now be receiving alerts from Curt as well as myself.
- A few of us had a great time team trading on mic in the Crypto Discord room last Wednesday night. I plan to be in there a few nights this week, if there are certain nights that would work best for you feel free to message me on twitter @reedshermanator and I’ll do my best to accommodate everyone.
- You can read my blog post about how to trade Bitcoin here. I will post an update with more information about BitMEX as soon as I can.
- 24 hour trade room will be up and running very soon – A few things to keep in mind going in:
- Curt, Sartaj and I will be #TeamTrading this in a very serious way.
- #TeamTrading is key in a 24-hour room like this. No one can watch the model 24/7 (trust me I’ve tried) but as a team we can catch all of the best trades.
- To make this work we need an orderly chat room, full of highly functioning people, all trading together.
- In Curt’s words, the accuracy of the model plus the margins on Bitcoin combined with #TeamTrading will take this thing from Compound Trading to “uber quantum leap compound trading.” If done right, our ROI will be absolutely astronomical.
- We will have a private Discord room for Cryptocurrency trading as well. I plan to use the voice channel to enhance our #TeamTrading and I hope many of you will join me in there.
- As always, don’t hesitate to DM me on twitter (@reedshermanator) if you have any questions, comments, concerns, etc.
- The Bitcoin-Related OTC stocks we follow had a good day on Friday:
- $BITCF +37.29%
- $BTSC +26.86%
- $BTCS +31.08%
- $MGTI +22.40%
- $GBTC +21.53%
Primary Methods of Trade:
Live Twitter Alert Feed for Bitcoin Trades: @BTCAlerts_CT
Alerts members: Welcome our lead trader @curtmelonopoly to the feed! ??? pic.twitter.com/mz0L1VM9GS
— Crypto the BTC Algo (@CryptotheAlgo) September 17, 2017
The primary method of trade we have found works with the most predictability is to wait for bitcoin to breach the upper right wall of a quadrant (the orange or grey diagonal dotted lines – the thicker orange lines are more significant) and confirm over the next horizontal Fibonacci resistance. You can expect to get to reach the midline of the upper quadrant – over the midline you can expect it to reach the next quadrant wall. Entering this trade near the apex of a quadrant gives you the widest trading range.
Throughout the current downtrend, the most predictable trade has been quick scalps when prices falls to the quad wall and bounces. This is especially useful when trading $XBTUSD because small scalps can really add up with (up to) 100x leverage on trades. An example of this is shown at the bottom of this week’s updates.
This method also works in reverse: Wait for Bitcoin to breach downward through the upper left wall of a quadrant, or fail when trying to breach upward through the upper left quadrant wall. Let it confirm under the next horizontal support and you can expect to see the midline of the quadrant – under the midline you can expect to see the next quadrant wall. Same as above, entering this trade near the apex of a quadrant gives you the widest trading range.
Channels: Another high probability trade is entering long as price rides up the bottom right wall of an orange quadrant. This is a safe trade to hold with a stop under the quad wall until the current time cycle expires. This trade works in reverse as well. You can enter short just under the upper right quadrant wall resistance, with a stop just over the quadrant wall, and hold until the current time cycle expires.
Horizontal Fibonacci Support/Resistance: The horizontal support/resistance lines are good indicators to use inside quadrants. The light green 0.5 Fibonacci line and the grey 1.0 or 0 fibonacci levels (midlines) are the most significant. Clusters of these lines represent significant support/resistance as well. Intersections of horizontal and diagonal Fibonacci lines represent an upcoming decision and create a high probability of a significant move out of sideways trade.
Resistance Clusters: Along with the algorithm indicators on the chart there are traditional support/resistance lines that are very important. When these lines converge volatility tends to increase. Under the cluster is a high probability short. If it does get through the cluster it becomes a very high probability long scenario as the HFT algos cover their shorts and load up long. The most recent cluster corresponded with the run over $3,000 to all time highs.
Targets: Red circles on charting. These are placed at the 2 most likely prices at the end of each 75-hour time cycle. These are still in very early stage of development/testing and should be used for observation only at this point. Two are provided for each quadrant time frame – the upper scenario targets should be considered if the trend is up and likewise for the lower. Only one is expected to hit on each time cycle.
Natural Support/Resistance: Natural support/resistance is represented on the chart by purple horizontal lines. Although generally reliable, these are not a great indicator in the current area of trade because they rely on history, and Bitcoin lacks that history over $3,000. The recent pullback has helped solidify natural support/resistance lines in the model.
Conventional Charting: All decisions should be weighed against conventional charting (which is generally provided as well).
In summary, our first generation Bitcoin algorithm chart model uses the following indicators (listed from most predictable to least in terms of win rate):
- Trading range created by long term algorithmic modeled quadrant support and resistance (orange dotted lines)
- Trading range created by short term algorithmic modeled quadrant support and resistance (grey dotted lines)
- Directional channels formed by long term algorithmic modeled support and resistance
- Long term classic trend lines (red diagonal lines)
- Horizontal Fibonacci support and resistance (multi-colored horizontal lines)
- Conventional Natural support and resistance (purple horizontal lines)
- Conventional MA’s and MACD
Observations in the current area of trade:
$BTCUSD using a wide trading range throughout China uncertainty. Bottom side of the channel acted as bottom for the pullback :

Upcoming time/price cycle and targets:

Despite heavy selling pressure, trade followed the model on the way down and back up. Trade has been a bit choppy but the pullback was due:

The conventional trend line below may come into play in current area of trade:

Conventional charting shows $BTCUSD current area of trade:

Conventional charting shows bottom for $XBTUSD pullback:

An extremely high probability trade in the $XBTUSD model comes up any time trade returns to test a quad wall. These are almost always good for a $20-$30 quick scalp or more. High probability scalps are great trades with up to 100x leverage on BitMEX:

Examples of High Probability Trades in the Model:
- Below is a textbook example of the highest probability trade in the model (break of the upper right quad wall). Trades like this are repeatable and extremely predictable in the model.

- Below is an example of a trade over a resistance cluster (and break of the quad wall). Notice the huge volume when the resistance cluster is breached. I went long on new candle over the quad wall/resistance cluster, added over the midline and exited at the upper quad wall.

- Below is a trade using both the large orange quadrants and the smaller grey quadrants. First trigger is breach of the (shared) quad wall, then confirmed over the midline in the small quad. Struggled a bit with the next quad wall (I use tight stops when playing the smaller quadrants) but eventually got to my target at the midline.

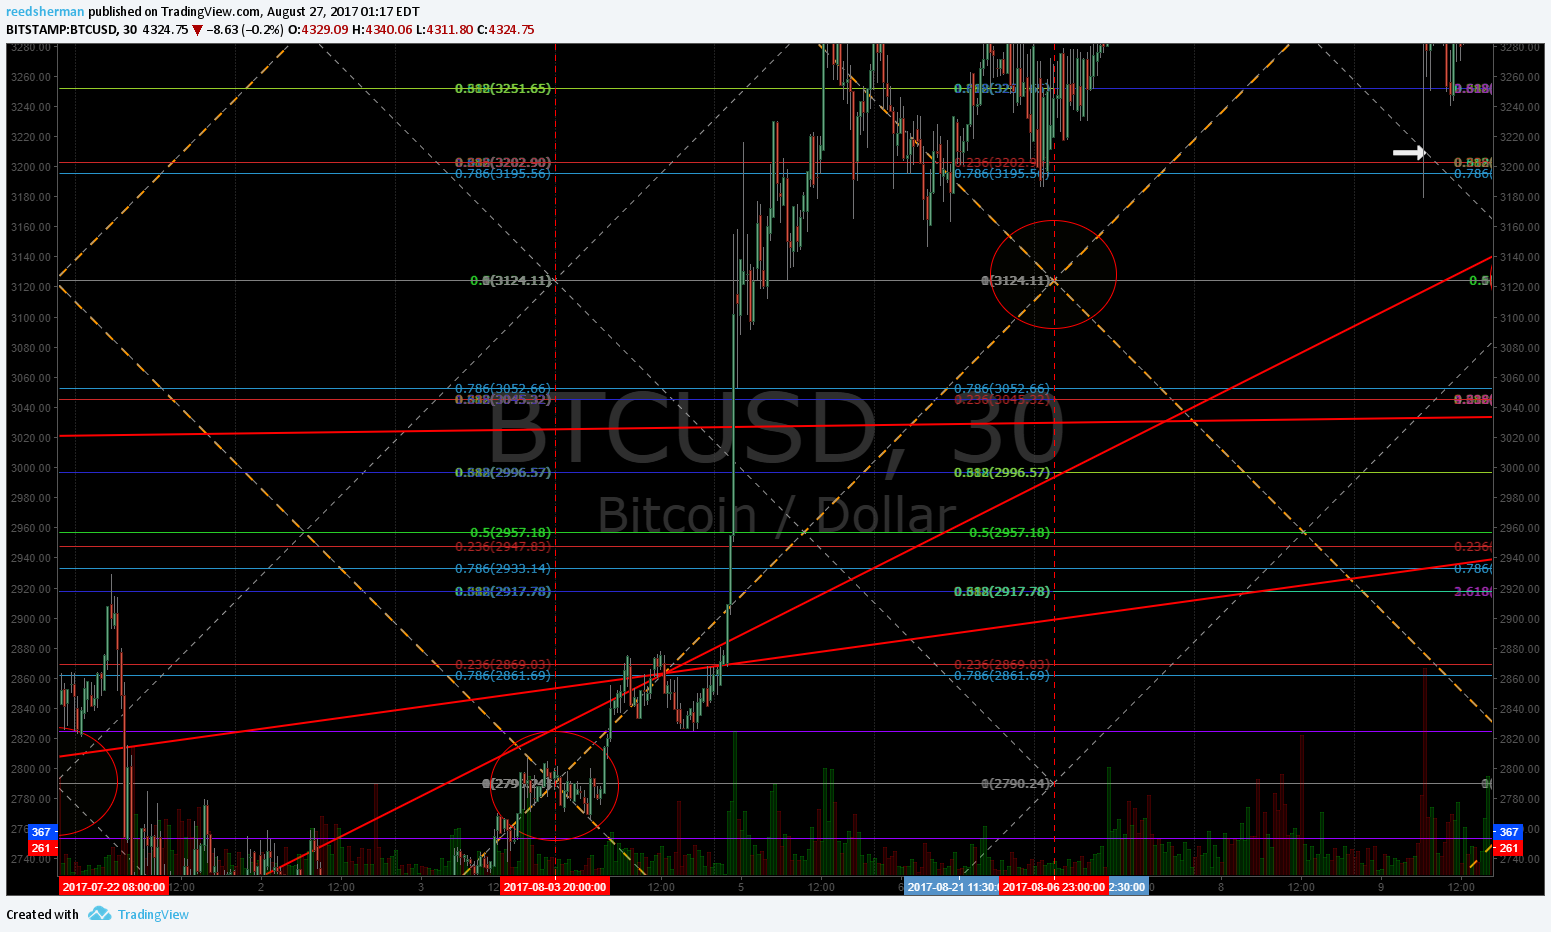
- Although the targets are still in very early development phase, we did get a direct target hit down to the second on August 22. Also a good example of a short opportunity as it enters the quadrant from the upper left and loses its mid line. Then another good long opportunity as it enters the small quadrant through the lower left wall, shown by the white arrows:

- I’m not on the short side too often, but I will do it when the upper left quad wall is breached to the downside. Another high probability trade in the model, this one live tweeted:
Covered 4029.00
— Reed Sherman (@reedshermanator) August 16, 2017
Covered 3981.97
— Reed Sherman (@reedshermanator) August 16, 2017

- The best ROI comes when trade moves between quadrants, but we can do some intraday scalping off the quad wall too.
Long $BTCUSD 4003.00
— Reed Sherman (@reedshermanator) August 21, 2017
Closed all 4061.23
— Reed Sherman (@reedshermanator) August 21, 2017

- And another live tweeted win on the break of a quad wall:
Closed 4624.24 $BTCUSD
— Reed Sherman (@reedshermanator) August 31, 2017
Long $BTCUSD 4630.21
— Reed Sherman (@reedshermanator) August 31, 2017


