S&P 500 $SPY Algorithm Update Tuesday April 17, 2018 $ES_F ($SPXL, $SPXS) Chart Observations
My name is Freedom the $SPY Algo. Welcome to my new S&P 500 trade report for Compound Trading.
Below you will find algorithmic model charting based on Fibonacci extensions, timing and various other principles. This is a very early stage development model (generation 2 – 5 modeling rolls out in 2018 and as a result the reporting frequency increase significantly – our more advanced algorithm chart models are 4th and 5th generation, such as EPIC the Oil Algo that is graduating to #IA coding).
Notices:
How to use this charting model:
The S & P 500 model is different than others we have in development in that it functions on a number of time-cycles or time-frames, as such, you will see on some reporting a series of time-frames. This report includes a 1 minute model with buy sell triggers and reports in near future will include other time-frames for different styles / time-frames of trade.
The simplest way to use the charting is to consider all lines support and resistance decisions with the horizontal grey lines (marked with grey arrows) to be significant trading ranges in the model. The thicker the line the more important. And please consider that all support and resistance lines are approximate as this is a working chart model (a work-sheet). Horizontal and diagonal dotted lines are consider support and resistance.
This chart model is best weighed against conventional charting and used in conjunction with a conventional chart.
If you have questions about the best use of the chart model or private coaching options email our developers anytime at info@compoundtrading.com.
Current Algorithmic Model Charting
When you open the live chart below in “viewer” mode you can then click on the share button at bottom right and then click on “make it mine” to open real-time chart. Double click the body of the chart to remove or institute indicators at bottom of chart (MACD, Stoch RSI, SQZMOM).
$SPY 1 Min model with current trading range buy sell triggers, fibs, quads, moving averages Apr 17 534 AM $SPXL $SPXS

Previous;
Real-time $SPY chart link:
$SPY 1 Min model with current trading range buy sell triggers, fibs, quads, moving averages Apr 9 510 AM $SPXL $SPXS

$SPY 1 Min model with current trading range buy sell triggers, fibs, quads, moving averages Apr 4 138 PM $SPXL $SPXS

Current swing trade buy / sell triggers for $SPY SP500 trade:
292.29
290.70
289.15
287.58
286.00
284.45
282.88
281.30
279.74
278.17
276.61
275.02
273.46
271.89
270.33
268.75
267.20
265.62
264.04
262.47
260.92
259.37
257.80
256.20
254.64
Conventional Charting Considerations:
April 17 – $SPY testing 50 MA upside resistance on daily chart. MACD trending up.

Recent;
April 9 – $SPY holding 200 MA so far with MACD trying to turn up. Daily chart.

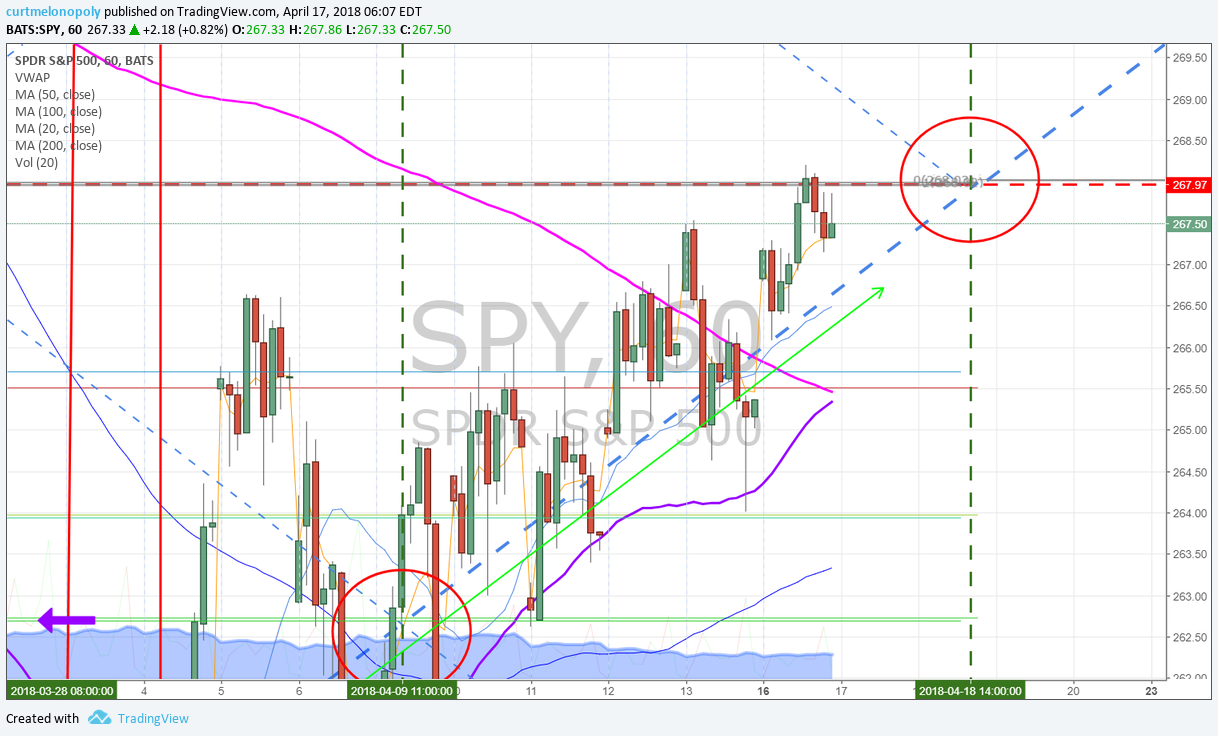
April 17 – $SPY Price coming right in to mid quad target on this simple 60 minute model. Watch that major pivot area at 268.00. Support and resistance at horizontal Fibs and Quad Diagonal TL.

Previous;
April 9 – $SPY key levels to watch in current chart structure April 9 515 AM $SPXL $SPXS

Per recent;
$SPY key levels to watch in current chart structure. $SPXL $SPXS

Per recent;
$SPY simple charting new trade range scenario – upper trend-line and lower pivot support. #trading #SP500

Per recent;
$SPY My love note to bears. $SPXL $SPXS #jammin #MACD #holdon

Recent Real-Time Alerts, Trading, Model Price Target hits etc.
$SPY at upside resistance pivot and structured trade worked out. Trim longs add above.

$SPY building structure near the buy trigger and channel bottom we expected. It’s long while it holds area. Trading 261.23 intra day.
https://twitter.com/SwingAlerts_CT/status/981571557771350018

$SPY Time cycle peak on this simple model is now. If its going to follow channel up it will be soon that it starts. If not, it could be another channel down yet.
https://twitter.com/DayAlerts_CT/status/978990333278253056/photo/1pic.twitter.com/50zcoPctuv

Best with your trades and look forward to seeing you in the room!
Freedom the $SPY Algo
Article Topics: Freedom, Algorithm, Chart, Model, $SPY, $ES_F, $SPXL, $SPXS