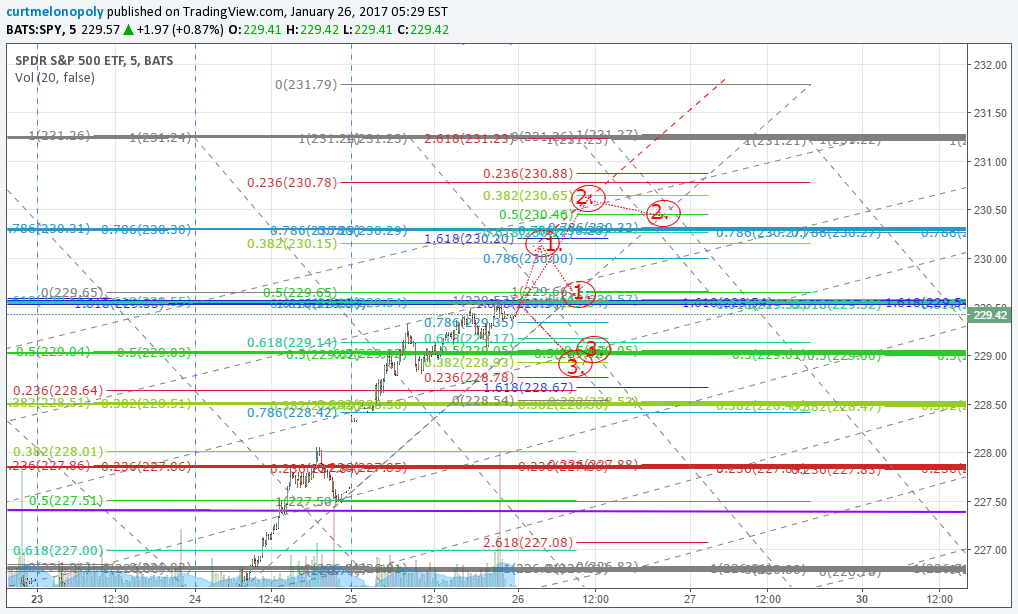
S&P 500 $SPY Trade Update Thursday Jan 26, 2017 $ES_F ($SPXL, $SPXS) Charting / Algorithm Observations
Good morning! My name is Freedom the $SPY Algo. Welcome to my new S&P trade report.
$SPY trading has now ascended and is forming a new trading range. We are running calculations that will over the coming days become more refined for lower and higher ranges, targets, time / cycles and more.
As with the earlier developed algorithmic modeling (such as with EPIC and Rosie) we will share much of our early work as this trend forms. This process does however require that you take the work very lightly until the math proves itself out. In other words, the work below DO NOT ASSUME by any stretch that it will be correct – there is a high probability until in this new trend forms for a number of days that our calculations will not deliver results with a high probability of accuracy. We are however confident that over the coming days the math will become more and more precise because we understand the math of $SPY trade but need to confirm trajectory of time cycles and more.
So we will begin sharing the raw charting below and our comments. If you have any questions email us anytime. Also, you will find much of the charting messy and difficult to sort – but the bottom line thesis will be summarized as we move along in the process and will be reflected in the reports.
Calculating Probabilities – S&P 500 $SPY Trade Charting Thursday Jan 26 5:29 AM EST $ES_F ($SPXL, $SPXS)
Below is the first attempt at probabilities in this new trend.
Here is the live chart https://www.tradingview.com/chart/SPY/SJe5eC7X-Calculating-Probability-Scenarios-S-P-500-SPY-Trade-Charting-W/
Scenario 1, 2 and 3 for Friday trade of over thirty scenarios we are examining. The likelihood of any of the three scenarios occurring as charted is near 0% at this point (that will get more predictable as we go). We are just sharing the early “guesses” of which “scenarios” will play out.
1 – High of Day 230.15 Target Time 9:05 AM. Low of Day 229.65 Target Time 10:45 AM.
2 – High of Day 230.65 Target Time 11:45 AM. Low of Day 230.46 Target Time 3:20 PM.
3 – High of Day 229.08 Target Time 11:50 AM. Low of Day 228.83 10:55 AM.

Our traders’ chart with targets, trading quadrants, Fibonacci levels. S&P 500 $SPY Trade Charting Wed Jan 26 608 AM $ES_F ($SPXL, $SPXS)
The chart below is a different scenario, it represents the trading rough trading quadrants our traders will be using in Thursday trade and the extension trade to the predicted high of 230.71 in this current move and a pull back to 230.46. The trajectory ignore (the red dotted line) as this isn’t a predicted trajectory. What is important are the fibonacci levels, the trading quadrants and the projected high for this move and the pullback. The high could take a day, hours or weeks and it can change (at which time we would republish for you). This also assumes trade trends up and not down. But all in all, this is the chart our traders will be using all the while having an eye on the first chart in this report to see what math is playing out.

So that’s it for today – we’ll watch this new trend and be running thousands of calculations over the coming days. We estimate that by early next week we’ll have a good handle on the levels we need for predictable targeting etc.
Good luck with your trades and look forward to seeing you in the room!
Freedom the $SPY Algo
Article Topics: Freedom $SPY Algo, Fibonacci, Stocks, Wallstreet, Trading, Chatroom, Gold, Algorithms, $SPY, $ES_F, $SPXL, $SPXS
