S&P 500 $SPY Trade Update Friday Feb 10, 2017 $ES_F ($SPXL, $SPXS) Algorithmic Charting Observations
Good morning! My name is Freedom the $SPY Algo. Welcome to my new S&P trade report for Compound Trading.
Current Trade in $SPY S & P 500.
In Thursday’s market trade became active, and as such this will allow for considerable charting over the coming days. A complete update will be done prior to Saturday webinars that are scheduled (vs Sunday update) and for today a quick update so trader’s have levels intra-day for today’s trading.
Most Recent Simple Charting Updates From Monday – Be Sure You Have These:
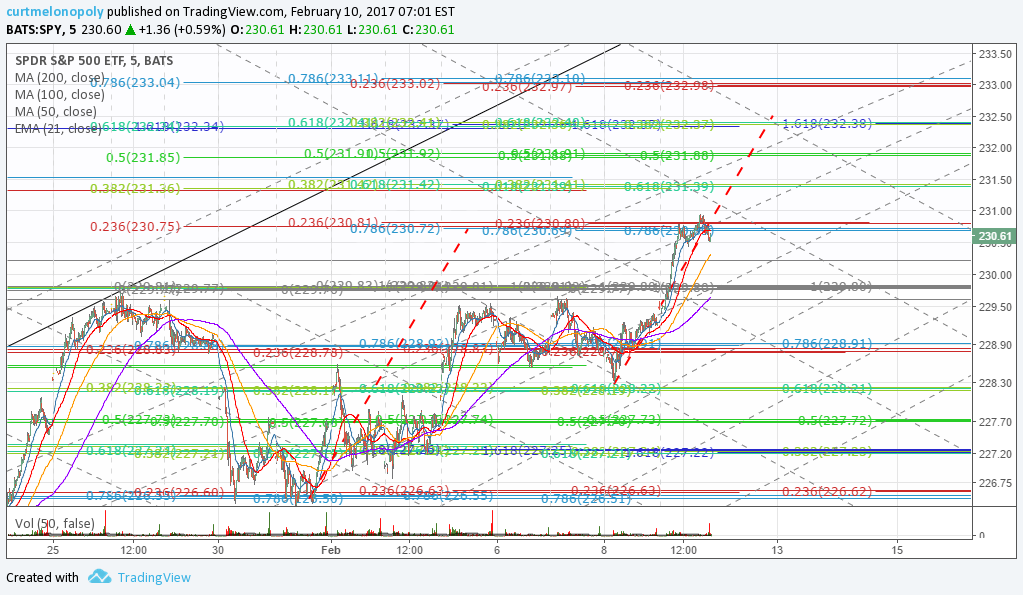
Intra-day trading ranges with Fibonacci, MAs, VWAP, Cloud, Indicators. S&P 500 $SPY Trade Charting Mon Feb10 651 AM $ES_F $SPXL, $SPXS
Below are the levels our traders will be using for intra-day trade on Friday.
$SPY Intra-day Trading Levels Live Chart: https://www.tradingview.com/chart/SPY/acfEactA-SPY-Intra-day-trading-ranges-with-Fibonacci-MAs-VWAP-Cloud/

Symmetry extension, trading quadrants, Fibonacci. S&P 500 $SPY Trade Charting Fri Feb10 700 AM $ES_F $SPXL, $SPXS
Fibonacci – The Fibonacci levels have been predictable so we are leaving them as they are.
Trading Quadrants – The trading quadrants for the time frame are also predictable, not perfect, but predictable.
Symmetry Extension – If you refer to the most previous report, we included a red dotted line to provide you an upward trend extension for a price target of our upward trading bias. Trade did break out to the upside and the upward trading price target has been hit! The new chart below provides you with a new upward trending symmetrical extension.
Time / Price Cycles – There are time / price cycles coming due between Friday 12:00 EST and Tuesday 4:00 EST – during time / price cycle terminations we advise our traders to use caution.
Trading Bias – Our trading bias is to the upside again with the possibility of an interim / moderate pull back.
$SPY Live Trading Chart with Symmetry Extensions, Fibonacci, and Trading Quadrants:
Symmetry extension, trading quadrants, Fibonacci. S&P 500 $SPY Trade Charting Fri Feb10 700 AM $ES_F $SPXL, $SPXS

Below we have copied the applicable charting that is not being update today from the previous report for your reference. The weekend update will have all newly revised charting.
$SPY Bullish however MACD negative divergence look to 200 MA – S&P 500 $SPY Trade Charting Feb 6 708 AM $ES_F $SPXL, $SPXS
In the event our bullish bias does not play out, consider / monitor the MACD divergence (down trend) and watch the 200 MA for support.
$SPY Live Chart: https://www.tradingview.com/chart/SPY/g5LKVW0h-SPY-Bullish-however-MACD-negative-divergence-look-to-200-MA/

Ascending Trade Scenario 1 – S&P 500 $SPY Trade Charting Feb 6 653 AM $ES_F, $SPXL, $SPXS
$SPY Live Trading Chart: https://www.tradingview.com/chart/SPY/1ou53bUE-Ascending-Trade-Scenario-1-S-P-500-SPY-Trade-Charting-Feb-6-6/
Price action in this model is intact. Per previous the 200 MA is support. More importantly the implied resistance is similar to the historical data above at 230.53.

Sideways Trade Scenario 1 – S&P 500 $SPY Trade Charting Feb 6 658 AM $ES_F $SPXL, $SPXS
This scenario is also intact. If price ascends above resistance look to it for support.
$SPY Live Trading Chart: https://www.tradingview.com/chart/SPY/oWsddcg8-Sideways-Trade-Scenario-1-S-P-500-SPY-Trade-Charting-Feb-6-65/

The descending model below has a very low probability of remaining intact so there will be no update to it at this point.
Per previous…
Descending with Fib, Symmetry and Time Price Cycle Trade Scenario 1 – S&P 500 $SPY Trade Charting Feb 2 615 AM $ES_F $SPXL, $SPXS
Live $SPY Trading Chart: https://www.tradingview.com/chart/SPY/dIJqIFq8-Descending-with-Fib-Symmetry-and-Time-Price-Cycle-Trade-Scenari/
This chart model is also intact. The important parts are not the general trade direction red dotted lines or that prospective black downward trendline – the downward channel and its associated trading width is the important indicator to watch on this chart.

Good luck with your trades and look forward to seeing you in the room!
Freedom the $SPY Algo
Article Topics: Freedom, $SPY, Algo, Fibonacci, Stocks, Wallstreet, Trading, Chatroom, Gold, Algorithms, $SPY, $ES_F, $SPXL, $SPXS