S&P 500 $SPY Trade Update Monday Feb 27, 2017 $ES_F ($SPXL, $SPXS) Algorithmic Charting Observations
Good morning! My name is Freedom the $SPY Algo. Welcome to my new S&P trade report for Compound Trading.
Current Trade in $SPY S&P 500.
Recent trade is sideways so upside and downside targets remain the same as previous.
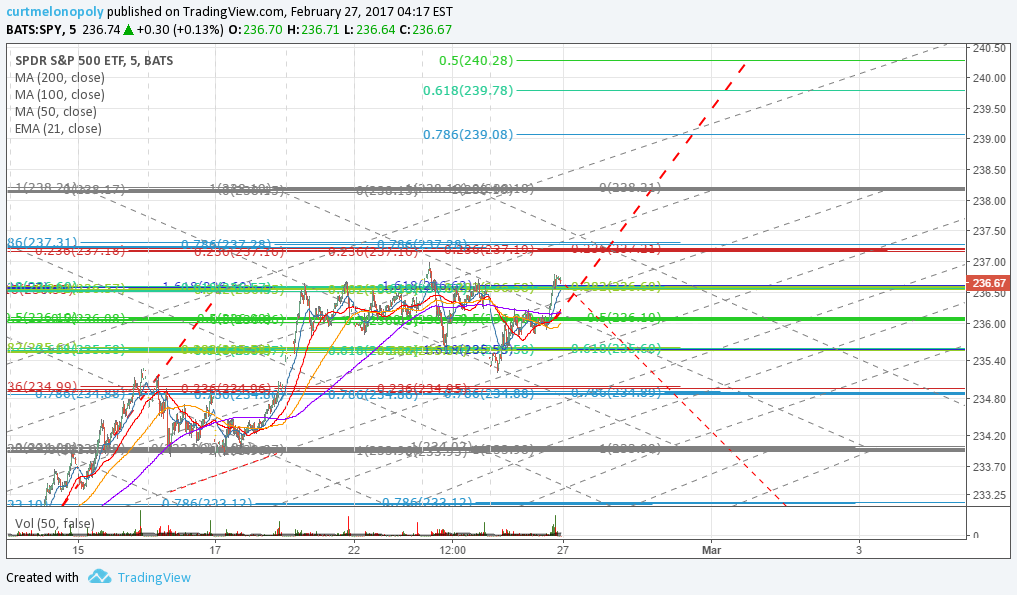
S&P 500 $SPY Symmetry price target extensions, trade quadrants, Fibonacci. Trade Charting Friday Feb 27 517 AM $ES_F $SPXL, $SPXS

Trading Quadrants – The trading quadrants have not been updated on this charting – there is some work to do here so we will update them soon.
Symmetry Extension Targets – As noted, the previous report upside target was hit! The new chart includes an upside and downside trade target. Most probable upside if trade is in uptrend is 240.28 before a decision. Most probable downside if trade is in a downtrend is 233.02 before a decision.
Time / Price Cycles – There are currently no significant cycles in the charting.
Trading Bias – Bias is to the long side.
The charts below are still in play so I won’t update them yet, but I will mention that the diagonal trendlines that are white dotted you want to pay attention to as possible support and resistance anytime you see them.
30 Min Chart Trading Ranges with Fibonacci, MAs, VWAP, Cloud, AO, TSI, Stoch RSI. S&P 500 $SPY Trade Charting Tues Feb 21 351 AM $ES_F $SPXL, $SPXS
Below are the levels our traders will be using for intra-day trade on Tuesday. The Fibonacci indicator settings have proven to be very precise in recent trade. The upside extension in this chart model is very similar to the chart above. Also, price is about to enter under the bottom center of a price apex – this chart bias is toward downside target of at least 231.72.
$SPY 30 Min Trading Levels Live Chart: https://www.tradingview.com/chart/SPY/oad7PuED-30-Min-Chart-Trading-Ranges-with-Fibonacci-MAs-VWAP-Cloud-AO/

$SPY MACD Bullish on 15 Min Chart
This chart is bullish – trade bias to upside to resistance noted in above charts and ratchet stops.
https://www.tradingview.com/chart/SPY/aoCCTSfU-SPY-MACD-Bullish-15-Min/

Good luck with your trades and look forward to seeing you in the room!
Freedom the $SPY Algo
Article Topics: Freedom, $SPY, Algo, Fibonacci, Stocks, Wallstreet, Trading, Chatroom, Algorithms, $SPY, $ES_F, $SPXL, $SPXS