Skip to content

Compound Trading Group

  • About
  • White Paper
  • Returns
  • News
    • NOTICE of Online Information Meetings
  • Order
    • Terms
  • About
  • White Paper
  • Returns
  • News
    • NOTICE of Online Information Meetings
  • Order
    • Terms

US Dollar Index (DXY) Algorithm Report Thurs July 12. $DXY $UUP #USD #Algorithm

  1.   »  
  2. US Dollar Index (DXY) Algorithm Report Thurs July 12. $DXY $UUP #USD #Algorithm
DXY, US Dollar, Algorithm

US Dollar Index (DXY) Algorithm Report Thurs July 12. $DXY $UUP #USD #Algorithm

July 12, 2018December 30, 2018 $DXY US Dollar Index$DXY US Dollar Algo$UUP, Algorithm, Chart, Dollar, DXY, Trading, USD

DXY US Dollar Algorithm Model Charting Report Thursday July 12, 2018 $DXY $UUP

Welcome to my report for Compound Trading – $DXY the US Dollar algorithm charting model.

I am an early development model – one of seven in development at Compound Trading Group. This work is very early stage generation 1 work. Generation 2 – 5 is scheduled for 2018 and will eventually be coded to a digital dashboard for our traders to use as an intelligent assistant.

This charting is to be used in conjunction with conventional charting as trader assisted signals. The signals in the model (at this point) are simple that each line on the model chart are considered a support and resistance test.

Notices:

Feature Post with Charting: How to Trade the US Dollar Index Move (Part 1) $DXY $UUP #USD #trading #chart #algorithm

Password: SWINGDXY Protected: Trading US Dollar Index (Part 2 – Member Exclusive) $DXY $UUP #USD #SwingTrading #Daytrading 

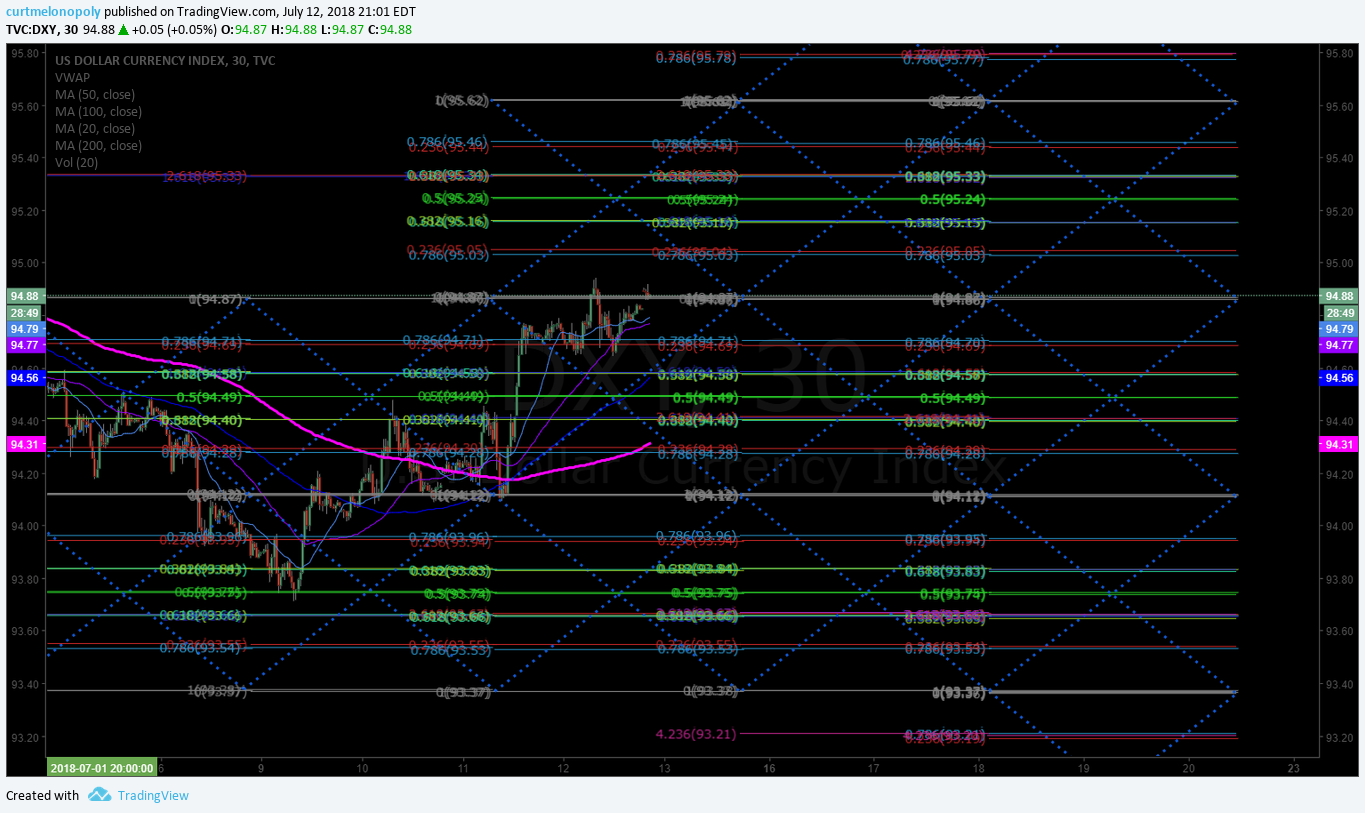
US Dollar Index (DXY) Algorithm. 30 Minute Chart Model $DXY $UUP

US Dollar Index (DXY). Above 200 MA in an upturn on daytrading 30 Min Chart Model. July 12 901 PM $DXY $UUP #algorithm #chart

The mid quad 94.87 area is an important resistance point.

https://www.tradingview.com/chart/DXY/Y84unyhn-US-Dollar-Index-DXY-Above-200-MA-in-an-upturn-on-daytrading-3/

DXY, US Dollar, Algorithm
US Dollar Index (DXY). Above 200 MA in an upturn on daytrading 30 Min Chart Model. July 12 901 PM $DXY $UUP #algorithm #chart

US Dollar Index (DXY). Under pressure from 200 MA on 30 Min Chart Model.June 26 321 AM $DXY $UUP #algorithm #chart

https://www.tradingview.com/chart/DXY/0F1L6Ldp-US-Dollar-Index-DXY-Trade-under-pressure-from-200-MA-on-30-Mi/

US Dollar, Algorithm, $DXY
US Dollar Index (DXY). Under pressure from 200 MA on 30 Min Chart Model.June 26 321 AM $DXY $UUP #algorithm #chart

$DXY Geometric Daily Algorithm Chart Model

US Dollar Index (DXY) Algorithm. Above light blue structure resistance is the orange structure on chart. July 12 949 PM #algorithm $DXY #Chart

https://www.tradingview.com/chart/DXY/9FzZSp7G-US-Dollar-Index-DXY-Algorithm-Above-light-blue-structure-resi/

DXY, Daily, Chart, Algroithm
US Dollar Index (DXY) Algorithm. Above light blue structure resistance is the orange structure on chart. July 12 949 PM #algorithm $DXY #Chart

US Dollar Index (DXY) Algorithm. Structure in play. Trade in geometric structure (light blue). #algorithm $DXY #Chart

https://www.tradingview.com/chart/DXY/NkDFd9dX-US-Dollar-Index-DXY-Algorithm-Structure-in-play-Trade-in-geo/

US Dollar, Algorithm, Geometric, structure
US Dollar Index (DXY) Algorithm. Structure in play. Trade in geometric structure (light blue). #algorithm $DXY #Chart

Per recent;

US Dollar Index (DXY). Geometric algorithm chart model magnified ith test structure. $DXY #Algorithm #Dollar

https://www.tradingview.com/chart/DXY/585wSrIf-US-Dollar-Index-DXY-Geometric-algorithm-chart-model-magnified/

Dollar, DXY, Chart, Algorithm
US Dollar Index (DXY). Geometric algorithm chart model magnified ith test structure. $DXY #Algorithm #Dollar

US Dollar Index (DXY). Algorithm structure in play on daily chart. Trade inside geometric structure (red). #algorithm $DXY #Chart

https://www.tradingview.com/chart/DXY/Av4IQc37-US-Dollar-Index-DXY-Algorithm-structure-in-play-on-daily-char/

DXY, US, Dollar, Chart, Algorithm
US Dollar Index (DXY). Algorithm structure in play on daily chart. Trade inside geometric structure (red). #algorithm $DXY #Chart

Per recent;

Below is the geometric model for the US Dollar. I’ve provided a close up image and a regular image with chart link.

The most important areas of trade structure are the red, orange, blue, yellow triangles.

The chart needs a significant reset, but for now we are watching the structure of the red triangle to see how it concludes.

Close up of Geometric Algorithmic Model for US Dollar Index $DXY.

$DXY Geometric Model Close Up

https://www.tradingview.com/chart/DXY/GD3huNnE-DXY-Geometric-Model/

$DXY Geometric Model

Per recent;

May 13 – Big test with the dollar here. Visually intense on the geometric US Dollar model. $UUP $DXY

Use link below from last report to view real time chart.

$DXY, algorithm, geometric, model
Big test with the dollar here. Visually intense on the geometric US Dollar model. $UUP $DXY

Per recent;

US Dollar $DXY touched 200 MA on daily and backed off. Geometric model charting.

https://www.tradingview.com/chart/DXY/b394Eu1X-US-Dollar-DXY-touched-200-MA-on-daily-and-backed-off-Geometric/

$DXY, daily, geometric, model, chart
April 24 – US Dollar $DXY range bound sideways at support in geometric model charting.

Conventional Charting Considerations:

July 12 – US Dollar Index (DXY) Chart. Trade continues to pressure 200 MA on weekly chart. #chart $DXY #Dollar

https://www.tradingview.com/chart/DXY/KkoF2oCr-US-Dollar-Index-DXY-Chart-Trade-continues-to-pressure-200-MA/

DXY, Weekly, Chart, 200MA
US Dollar Index (DXY) Chart. Trade continues to pressure 200 MA on weekly chart as we expected. #chart $DXY #Dollar

June 25 – No significant structural change to Weekly chart – refer to previous report link below.

Per recent;

US Dollar Index (DXY) Chart. Trade came under pressure at 200 MA on weekly chart as we expected. #chart $DXY #Dollar

https://www.tradingview.com/chart/DXY/3KbxToY4-US-Dollar-Index-DXY-Chart-Trade-came-under-pressure-at-200-MA/

Dollar, $DXY, Chart, US
US Dollar Index (DXY) Chart. Trade came under pressure at 200 MA on weekly chart as we expected. #chart $DXY #Dollar

Per recent;

US Dollar over 50 MA on its way to 200 MA resistance on Weekly Chart. $DXY $UUP

https://www.tradingview.com/chart/DXY/bU1zLzfc-US-Dollar-over-50-MA-on-its-way-to-200-MA-resistance-on-Weekly-C/

US Dollar over 50 MA on its way to 200 MA resistance on Weekly Chart. $DXY $UUP

Per recent;

Bull bear fight is on with dollar closing the week at the 50 MA. Watch that close. $DXY $UUP

https://www.tradingview.com/chart/DXY/du2DtL3W-Bull-bear-fight-is-on-with-dollar-closing-the-week-at-the-50-MA/

Weekly, dollar, chart
Bull bear fight is on with dollar closing the week at the 50 MA. Watch that close. $DXY $UUP

Per recent;

If $DXY US Dollar Index builds structured base over main pivot (red line) it’s a long all day long. $UUP.

https://www.tradingview.com/chart/DXY/PKj5eWu2-If-Dollar-builds-structured-base-over-main-pivot-Notes/

If $DXY -0.18% US Dollar Index -0.18% builds structured base over main pivot (red line) it’s a long all day long. $UUP.

WATCH the MACD for a turn down. Has it’s 200 MA (pink), but that’s not considerable relatively speaking right now.

Watch the pivot and watch the MACD on the daily. MACD turns down and it will be a retrace 99 in 100 times.

daily, dollar, chart
If $DXY US Dollar Index builds structured base over main pivot (red line) it’s a long all day long. $UUP.

Per recent;

$DXY There it is, reach up and touch to 200 MA and a back off intra. MACD trending on Daily.

https://www.tradingview.com/chart/DXY/xM0QQv1p-DXY-There-it-is-reach-up-and-touch-to-200-MA-and-a-back-off-in/

DXY, Daily, Chart, 200 MA, MACD
https://www.tradingview.com/chart/DXY/xM0QQv1p-DXY-There-it-is-reach-up-and-touch-to-200-MA-and-a-back-off-in/

Dollar bulls keep an eye on 200 MA overhead on daily. $DXY #USD $UUP #chart #resistance

https://www.tradingview.com/chart/DXY/DGp06qLl-Dollar-bulls-keep-an-eye-on-200-MA-overhead-on-daily-DXY-USD/

DXY, chart, 200MA, resistance
Dollar bulls keep an eye on 200 MA overhead on daily. $DXY #USD $UUP #chart #resistance

US Dollar News:

Trump’s trade war is undercutting his hopes for the dollar https://finance.yahoo.com/news/trumps-trade-war-undercutting-hopes-dollar-152345957.html?soc_src=social-sh&soc_trk=tw via @YahooFinance

Dollar falls vs yen as trade disputes intensify, yuan at 6-month lows

https://www.reuters.com/article/us-global-forex/dollar-falls-vs-yen-as-u-s-escalates-global-trade-fight-idUSKBN1JM04W

Dollar falls vs yen as trade disputes intensify, yuan at 6-month lows https://t.co/kSEM7pvFov

— $DXY US Dollar Algo (@dxyusd_index) June 26, 2018


Best with your trades and look forward to seeing you in the room!

$DXY US Dollar Algo

Tweets by dxyusd_index

Article Topics: $DXY, Trading, USD, DXY, Dollar, Algorithm, $UUP, Chart

Related

Read More

Post navigation

Previous: Volatility (VIX) Algorithm Report Thurs July 12 $VIX $TVIX, $UVXY, $VXX
Next: Swing Trading Report Sun July 15 (Part B) Earnings Season On-Deck. $TSLA, $IBB, $AGN, $SNAP, $NVO, $CTSH, $LAC, $VGZ, $AMMJ more.
Proudly powered by WordPress | Theme: sharksdesign by reviewexchanger.
 

Loading Comments...