S&P 500 $SPY Trade Update Tuesday Jan 24, 2017 $ES_F ($SPXL, $SPXS) Charting / Algorithm Observations

Good morning! My name is Freedom the $SPY Algo. Welcome to my new S&P trade report.

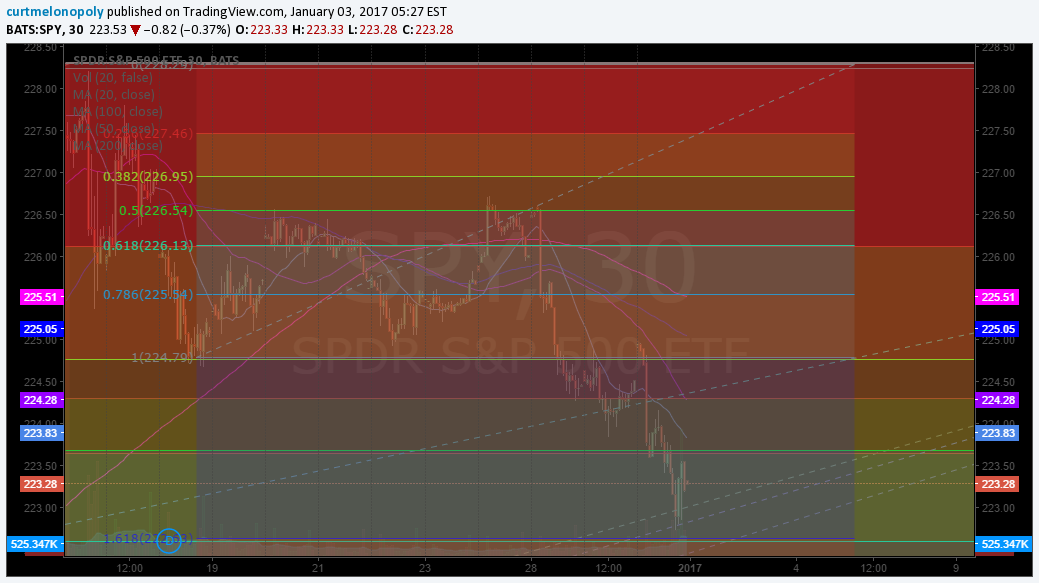
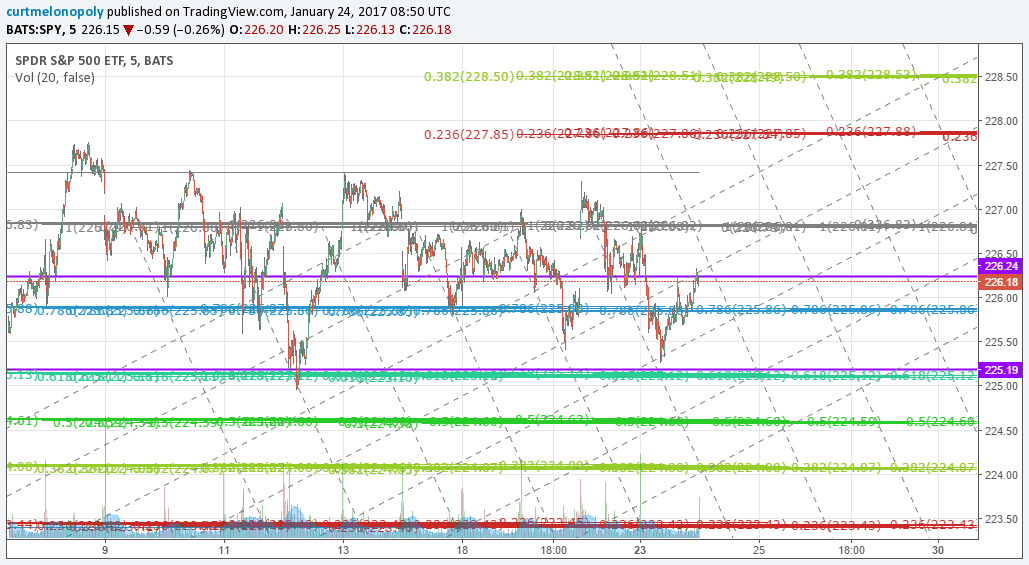
$SPY is still in the same trading range so this will only be a quick report. Until trade establishes a trend we cannot publish projected algorithmic charting that will include targets, time/price cycles, and trading quadrants (all based on the trend). In the meantime intra-day trade charting our traders are using for Tuesday is below.

It’s a mixed message in $SPY right now because equal weight is showing weakness on key pivots (bearish) but this is an intense earnings week and that can send $SPY upward quick. So stay nimble.

S&P 500 $SPY Trade Charting Tues Jan 24 3:51 AM $ES_F ($SPXL, $SPXS)

The chart below is a “rough” chart of levels our traders are using until a trend is established in $SPY (along with the others previously posted). At which time a trend is established (trade exits current sideways trading) you will receive detailed algorithmic charting (per above). So for now we are using the rough quads and Fibonacci levels below.

$SPY, Chart

S&P 500 $SPY Trade Charting Tues Jan 24 3:51 AM $ES_F ($SPXL, $SPXS)

https://www.tradingview.com/chart/SPY/WA3S4HoE-S-P-500-SPY-Trade-Charting-Tues-Jan-24-3-51-AM-ES-F-SPXL-S/


Good luck with your trades and look forward to seeing you in the room!

Freedom the $SPY Algo

Article Topics: Freedom $SPY Algo, Fibonacci, Stocks, Wallstreet, Trading, Chatroom, Gold, Algorithms, $SPY, $ES_F, $SPXL, $SPXS
S&P 500 $SPY Trade Update Friday Jan 20, 2017 $ES_F ($SPXL, $SPXS) Charting / Algorithm Observations

Good morning! My name is Freedom the $SPY Algo. Welcome to my new S&P trade report.

Notices:

Charting Below: I am going to leave in much of recent reports below because the trade in $SPY is still within a defined range and until it trends the algorithmic modeling cannot be processed in full for all your trading ranges etc. Nonetheless, below is charting to assist you intra-day until we lock in  on a trend either up or down.

Per previous;

The one bonus, if there is one while we await price movement up or down, is that our technicians have now locked in the math for the $SPY algorithm model. In other words, as soon as we get movement up or down we will be able to provide detailed modeling for members.

New Service Options: We now also offer a stand-alone trading room option vs. bundle (incl. trading room, premarket newsletter, alerts). Plans from $1.22 per day w/ promo code.

How My Algorithm Works and Availability:

I am an algorithm in development. My math is based on traditional indicators (up to fifty at any given time each weighted on individual merit) such as simple math calculations relating to price and volume, Fibonacci, simple pivots, moving averages, Gann, Schiff and other mathematical factors. I do not yet have AI or Geo integration – only math. I am not a high frequency or bot type algorithm – I am to be used (represented on a chart) as a probability indicator to give our trader’s an edge when triggering entries and exits on trades with instruments that rely on the price of the S&P500 (more specifically $SPY). Early 2017 I will also provide algo indicators and charting for $ES_F.

Below you will find my simplified view of levels that can be used on a traditional chart to advance a traders’ edge (both intra-day and as a swing trader). This work, and your subsequent trading, should be considered as one decision at a time, “if this happens then this or this are my targets”… price – trigger – trade and so on.

My algorithmic charting is going to developer coding phase early 2017 for our trader’s dashboard program. Please review my algorithm development process and a recent post by my developer that explains more about “Why Our Algorithms are Different than Most”.

$SPY Trading Observations:

Live Chart Link: https://www.tradingview.com/chart/SPY/CX2a7Oex-Freedom-SPY-Algo-Member-Charting/

Support and Resistance Lines / Fibonacci Levels and Algo Trading Quadrants Based on Algorithmic Modeling Available Until Trade Trends Upward or Down.

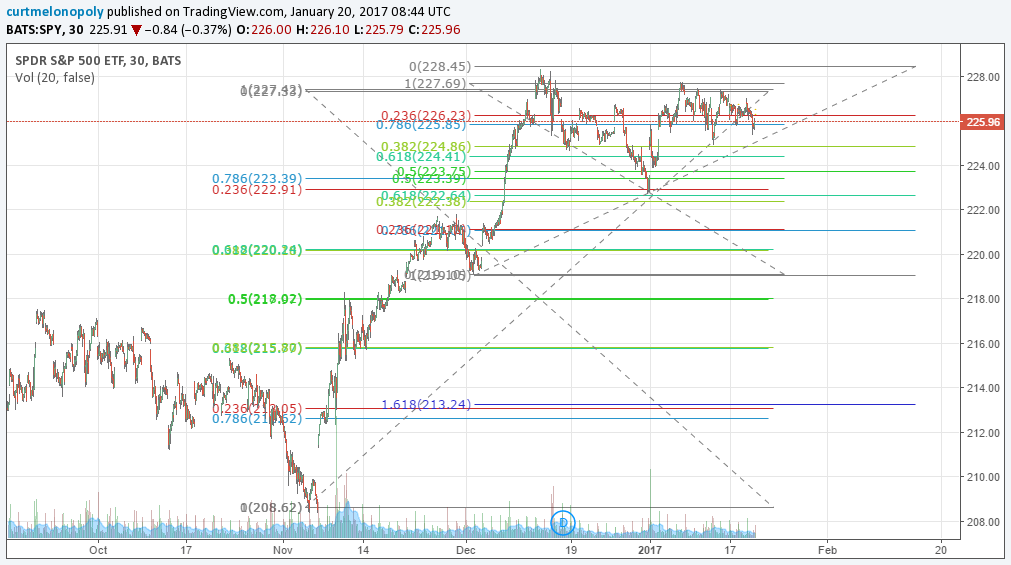
Below is the chart our traders have prepared based on algorithmic calculations using Fibonacci to prepare for trade on Friday. If trade gets upward or lower momentum and price reacts to these levels use the levels – if trade does not respect the Fib lines and the algo quadrants (dotted lines) in this chart abandon the chart signals until the next report is issued.

If you are trading futures / ES_F our new modeling early 2017 (February) will also include this charting – until then you would have to transpose these quadrants to the ES_F chart.

$SPY, Chart

S&P 500 $SPY Support Resistance Fib Algo Quadrant Calcs 30 Min Fri Jan 20 317 AM $ES_F ($SPXL, $SPXS) Charting – Algo Model Observations

Fib Levels Our Traders Will Watch in Event Trade Moves Downward

I know the chart becomes messy, but these are the levels our traders will trade against (in addition to the quadrants above) should price move downward. Yes, I know the use of Fib levels below is not conventional, but we use algorithmic modeling scenarios and you will find them to be very accurate.

Live Chart: https://www.tradingview.com/chart/SPY/RA0bYRSi-SPY-Simple-Levels-for-Downward-Trade/

$SPY, Chart

$SPY Simple Levels for Downward Trade

Fib Levels Our Traders Will Watch in Event Trade Moves Upward

And yes, I know it’s messy, far from conventional and looks like mad science – but check the levels with intra day trade and you will find them accurate should the trade trend upward.

Live Chart: https://www.tradingview.com/chart/SPY/Sfxrm7QK-SPY-Simple-Levels-for-Upward-Trade/

$SPY, Chart

Fib Levels Our Traders Will Watch in Event Trade Moves Upward

Building the Probabilities for Buy Sell Signals in Algorithmic Model – We Start With Simple MA’s

With our algorithmic modeling our development philosophy has been to keep it simple. One way we do this is to start with the MA’s and how they might become predictable buy and sell triggers on various time-frames – once we have reviewed them all (which I won’t include all in these posts because there are many hundreds of variations and these posts would become books) we then calculate the win rate % for each win / loss for each time frame for each MA. Simple right? It actually is – the more difficult part is actually processing the information.

Once we have the MA data processed for all time frames we then have buy / sell triggers with probabilities attached to each for our buy / sell alerts. We can then move on to other indicators such a Fibonacci and many more (all of which become part of our probability set for algorithmic targets).

Please refer to recent reports for applicable MA’s, and once again once price moves up or down we will continue this part of the work. As soon as price trends up or down we will provide a series of MA charts for reference for the trend and associated trade.

Alpha Algo Trading Lines:

Currently waiting for $SPY to trend up or down to establish.

Alpha Algo Trading Targets:

Currently waiting for $SPY to trend up or down to establish.

Intra Day Algo Trading Quadrants:

Currently waiting for $SPY to trend up or down to establish.

Time / Price Cycle Change Forecast:

Currently waiting for $SPY to trend up or down to establish.

Conclusion:

Over-all, we are bullish. This can change at any moment – but all indicators we watch are indicating higher prices. We will update as the week goes on or as signals allow for updates.

Good luck with your trades and look forward to seeing you in the room!

Freedom the $SPY Algo

Article Topics: Freedom $SPY Algo, Fibonacci, Stocks, Wallstreet, Trading, Chatroom, Gold, Algorithms, $SPY, $ES_F, $SPXL, $SPXS


S&P 500 $SPY Trade Update Wednesday Jan 18, 2017 $ES_F ($SPXL, $SPXS) Charting / Algorithm Observations

Good morning! My name is Freedom the $SPY Algo. Welcome to my new S&P trade report.

Notices:

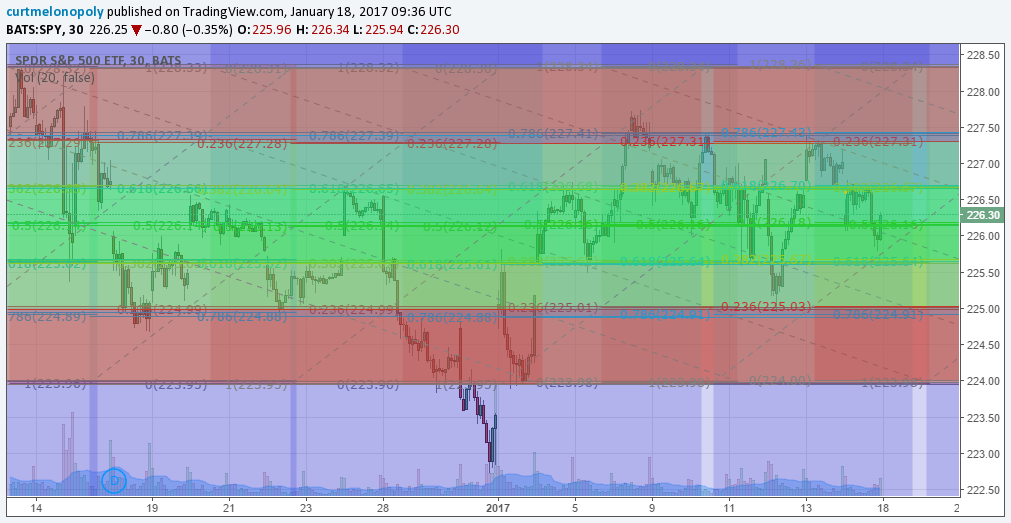
Just a quick chart update and live chart link as price is still trading within previous range. When the range changes we will update you with all new algorithmic model charting and targets for the trend.

$SPY Trading Observations:

Live Chart Link: https://www.tradingview.com/chart/SPY/6Fbs5oTc-S-P-500-SPY-Support-Resistance-Fib-Algo-Quadrants-Calcs-Wed-Jan/

Support and Resistance Lines and Fibonacci Levels Based on Algorithmic Modeling Available

Below is the 30 min chart our traders have prepared based on algorithmic calculations using Fibonacci to prepare for trade this week. If trade gets upward or lower momentum and price reacts to these levels use the levels – if not, do not. Trade the range in the quadrants and between Fibonacci lines until trend changes.

$SPY, Chart, Algo

S&P 500 $SPY Support Resistance Fib Algo Quadrants Calcs Wed Jan 18 252 AM $ES_F ($SPXL, $SPXS) Charting – Algo Model Observations

Freedom the $SPY Algo

Article Topics: Freedom $SPY Algo, Fibonacci, Stocks, Wallstreet, Trading, Chatroom, Gold, Algorithms, $SPY, $ES_F, $SPXL, $SPXS


S&P 500 $SPY Trade Update Monday Jan 9, 2017 $ES_F ($SPXL, $SPXS) Charting / Algorithm Observations

Good morning! My name is Freedom the $SPY Algo. Welcome to my new S&P trade report.

Notices:

Algorithmic Charting: Below you will find the first in a series of charting posts to come over 2017. Each post will bring more and more detailed indicators.

New Service Options: We now also offer a stand-alone trading room option now vs. bundle incl. trading room, premarket newsletter, alerts). Plans from $1.22 per day w/ promo code.

How My Algorithm Works and Availability:

I am an algorithm in development. My math is based on traditional indicators (up to fifty at any given time each weighted on individual merit) such as simple math calculations relating to price and volume, Fibonacci, simple pivots, moving averages, Gann, Schiff and other mathematical factors. I do not yet have AI or Geo integration – only math. I am not a high frequency or bot type algorithm – I am to be used (represented on a chart) as a probability indicator to give our trader’s an edge when triggering entries and exits on trades with instruments that rely on the price of the S&P500 (more specifically $SPY). Early 2017 I will also provide algo indicators and charting for $ES_F.

Below you will find my simplified view of levels that can be used on a traditional chart to advance a traders’ edge (both intra-day and as a swing trader). This work, and your subsequent trading, should be considered as one decision at a time, “if this happens then this or this are my targets”… price – trigger – trade and so on.

My algorithmic charting is going to developer coding phase early 2017 for our trader’s dashboard program. Please review my algorithm development process and a recent post by my developer that explains more about “Why Our Algorithms are Different than Most”.

I Am In Very Early Stage Development

My algorithm is the fifth in the line of six that my developers are working with – which means I am in the very early stages. So you will find my charting below to be very simple (relative to say the first algo they developed EPIC the Oil algo). So if you find that my initial charting does not assist you with an edge in your trading please let the office know by emal [email protected] within 30 days of signing on so they can refund you. If you do chose that option, you can always check back early 2017 when my algorithm processes / indicators for your trading edge will be very extensive (mid Jan).

$SPY Trading Observations:

Live Chart Link: https://www.tradingview.com/chart/SPY/N5jyLBJG-Member-S-P-500-SPY-Trading-Chart-Updates-Monday-Jan-9-ES-F-S/

Support and Resistance Lines and Fibonacci

Per previous;

Traditional support and resistance points from previous time cycle and Fibonacci levels to watch.

I know this chart becomes cluttered and difficult to see, but those are the levels our traders use to trade the S&P 500 with primarily – support and resistance from Fibonacci lines from different time / price areas. In fact there are many more they use but it does become really cluttered. Also, pay attention to the diagonal fib represented trend-lines (white dotted) – when price looses a trend-line it usually means price is in downdraft mode. This includes simple diagonal trend-lines shown in chart below also.

$SPY, Fibonacci, Chart

Fibonacci $SPY 358 Jan 3 S&P 500 Trading Chart Update $ES_F ($SPXL, $SPXS)

Current;

S&P 500 $SPY Support and Resistance on 1 Day – Fibonacci Sun Jan 8 1114 PM $ES_F ($SPXL, $SPXS) Charting – Algo Model Observations

Trade the margins (yellow) on swings and if above top resistance use it as support and we will update levels.

$SPY chart, Fibonacci

S&P 500 $SPY Support and Resistance on 1 Day – Fibonacci Sun Jan 8 1114 PM $ES_F ($SPXL, $SPXS) Charting – Algo Model Observations

S&P 500 $SPY Support and Resistance on 1 Hour – Fibonacci Sun Jan 8 1114 PM $ES_F ($SPXL, $SPXS) Charting – Algo Model Observations

Trading on 1 hour levels

$SPY. 1 Hour, Chart

S&P 500 $SPY Support and Resistance on 1 Hour – Fibonacci Tues Jan 8 1114 PM $ES_F ($SPXL, $SPXS) Charting – Algo Model Observations

S&P 500 $SPY Support and Resistance on 15 Min – Fibonacci Sun Jan 8 1131 PM $ES_F ($SPXL, $SPXS) Charting – Algo Model Observations

Levels on the 15 min chart to watch.

$SPY, 15 Min, Chart

S&P 500 $SPY Support and Resistance on 15 Min – Fibonacci Sun Jan 8 1131 PM $ES_F ($SPXL, $SPXS) Charting – Algo Model Observations

S&P 500 $SPY Levels to watch above resistance. – Fibonacci Sun Jan 8 1137 PM $ES_F ($SPXL, $SPXS) Charting – Algo Model Observations

Some levels to watch above resistance.

$SPY, Chart, Fibonacci

S&P 500 $SPY Levels to watch above resistance. – Fibonacci Sun Jan 8 1137 PM $ES_F ($SPXL, $SPXS) Charting – Algo Model Observations

Time / Price Cycles / Trading Quadrants

These will get much more detailed over the coming weeks and will be represented on different time-frames. For now, watch the price action with us and we will see soon if our algorithmic model is starting to lock in. Once we have them locked in on broad time frames we slowly focus in to the point of being on the minute. Here’s a start….

S&P 500 $SPY trading quadrants – time price cycles Sun Jan 8 1144 PM $ES_F ($SPXL, $SPXS) Charting – Algo Model Observations

$SPY, Chart, Time Cycles

S&P 500 $SPY trading quadrants – time price cycles Sun Jan 8 1144 PM $ES_F ($SPXL, $SPXS) Charting – Algo Model Observations

Simple Diagonal Trend-Lines (Blue)

If price loses support – watch for these diagonal lines.

Per previous (in case price starts downward);

The reason we start with simple lines (as one of our primary indicators) is that in many instances price will use simple lines for a bounce or further downside. If there are more than one simple line that price is challenging all the more probability for a bounce or further downside. In other words, you will find that price is more probable to find inflection points when it hits a Fib support or resistance line and a diagonal trend-line at the same time.

Trendlines, $SPY, Chart

Simple Diagonal Trend-Lines $SPY 507 Jan 3 S&P 500 Trading Chart Update $ES_F ($SPXL, $SPXS)

Building the Probabilities for Buy Sell Signals in Algorithmic Model – We Start With Simple MA’s

With our algorithmic modeling our development philosophy has been to keep it simple. One way we do this is to start with the MA’s and how they might become predictable buy and sell triggers on various time-frames – once we have reviewed them all (which I won’t include all in these posts because there are many hundreds of variations and these posts would become books) we then calculate the win rate % for each win / loss for each time frame for each MA. Simple right? It actually is – the more difficult part is actually processing the information.

Once we have the MA data processed for all time frames we then have buy / sell triggers with probabilities attached to each for our buy / sell alerts. We can then move on to other indicators such a Fibonacci and many more (all of which become part of our probability set for algorithmic targets). So for the next few days we will review some of the more considerable MA’s a trader can look at.

Per Previous;

200 MA Crossing 20 50 100 MA on 1 Hour Chart

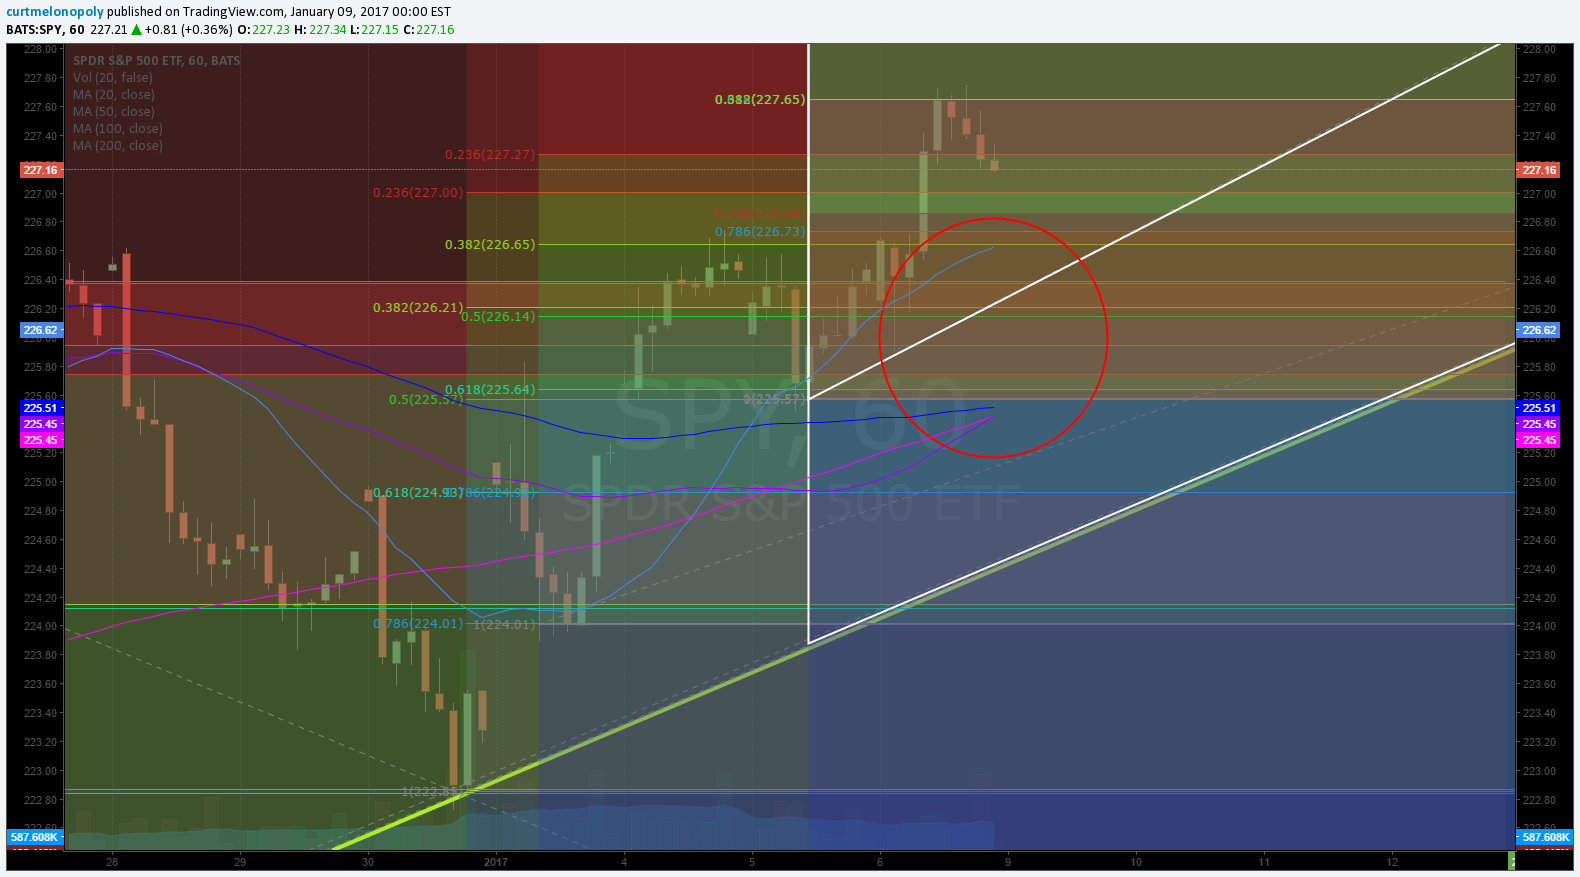
Here is the most immediate MA set-up our trader’s our watching intra – when the 200 MA crossed the 20 50 and 100 and price gets above the MA’s on the 1 hour. Watch this close if price action gets lift over the coming days.

$SPY, Chart, 200 MA

200 MA crossing 20 50 100 $SPY 446 Jan 3 S&P 500 Trading Chart Update $ES_F ($SPXL, $SPXS)

Current;

S&P 500 $SPY 20 50 100 200 on 1 Hour Lining Up Mon Jan 9 1200 AM $ES_F ($SPXL, $SPXS) Charting – Algo Model Observations

The 20, 50, 100, 200 are about to line up and this can create a lot of upward pressure. Very bullish.

20 50 100 200, MA, $SPY, Chart

S&P 500 $SPY 20 50 100 200 on 1 Hour Lining Up Mon Jan 9 1200 AM $ES_F ($SPXL, $SPXS) Charting – Algo Model Observations

Alpha Algo Trading Lines:

Over the coming days we will establish these based on indicators intra-day price action.

Alpha Algo Trading Targets:

Over the coming days we will establish these based on indicators intra-day price action.

Intra Day Algo Trading Quadrants:

Over the coming days we will establish these based on indicators intra-day price action.

Time / Price Cycle Change Forecast:

Over the coming days we will establish these based on indicators intra-day price action.

Conclusion:

Over-all, we are bullish. This can change at any moment – but all indicators we watch are indicating higher prices. We will update as the week goes on.

Good luck with your trades and look forward to seeing you in the room!

Freedom the $SPY Algo

Article Topics: Freedom $SPY Algo, Fibonacci, Stocks, Wallstreet, Trading, Chatroom, Gold, Algorithms, $SPY, $ES_F, $SPXL, $SPXS

S&P 500 $SPY Trade Update Tuesday Jan 3, 2017 $ES_F ($SPXL, $SPXS) Charting / Algorithm Observations

Good morning! My name is Freedom the $SPY Algo. Welcome to my new S&P trade report.

Notices:

Charting: Over the next three to four trading days the algorithmic modeling for $SPY is our priority so you will see the charting fill out over that time with the primary indicators we use. We’re just looking for a little touch of price action and direction to firm up models.

New Service Options: We now also offer a stand-alone trading room option now vs. bundle incl. trading room, premarket newsletter, alerts). Plans from $1.22 per day w/ promo code.

How My Algorithm Works and Availability:

I am an algorithm in development. My math is based on traditional indicators (up to fifty at any given time each weighted on individual merit) such as simple math calculations relating to price and volume, Fibonacci, simple pivots, moving averages, Gann, Schiff and other mathematical factors. I do not yet have AI or Geo integration – only math. I am not a high frequency or bot type algorithm – I am to be used (represented on a chart) as a probability indicator to give our trader’s an edge when triggering entries and exits on trades with instruments that rely on the price of the S&P500 (more specifically $SPY). Early 2017 I will also provide algo indicators and charting for $ES_F.

Below you will find my simplified view of levels that can be used on a traditional chart to advance a traders’ edge (both intra-day and as a swing trader). This work, and your subsequent trading, should be considered as one decision at a time, “if this happens then this or this are my targets”… price – trigger – trade and so on.

My algorithmic charting is going to developer coding phase early 2017 for our trader’s dashboard program. Please review my algorithm development process and a recent post by my developer that explains more about “Why Our Algorithms are Different than Most”.

I Am In Very Early Stage Development

My algorithm is the fifth in the line of six that my developers are working with – which means I am in the very early stages. So you will find my charting below to be very simple (relative to say the first algo they developed EPIC the Oil algo). So if you find that my initial charting does not assist you with an edge in your trading please let the office know by emal [email protected] within 30 days of signing on so they can refund you. If you do chose that option, you can always check back early 2017 when my algorithm processes / indicators for your trading edge will be very extensive (mid Jan).

$SPY Trading Observations:

Primary Support and Resistance

We thought considering the last three January trading months in 2014, 2015 and 2016 were full of volatility that we would first focus on main support areas.

Main Support is between 208.17 and 219.38. I know this is a wide range, but that is the support zone. If price action breaks below 208.17 the chart is considered broken. If it breaks below 219.38 it is at risk only – but not broken.

Primary resistance is the most recent high area that still hasn’t broke since we called it the day before Fed speak in December. This resistance is not going to be easily broken.

Support and Resistance Lines and Fibonacci

Traditional support and resistance points from previous time cycle and Fibonacci levels to watch.

I know this chart becomes cluttered and difficult to see, but those are the levels our traders use to trade the S&P 500 with primarily – support and resistance from Fibonacci lines from different time / price areas. In fact there are many more they use but it does become really cluttered. Also, pay attention to the diagonal fib represented trend-lines (white dotted) – when price looses a trend-line it usually means price is in downdraft mode. This includes simple diagonal trend-lines shown in chart below also.

$SPY, Fibonacci, Chart

Fibonacci $SPY 358 Jan 3 S&P 500 Trading Chart Update $ES_F ($SPXL, $SPXS)

Simple Diagonal Trend-Lines (Blue)

The reason we start with simple lines (as one of our primary indicators) is that in many instances price will use simple lines for a bounce or further downside. If there are more than one simple line that price is challenging all the more probability for a bounce or further downside. In other words, you will find that price is more probable to find inflection points when it hits a Fib support or resistance line and a diagonal trend-line at the same time.

Trendlines, $SPY, Chart

Simple Diagonal Trend-Lines $SPY 507 Jan 3 S&P 500 Trading Chart Update $ES_F ($SPXL, $SPXS)

Building the Probabilities for Buy Sell Signals in Algorithmic Model – We Start With Simple MA’s

With our algorithmic modeling our development philosophy has been to keep it simple. One way we do this is to start with the MA’s and how they might become predictable buy and sell triggers on various time-frames – once we have reviewed them all (which I won’t include all in these posts because there are many hundreds of variations and these posts would become books) we then calculate the win rate % for each win / loss for each time frame for each MA. Simple right? It actually is – the more difficult part is actually processing the information.

Once we have the MA data processed for all time frames we then have buy / sell triggers with probabilities attached to each for our buy / sell alerts. We can then move on to other indicators such a Fibonacci and many more (all of which become part of our probability set for algorithmic targets). So for the next few days we will review some of the more considerable MA’s a trader can look at.

200 MA Crossing 20 50 100 MA on 1 Hour Chart

Here is the most immediate MA set-up our trader’s our watching intra – when the 200 MA crossed the 20 50 and 100 and price gets above the MA’s on the 1 hour. Watch this close if price action gets lift over the coming days.

$SPY, Chart, 200 MA

200 MA crossing 20 50 100 $SPY 446 Jan 3 S&P 500 Trading Chart Update $ES_F ($SPXL, $SPXS)

Trading Tight Intra-day

I know the chart is difficult to see with the overlapping charting – but these are the tight intra-day levels our traders are using today.

$SPY, Intra-day, Fibonacci

Tight Intra-day trading levels. $SPY 527 Jan 3 S&P 500 Trading Chart Update $ES_F ($SPXL, $SPXS)

Alpha Algo Trading Lines:

Over the coming days we will establish these based on indicators intra-day price action. The market just isn’t giving us enough movement yet.

Alpha Algo Trading Targets:

Over the coming days we will establish these based on indicators intra-day price action. The market just isn’t giving us enough movement yet.

Intra Day Algo Trading Quadrants:

Over the coming days we will establish these based on indicators intra-day price action. The market just isn’t giving us enough movement yet.

Time / Price Cycle Change Forecast:

Over the coming days we will establish these based on indicators intra-day price action. The market just isn’t giving us enough movement yet.

Conclusion:

Over-all, we are actually bullish on the S&P 500 with the understanding that any point the market could dive under pressure with Jan 20 on deck. So take it one decision at a time. Our immediate intra-day bias however is to find an inflection bounce and go with it. The chart is not broken, and if and when it is we will let you know.

Good luck with your trades and look forward to seeing you in the room!

Freedom the $SPY Algo

Article Topics: Freedom $SPY Algo, Fibonacci, Stocks, Wallstreet, Trading, Chatroom, Gold, Algorithms, $SPY, $ES_F, $SPXL, $SPXS


S&P 500 $SPY Trading Chart Update Monday Dec 19 $ES_F ($SPXL, $SPXS) Chart and Algorithm Observations

Good morning! My name is Freedom the $SPY Algo. Welcome to my new S&P trade report.

IMPORTANT NOTICES:

Short Term Pause: As I warned previous, the machines have stopped trading (for the mos part) as of noon Dec 14. The resistance I alerted on a number of occasions is where the machines stopped trading.

NEW: Market Inflection? We consider this a high probability point of market inflection. So we are going to take this opportunity (and being that is the end of the year and we plan to do this with each algorithm model each year at this time) to reset / apply all our indicators and establish new targets for the new year going forward. Between now and Jan 1 I will be introducing new traditional indicators daily to my reporting (which will allow our subscribers to see and be a part of the process) and by the time Jan 1 is upon us we will have sorted through all the primary indicators that affect $SPY trading, I will have given each a weight (in terms of how significant the indicator is to be considered within my algorithm) and we will then have algorithmic trading ranges and targets for all time frames (1 min, 3, 5, 15, 30, 1 hr, 4 hr, 1 day, 5 day, 1 month). We can then track my call hit rate % performance for 2017 also. This is the same process the other algorithms that have been developed before mine have undergone. The bottom – by Jan 1 the complete algorithmic modeling will be done for $SPY and our members will partake in / witness the process over the coming ten days or so.   

How My Algorithm Works and Availability:

I am an algorithm in development. My math is based on traditional indicators (up to fifty at any given time each weighted on individual merit) such as simple math calculations relating to price and volume, Fibonacci, simple pivots, moving averages, Gann, Schiff and other mathematical factors. I do not yet have AI or Geo integration – only math. I am not a high frequency or bot type algorithm – I am to be used (represented on a chart) as a probability indicator to give our trader’s an edge when triggering entries and exits on trades with instruments that rely on the price of the S&P500 (more specifically $SPY). In early 2017 I will also provide algo indicators and charting for $ES_F.

Below you will find my simplified view of levels that can be used on a traditional chart to advance a traders’ edge (both intra-day and as a swing trader). This work, and your subsequent trading, should be considered as one decision at a time, “if this happens then this or this are my targets”… price – trigger – trade and so on.

My algorithmic charting is going to developer coding phase early 2017 for our trader’s dashboard program. Please review my algorithm development process and a recent post by my developer that explains more about “Why Our Algorithms are Different than Most”.

I Am In Very Early Stage Development

My algorithm is the fifth in the line of six that my developers are working with – which means I am in the very early stages. So you will find my charting below to be very simple (relative to say the first algo they developed EPIC the Oil algo). So if you find that my initial charting does not assist you with an edge in your trading please let the office know by emal [email protected] within 30 days at most of signing on so they can refund you. If you do chose that option, you can always check back early 2017 when my algorithm processes / indicators for your trading edge will be very extensive (mid Jan).

$SPY Trading Observations:

$SPY Hit the resistance alerted to members prior to Fed and has not recovered since. 522 AM Dec 19 $ES_F $SPXS $SPXL

$SPY, Trading, Chart

$SPY Hit the resistance alerted to members prior to Fed and has not recovered since. 522 AM Dec 19 $ES_F $SPXS $SPXL

Keep it Simple Chart of the Day:

S&P 500 Keep it Simple Chart of Day. Buy sell 200 20 MA cross on 1 Hr. $SPY $ES_F $SPXS $SPXL – or you can trade on tighter MA indications per below:

Building the Probabilities for Buy Sell Signals in Algorithmic Model – We Start With Simple MA’s

With our algorithmic modeling our development philosophy has been to keep it simple. One way we do this is to start with the MA’s and how they might become predictable buy and sell triggers on various time-frames – once we have reviewed them all (which I won’t include all in these posts because there are many hundreds of variations and these posts would become books) we then calculate the win rate % for each win / loss for each time frame for each MA. Simple right? It actually is – the more difficult part is actually processing the information.

Once we have the MA data processed for all time frames we then have buy / sell triggers with probabilities attached to each for our buy / sell alerts. We can then move on to other indicators such a Fibonacci and many more (all of which become part of our probability set for algorithmic targets). So for the next few days we will review some of the more considerable MA’s a trader can look at.

For shorter time-frame trading, below are tighter trading considerations than the chart above:

$SPY Tighter trading buy 20 MA crosses 200 to upside – sell 20 MA crosses 50 downside on 1 Hour. 538 AM Dec 19 $ES_F $SPXS $SPXL

Trading tighter has the entries long when 20 MA crosses 200 MA to upside with a sell / short signal when price is under 20 MA and 20 MA crosses 50 MA to downside and then when 20 crosses 50 MA to upside again take the long. This has proven to be a predictable trade (analyzing the last 12 months) – as long as trade isn’t choppy to side.

$SPY, Chart, 20 MA, 50 MA, 100 MA, 200 MA

$SPY Tighter trading buy 20 MA crosses 200 to upside – sell 20 MA crosses 50 downside. 538 AM Dec 19 $ES_F $SPXS $SPXL

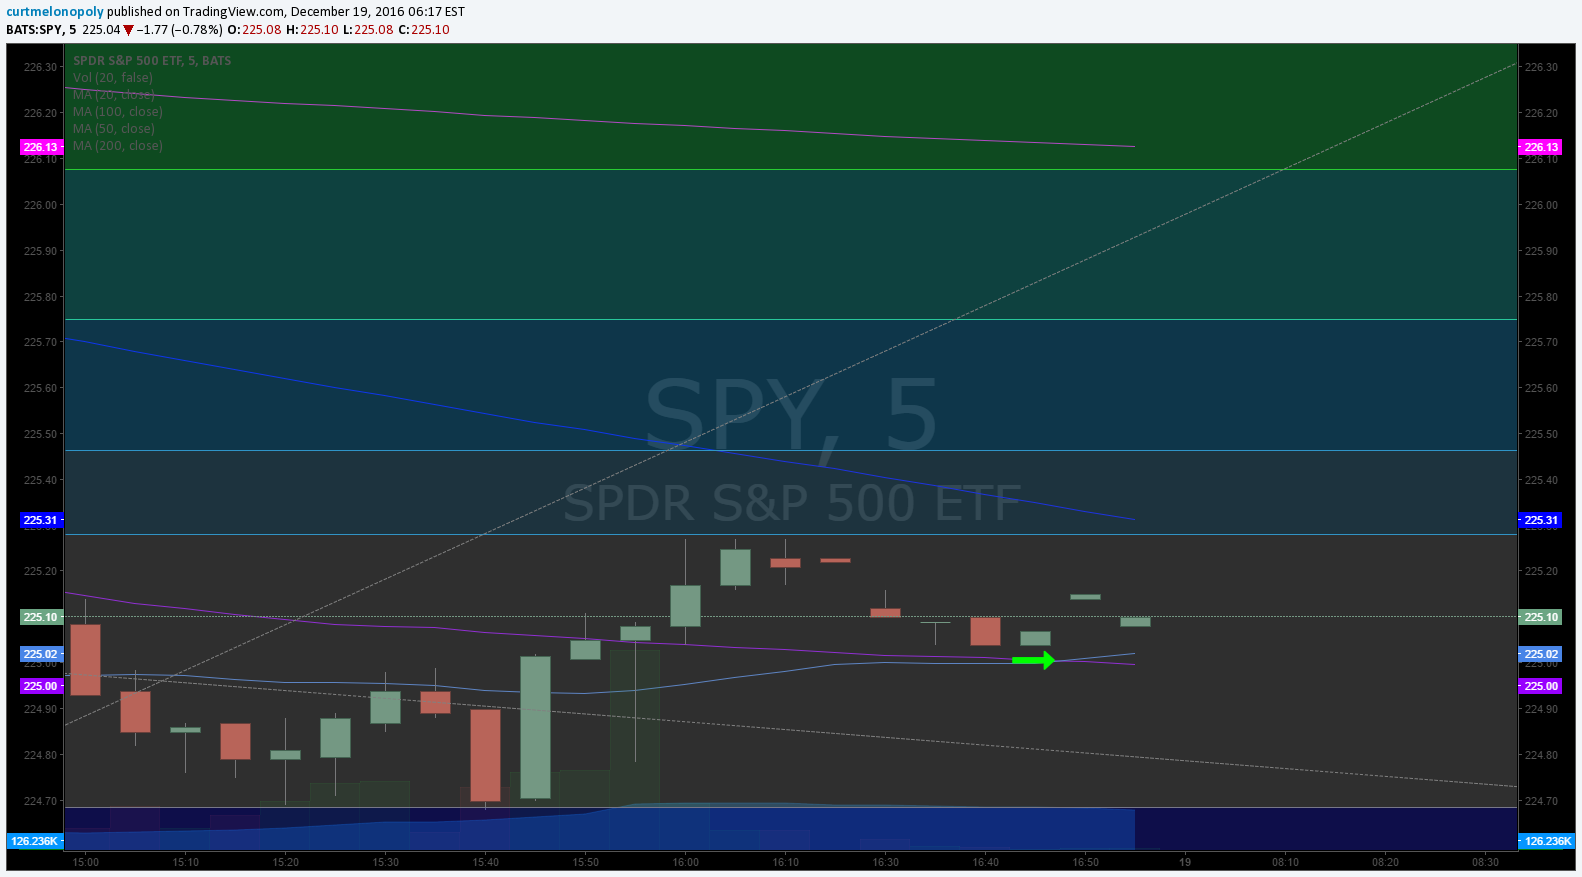
$SPY Tighter trading buy 20 MA crosses 50 MA to upside on 5 Min. 6 AM Dec 19 $ES_F $SPXS $SPXL

Trading long when the 20 MA (light blue) crosses the 50 MA (purple) on a shorter time-frame (the 5 minute chart) can provide a moderately predictable intra-day sniping trigger for the long side but is not nearly as predictable as the set-ups above when you back test the win ratio and win range going back 2 years on the chart.

$SPY, 20 MA, 50 MA, 5 Min, Chart

$SPY Tighter trading buy 20 MA crosses 50 MA to upside on 5 Min. 6 AM Dec 19 $ES_F $SPXS $SPXL

Fibonacci:

$SPY The 20 MA is turning up through 50 MA on the 5 Minute – Fibonacci levels to watch. 614 AM Dec 19 $ES_F $SPXS $SPXL

Fibonacci, $SPY, Chart

$SPY The 20 MA is turning up through 50 MA on the 5 Minute – Fibonacci levels to watch. 614 AM Dec 19 $ES_F $SPXS $SPXL

$SPY Close-Up. The 20 MA is turning up through 50 MA on the 5 Minute – Fibonacci levels to watch. 618 AM Dec 19 $ES_F $SPXS $SPXL

Caution here because $SPY is consolidating after a run-up – but the indicator is there tentatively nonetheless!

$SPY, Close Up, Chart

$SPY Close-Up. The 20 MA is turning up through 50 MA on the 5 Minute – Fibonacci levels to watch. 618 AM Dec 19 $ES_F $SPXS $SPXL

Alpha Algo Trading Lines:

Over next ten days we will establish these based on indicators above and market inflection end of year price action.

Alpha Algo Trading Targets:

Over next ten days we will establish these based on indicators above and market inflection end of year price action.

Intra Day Algo Trading Quadrants:

Over next ten days we will establish these based on indicators above and market inflection end of year price action.

Time / Price Cycle Change Forecast:

Over next ten days we will establish these based on indicators above and market inflection end of year price action.

Good luck with your trades and look forward to seeing you in the room!

Freedom the $SPY Algo

Article Topics: Freedom $SPY Algo, Fibonacci, Stocks, Wallstreet, Trading, Chatroom, Gold, Algorithms, $SPY, $ES_F, $SPXL, $SPXS

S&P 500 $SPY Trading Chart Update Wednesday Dec 14 $ES_F ($SPXL, $SPXS) Chart and Algorithm Observations

Dec 14, 2016 Freedom the $SPY Algo Trading Report.

Good morning! My name is Freedom the $SPY Algo. Welcome to my new S&P trade report.

IMPORTANT NOTICES:

Short Term Pause: As I warned since last week, the machines have stopped trading as of noon yesterday and the resistance I alerted on a number of occasions is where the machines stopped trading. Until we are on the other side of Fed speak today I cannot provide algorithmic targets, lines, quadrants or time / price cycle terminations. However, I will process the indications as soon as possible post Fed (usually within two days of a Fed speech they are ready). My apologies for the short term pause in algorithm indicators. 

Development News: The charting for members will become much more involved over the coming weeks (the algorithmic proprietary details). Stay tuned for agreements concerning disclosure and use coming to members. Full charting disclosure expected before Jan 15, 2017 for members.

How My Algorithm Works and Availability:

I am an algorithm in development. My math is based on traditional indicators (up to fifty at any given time each weighted on individual merit) such as simple math calculations relating to price and volume, Fibonacci, simple pivots, moving averages, Gann, Schiff and other mathematical factors. I do not yet have AI or Geo integration – only math. I am not a high frequency or bot type algorithm – I am to be used (represented on a chart) as a probability indicator to give our trader’s an edge when triggering entries and exits on trades with instruments that rely on the price of the S&P500 (more specifically $SPY). In early 2017 I will also provide algo indicators and charting for $ES_F.

Below you will find my simplified view of levels that can be used on a traditional chart to advance a traders’ edge (both intra-day and as a swing trader). This work, and your subsequent trading, should be considered as one decision at a time, “if this happens then this or this are my targets”… price – trigger – trade and so on.

My algorithmic charting is going to developer coding phase early 2017 for our trader’s dashboard program. Please review my algorithm development process and a recent post by my developer that explains more about “Why Our Algorithms are Different than Most“.

I Am In Very Early Stage Development

My algorithm is the fifth in the line of six that my developers are working with – which means I am in the very early stages. So you will find my charting below to be very simple (relative to say the first algo they developed EPIC the Oil algo). So if you find that my initial charting does not assist you with an edge in your trading please let the office know by emal [email protected] within 30 days at most of signing on so they can refund you. If you do chose that option, you can always check back early 2017 when my algorithm processes / indicators for your trading edge will be very extensive (mid Jan).

$SPY Trading Observations:

At time of writing $SPY is trading at 227.76 (7:24 EST). Some thoughts that may help advance you trading edge;

Yesterday (Tuesday) mornining around 4:00 AM I alerted my subscribers to an algorithm cluster for resistance at 227.80 – 227.96. Price jumped up to this resistance in early egular market trading and then came off after 10:00 AM. By noon price action was testing this alerted resistance again. The price did shortly after pop up for a short time and then back under the resistance. Price then struggled with resistance for the remainder of the trading day Tuesday. In extended hours and overnight the trading is still challenged at this resistance. So the algorithmic call on that cluster is proving to be sound. At 7:24 AM Wednesday this the case also.

$SPY, Chart, Member, Alert

Geo Political Predictions:

My algorithm is not based on geo political events at all, however, my develpers will offer macro view comments as they see fit. You will recall that prior to the election we were sending a clear message that we expected the market to continue to run and our target short term (between Sept 1 2016 and Jan 1 2017) was in the area of 230.00 – 235.00.

Our new observations are that it seems our observations do have the potential to be not aggresive enough. In other words, it is probable that price will extend past our predictions but not absolute in our thinking. We will update you on the macro algorithm targets post Fed speak and as other milestones are crossed such as Christmas, Jan 1 and the inaugeration.

For now, the trading price is nearing our 230.00 – 235.00 call from September expiring at Christmas.

Divergence and Patterns

Yesterday, the $VIX was rising while $SPY was rallying intra-day. I have been alerting our members since last Friday that this would occur. You can also look to this possibility Wed morning and possibly (depending on the Fed speak) on the other side of the Fed.

It is difficult for me to calculate divergence indicators today because of the Fed speak, but I wll post Fed and provide you with clarity.

Fibonacci

Yesterday the resistance I alerted also corresponded with the Fibonacci extension (as predicted). This is still in play. The extension is in the chart from yesterday below.

S&P 500 $SPY, $ES_F, $SPXL, $SPXS

227.80 Fibonacci extension and cluster of algorithmic indicators. S & P 500 $SPY $ES_F ($SPXL, $SPXS)

Intra-Day Trading Ranges:

I cannot provide clarity until post Fed speak (it will take a day or two) because the geo political events do not allow me to accurately provide algo lines, targets, or intra-day traidng quadrants. The machines shut-off. After Fed speak I will run the algorithmic calculations as trade resumes with the machines and provide the update the moment the calculations are charted (it takes some time to take my calculations and represent them on a 2D chart for our traders)

Alpha Algo Trading Lines:

To be updated post Fed.

Alpha Algo Trading Targets:

To be updated post Fed.

Intra Day Algo Trading Quadrants:

To be updated post Fed.

Time / Price Cycle Change Forecast:

To be updated post Fed.


Good luck with your trades and look forward to seeing you in the room!

Freedom the $SPY Algo

Article Topics: Freedom $SPY Algo, Fibonacci, Stocks, Wallstreet, Trading, Chatroom, Algorithms, $SPY, $ES_F, $SPXL, $SPXS

1 7 8 9