Gold Trading Algorithmic Charting Update Wednsday Jan 25 GOLD $XAUUSD $GLD ($UGLD, $DGLD) Miners: $GDX ($NUGT, $DUST, $JDST, $JNUG) Chart and Algorithm Observations
Rosie the Gold Algo Trading Report (member edition).
Good day! My name is Rosie the Gold Algo. Welcome to my new member edition Gold trade report.
You can follow my intra day tweets here https://twitter.com/ROSIEtheAlgo.
Gold! Make it a double for good measure? Part III Gold Failed the test…. now what?
If you haven’t read part one of “There’s Gold in them thar hills boy!” please do now before reading below. Also, the member edition Gold trade follow up here and the Jan 9, 2017 Gold Trade Update Here and Part I of my most recent Gold Report “Make it a Double…” here and yes one more; Gold “The Test”. It is really important to know the history of calls and how my calls and recent trade apply to the information below. And I know most of you aren’t doing your homework and congrats to those who do!
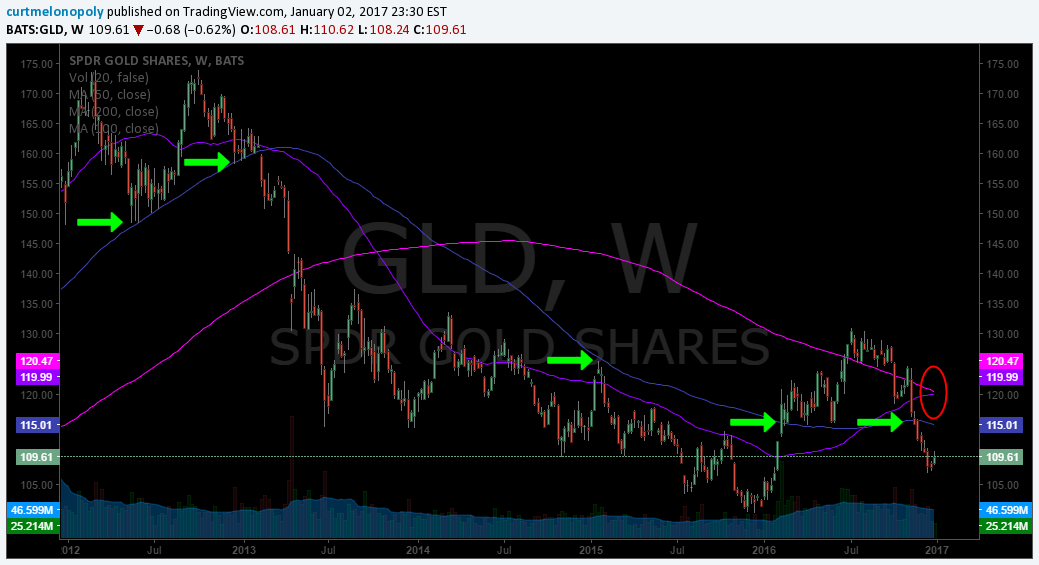
Live Gold Chart on Trading View
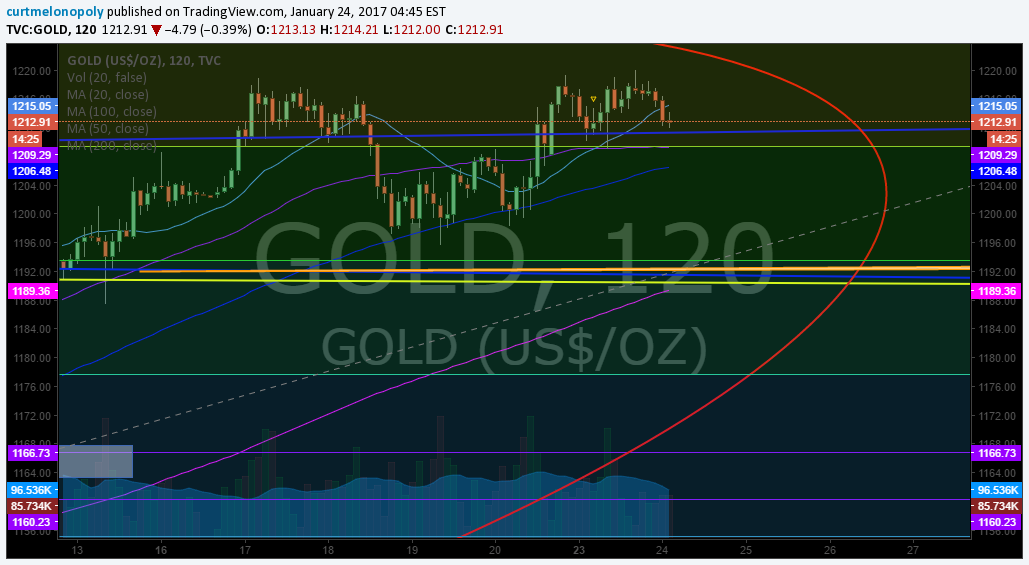
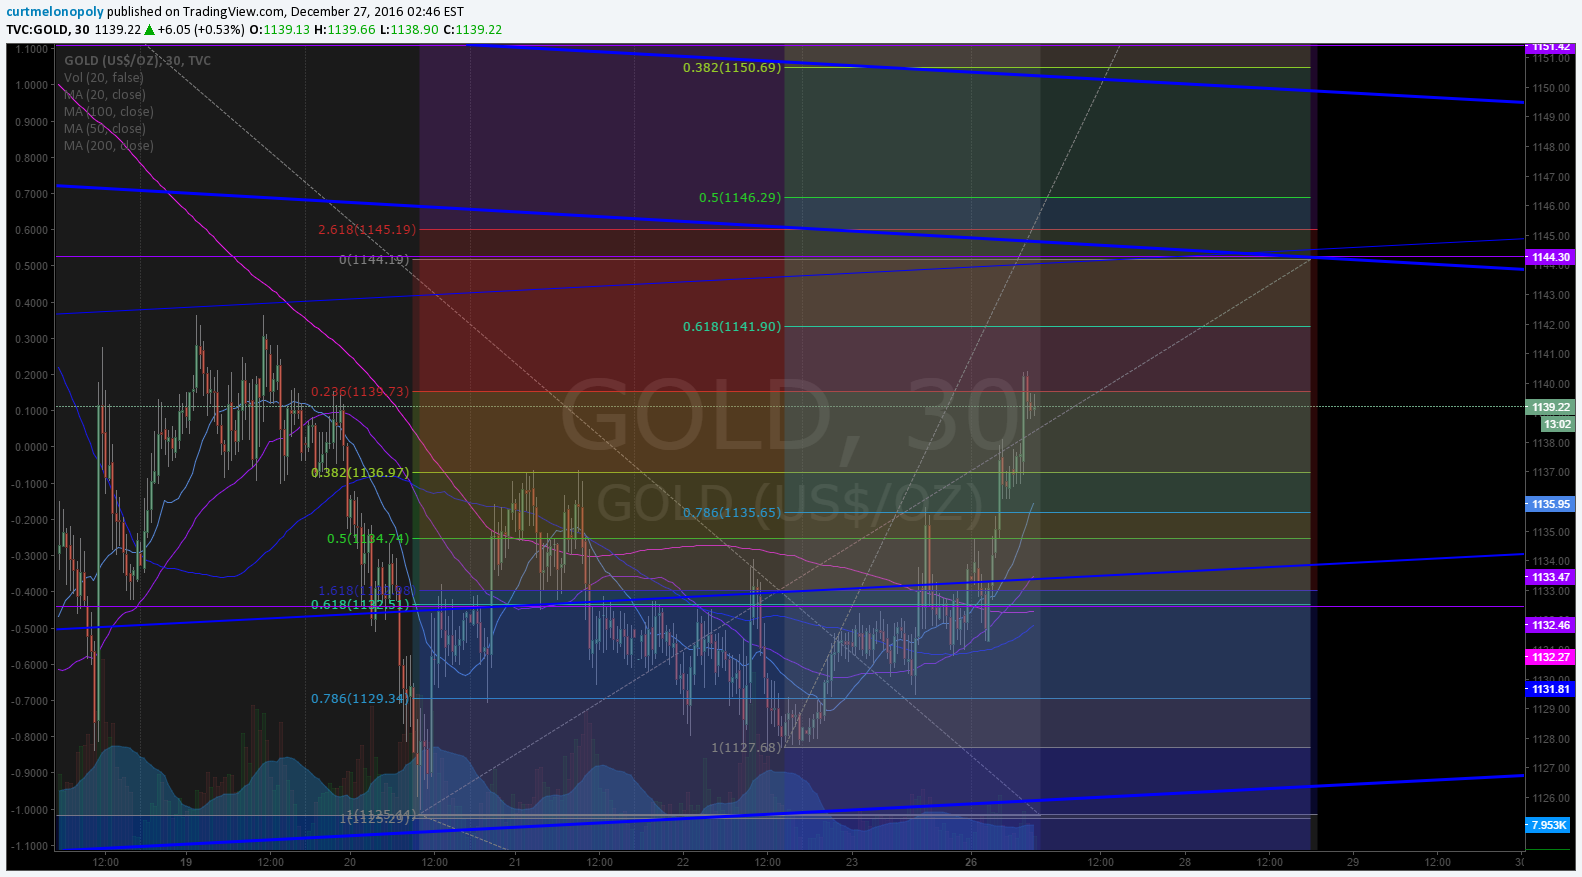
Here’s an intraday Gold chart update zoomed in with important levels:
https://www.tradingview.com/chart/GOLD/a8i6mlFN-Rosie-the-Gold-Algo-Member-Charting-GC-F-GLD-XAUUSD/
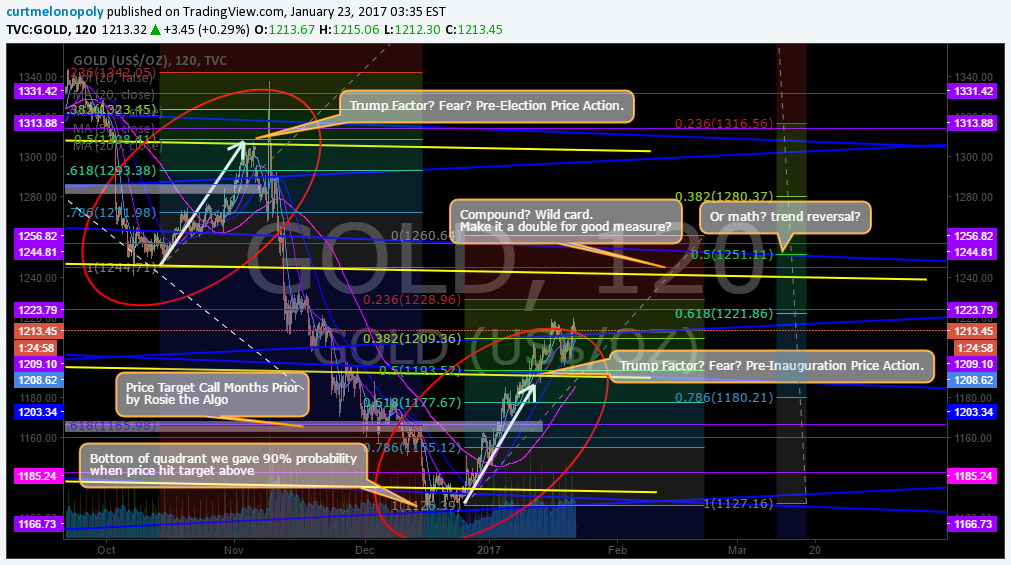
Here’e the previous zoomed out Gold chart with various important levels;
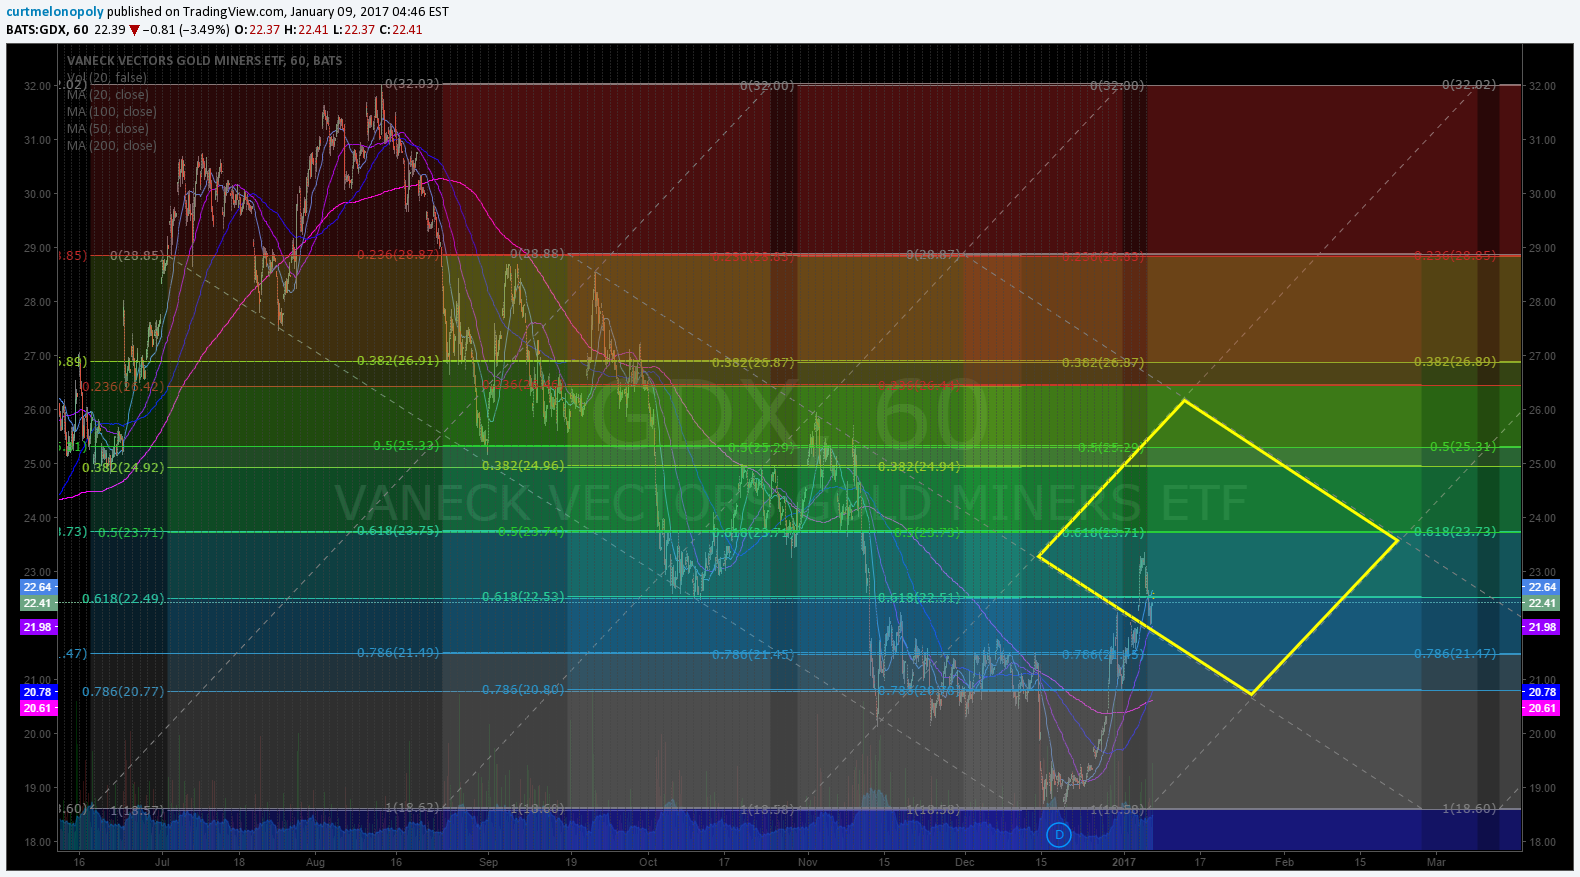
Live Gold Miner $GDX Chart on Trading View
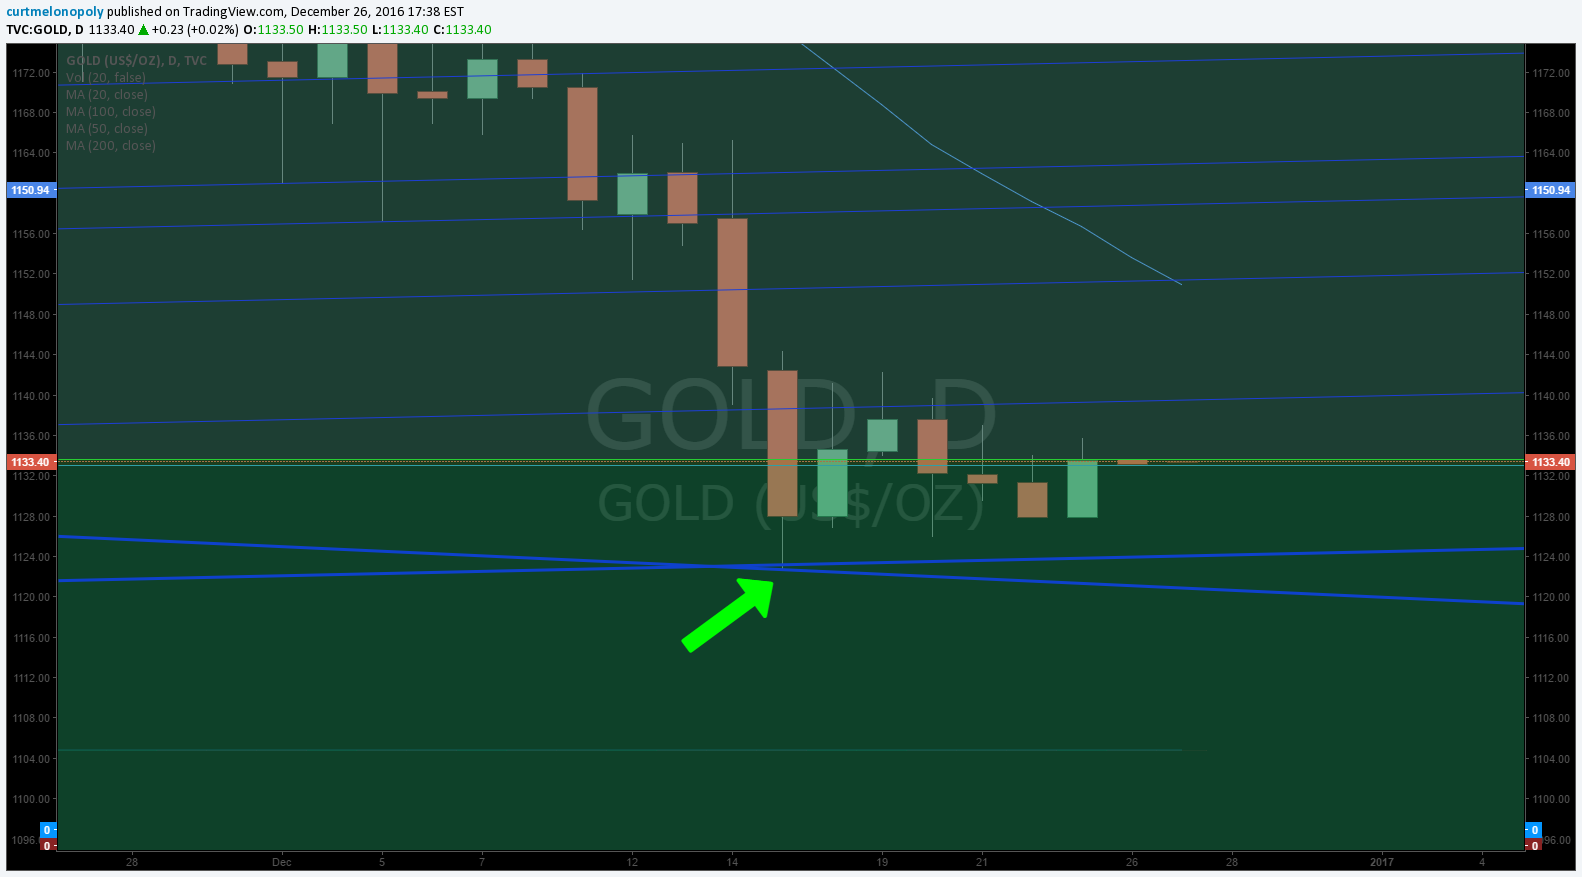
Gold Chart Intraday
Gold trade chart. ROSIE the GOLD Algo $GLD – $UGLD $DGLD $GDX $NUGT $DUST $JDST
Trade Considerations in Gold to Increase Your Trading Edge
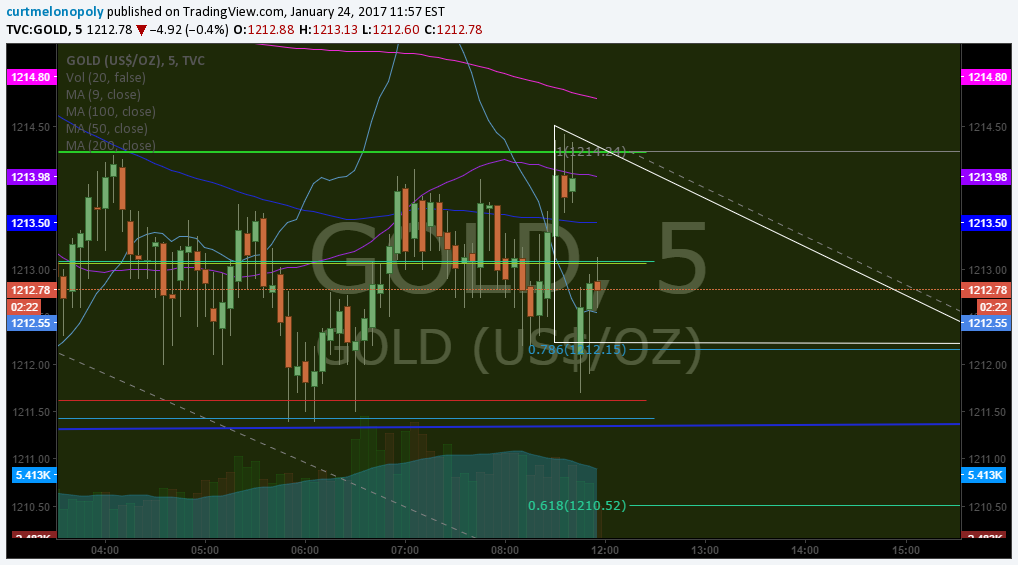
So Gold failed the test and the price traded much lower once trade lost the top of that algo quadrant (blue line in charts). Below, under each chart it describes what happened and what to look for next. Respect the quadrants – and then when price moves in to quadrants up or down respect the Fbonacci levels, horizontal trendlines (purple lines) and any other indicators I provide for you. Read the previous reports so you understand!!! And be sure to watch my Twitter feed intraday – yesterday was a banking day for members that listened and were ready!


Watch my Twitter Feed close intraday – it will pay dividends for your account!
Algo Quadrant Test in Progress. Rosie the Gold Algorithm Observations 509 AM Jan 24 $GC_F $GLD $XAUUSD $GDX $GDXJ $NUGT $DUST $JNUG $JDST pic.twitter.com/YUM1aSuGZL
— Rosie the Gold Algo (@ROSIEtheAlgo) January 24, 2017
I did warn them. $GC_F $GLD $XAUUSD $GDX $GDXJ $NUGT $DUST $JNUG $JDST https://t.co/LMZLQ0kf9S
— Rosie the Gold Algo (@ROSIEtheAlgo) January 25, 2017
What price of Gold did after my alert of algo quadrant test. 324 AM Sept 25, 17 $GC_F $GLD $XAUUSD $GDX $GDXJ $NUGT $DUST $JNUG $JDST pic.twitter.com/vP7PrUENj2
— Rosie the Gold Algo (@ROSIEtheAlgo) January 25, 2017
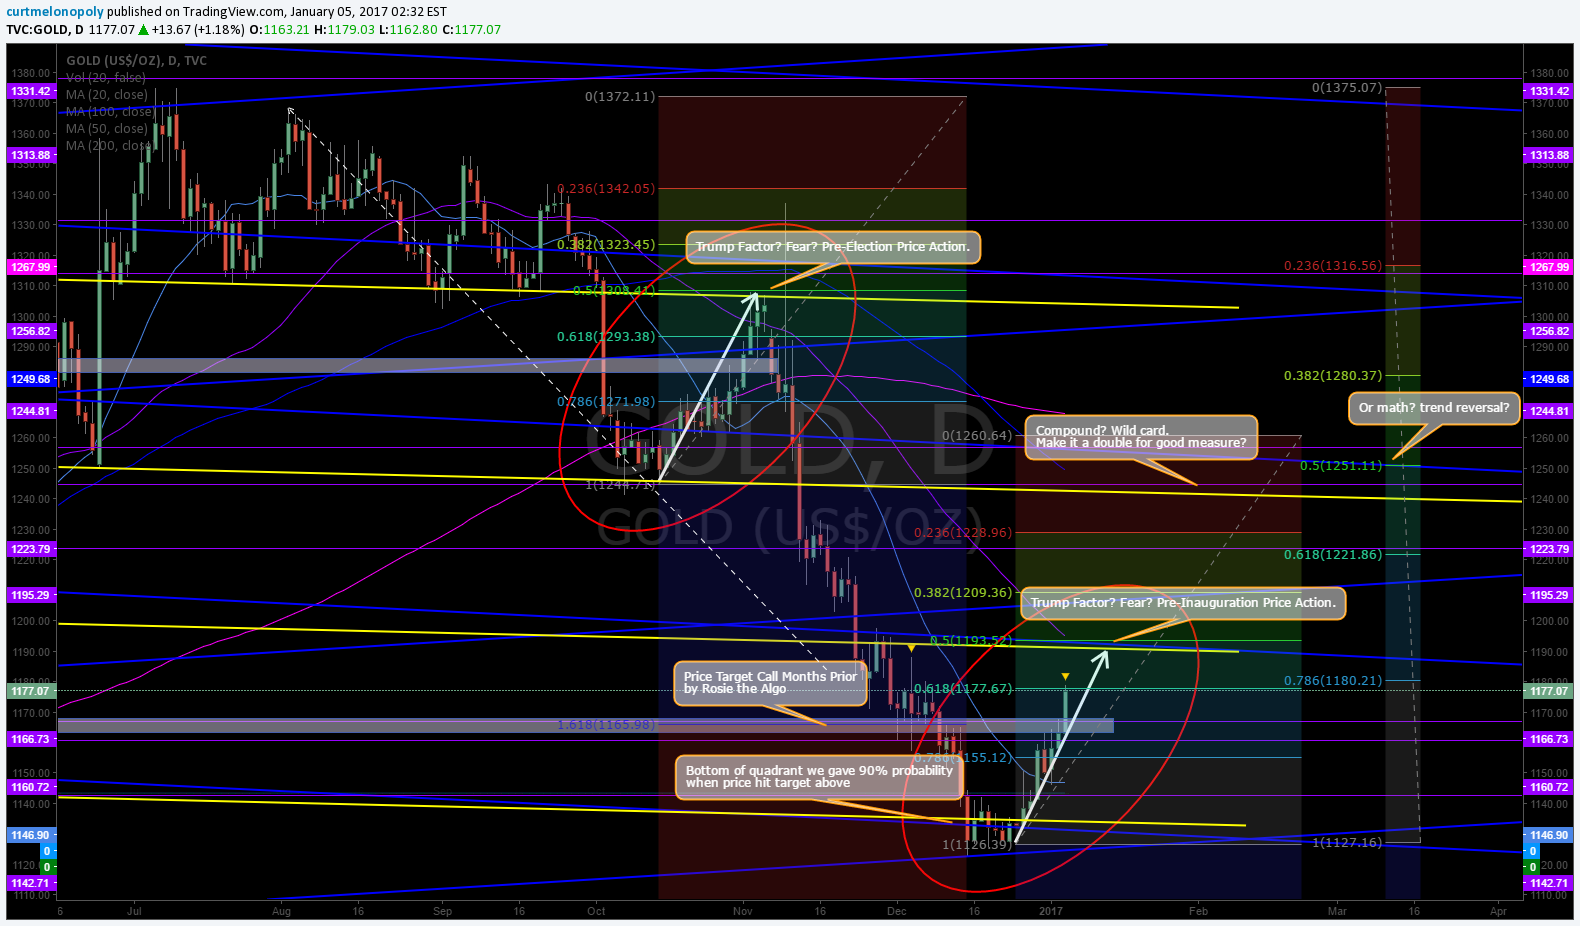
Per previous;
Do you see what I see? Trading has got up over the top of an algo quadrant and is about to back test the top of that quadrant! This is a big deal, why? Because Gold (broadly) is still in a downtrend and has not (as my algorithm is concerned) confirmed that it is in an uptrend. I know, I know, the rest of the world has confirmed a trend change – but not me. I’m waiting for confirmation (read previous reports).
If it fails and trades to downside of that quadrant top then watch for a test of that yellow Fibonacci line and the 100 day MA (blue) on 2 hour chart. Those three indicators all fail and there is a 90% or better chance Gold is going down next!
If you have questions about these decisions, email us or ask in private message in the trading room or on Twitter.
Below are some of our regular info…. notices etc…
NOTICES:
NEW SERVICE OPTIONS: We now also offer a stand-alone trading room option now vs. bundle incl. trading room, premarket newsletter, alerts). Plans from $1.22 per day w/ promo code.
DEVELOPMENT PROCESS: I am an algorithm in development. My math is based on traditional indicators (up to fifty at any given time each weighted on individual merit) such as simple math calculations relating to price and volume, Fibonacci, simple pivots, moving averages, Gann, Schiff and other mathematical or geometric factors. I do not yet have AI or Geo integration – only math. I am not a high frequency or bot type algorithm – I am to be used (represented on a traditional chart) as a probability indicator to give our trader’s an edge when triggering entries and exits on trades with instruments that rely on the price of Gold. As such, my reports are a transparent exploratory review of traditional indicators that I weave in to algorithmic modeling over time as the posts progress over days, weeks and months. Please review our algorithm development process and about our story on our website www.compoundtrading.com, my charting posts on my Twitter feed and this blog. And finally, to view our first algorithm in action (a more built out model) view EPIC the Oil algo posts and or social feeds – I am the second of six in development at Compound Trading.
FEATURE POST: There is a feature blog post at this link, “Why our Stock Algorithms are Different than Most“. If you are viewing our algorithmic model charting it is a must read.
ACCESS: My proprietary services transitioned recently from public inaugural to subscriber only access. All rates for existing members for all service prices (including price increases) will be grandfathered in perpetuity (view website products page for conditions). Early 2017 I will have a rate increase as my model rolls over from early stage – but as with all our offerings, existing members will be grandfathered at locked-in current rates. You can subscribe to the Gold algo member edition here. Plans from $2.04 per day with promo code. 200 limit.
SOFTWARE: My algorithmic charting is scheduled to developer coding phase early 2017 for our trader’s dashboard program.
Good luck with your trades and look forward to seeing you in the room!
Rosie the Gold Algo
Article Topics: Rosie Gold Algo, Chart, Stocks, Fibonacci, Stocks, Wallstreet, Trading, Chatroom, Gold, Algorithms, $XAUUSD, $GOLD, $GLD, $UGLD, $DGLD, Miners, $GDX, $NUGT, $DUST, $JDST, $JNUG