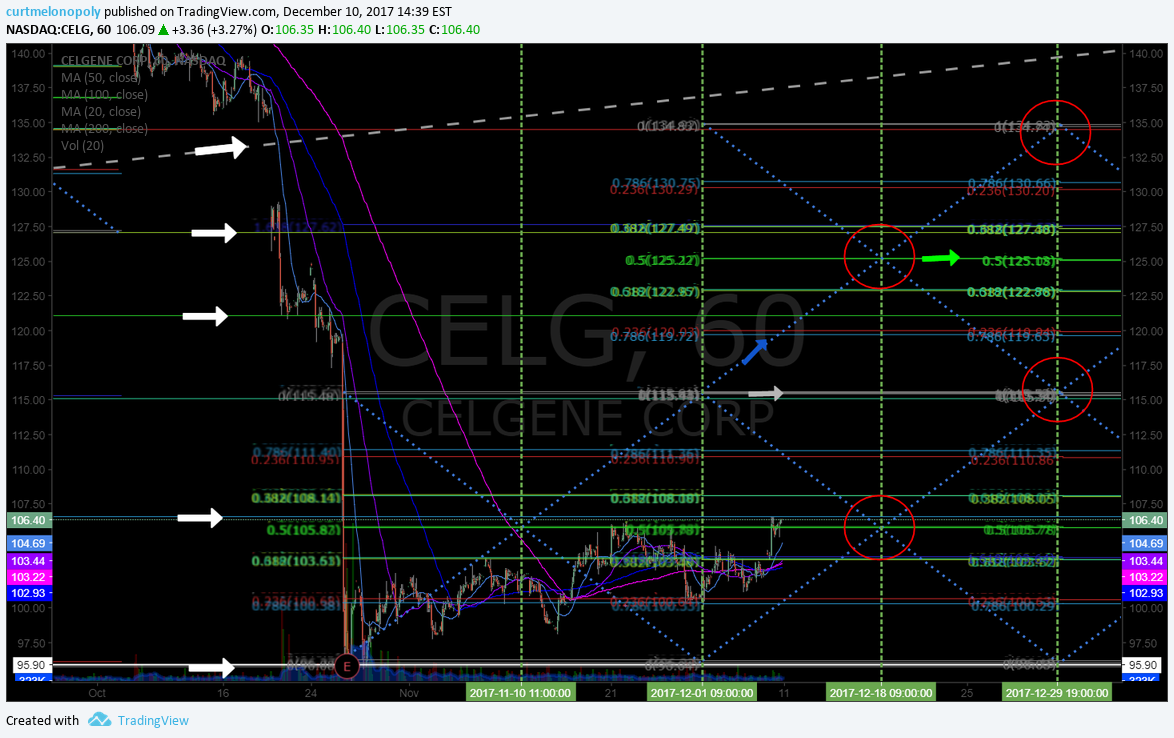
$CELG simple level Fib diagonal trendline quad algorithmic model for trading levels to use for buy / sell triggers. #swingtrading #daytrading
Good day traders!
Below is a simple model from the $CELG chart in preparation for premarket tomorrow morning.
Here is the most recent news on $CELG / $BIRD:
Celgene Corporation and bluebird bio Announce Updated Results from Ongoing Multicenter Phase 1 Study of bb2121 Anti-BCMA CAR T Cell Therapy in Patients with Late Stage Relapsed/Refractory Multiple Myeloma at ASH Annual Meeting
https://finance.yahoo.com/news/celgene-corporation-bluebird-bio-announce-153000418.html?.tsrc=rss
The gap fill on $CELG is a very real possibility so this chart not only gives you Swing Trading Buy Sell triggers but also helps time entries and exits on tighter time-frames and really helps when daytrading.
The level one algorithmic chart model that is based on Fibonacci retracement trendlines (that the market uses) has important points of reference:
$CELG Swing Trading buy / sell triggers are as follows:
106.60
115.12
121.10
127.08
and so on…
The quad walls (or Fib trend lines) are also important support and resistance (blue).
There is one main diagonal Fib trendline up top on chart (it’s the thicker diagonal trendline near top of chart)
The mid quads (either gray or green) are intra-day important buy sell triggers.
The red circles identify some of the intra-day quad apex and inverse apex areas that trade will often end in for that time cycle (I calling it trade chasing the apex for simplicity)
For intra-day tighter trading and for important areas for entry and exits even for swingtrading – $CELG simple level Fib diagonal trendline quad algorithmic model for trading levels to use. #swingtrading #daytrading
To remove indicators (MACD, Stoch RSI, SQZMOM) at bottom of chart, simply double click on chart main body. To use and edit the chart click on share button near bottom right of viewer page and then click make it mine.

For swing trading – Your main buy sell triggers as above. $CELG Gap Fill Swingtrading Set-Up Chart Notes on News and Chart Set-Up

The charts above (although an “on the fly” simple example) give you an idea of where our swing trading platform service is headed in 2018.
If you have any questions email me or DM me on Twitter anytime.
Good luck out there!
Curtis
