Good times, things are setting up exactly as we thought for the time cycles in to 2025. This time cycle in to end of August 2020 be safe at inflections, working on a time cycle within time cycle model for you now.
If you missed the beach side video last night I discussed the US Dollar / CAD and this morning on Swing Trade alert feed I sent out some thoughts on Gold trade.
— Curtis Melonopoly (@curtmelonopoly) May 13, 2020
Day trades are setting up here, I may start a few today (I will alert to day trade alerts feed) and possibly transition them to the Swing Trading Alert platform if I can get on the right side.
A few day trades on watch: $APDN $BPMX $AIM $NVUS $IMUX $ALLO $TLSA $NBY $RIOT $CODX $WISA $ALT
— Day Trading Alerts (@DayTrade_Alert) May 14, 2020
The intense oil daytrading yesterday that continued in to the night and premarket today ended up on our side – a really nice trade for our oil trade alerts feed.
Since the black swan updates I don’t think EPIC has lost a trade, very little if any.
EPIC V3.1.1 was in deep at support at 24/30 size, that is deep for the software, anyway it worked out well for the oil trade alerts members (I got a number of Whatsapp messages and we were intensely working through member trades live on Whatsapp messaging).
I also got a nice win there too so that helped. If you’re a member and not connected to me on Whatsapp do so by emailing cmpoundtradingofficial.com so we can connect.
Power of trend line price breakouts from a trading structure support, crude oil intraday near 200 points from oil trade alert buys earlier #OOTT $CL_F $USO #oiltradealerts EPIC V3.1.1 software was in deep at 24/30 size in position trading, very large size. Lead trader was also.
The swing trade service got a big win this morning in $APDN on the news, really nice trade from lows, another multi bagger. I may do some daytrading in $APDN yet today also.
Another beauty of a trade on our swing trading alert platform $APDN #swingtradealerts
Applied DNA Receives FDA Emergency Use Authorization for COVID-19 Diagnostic Assay Kit
Trump train trading will be awesome here forward, what an opportunity!
This is a strong signal imo. Inflection time. Looks like a man preoccupied with off-screen furback rats scurrying… no point for this public education – they've hit max opportunity of those that will get it, have it now and those that don't, oh well. Fireworks here fwd likely. https://t.co/490KOejSS5
— Curtis Melonopoly (@curtmelonopoly) May 11, 2020
I did say something about the tone represented the other day at the WH briefing – that I wouldn't want to be on the opposing team considering, here we go kids🪓⛓️🪝 https://t.co/YeVboLTSnj
— Curtis Melonopoly (@curtmelonopoly) May 14, 2020
While CNBC has been flashing
"MARKETS IN TURMOIL"
We been raising the dead and banking the living.
Couldn't have been a better time cycle and the next will be better than the last and the next and the next. Historic opportunity for traders.#premarketpic.twitter.com/QYgi57w5VX
— Curtis Melonopoly (@curtmelonopoly) May 14, 2020
Have patience with me on a few things early week here:)
The oil swing reports will be out sometime today (before tomorrow premarket) – there are A LOT of moving parts right now, we’re struggling a bit here to keep pace with admin work flow but for the most part we’re winning in trading (oil swing the most obvious exception)
The trading room is open this morning, however, the new internet line will be going so it will cause downtime during switch over, and I can’t tell you exactly what time that will occur.
And yes we are likely to experience server issues at Click Meeting however we expect that to subside as the week progresses.
The recent memorandums listed below reference our trading team work in progress.
Anything you need let me know.
Curt
Recent Memorandums RE: Trading Team Work in Progress
Swing Trading Study Guide Newsletters (After Trade In-Depth Reviews Including Set-Up Identification, Trading Plan, Sizing, Risk Management, ROI and more).
Crude Oil Sell-Off Continues – Here’s How We’re Trading It. Strategies for Day Trading and Swing Trading The Move.
The current oil sell-off may last some time. The US – China trade war may continue for months or more putting pressure on the price of oil due to global slowdown demand perceptions.
The objective of this report is to identify the areas of support on the oil charting so that our traders / clients can execute trades for possible areas for a bounce.
This will also serve as important areas of support that short selling crude oil traders will want to consider for covering all or some of their positions.
The technical indicators below (charting and time cycles) will provide signals for day trade and swing trade oil traders.
As of last Thursday, after the Fed decision to lower rates a quarter point and after Trumps tweet about China the order flow has been considerably negative and the price of oil reflects this.
However, there are near term support areas in the charting coming soon so these areas may provide some relief bounces in price. Below we look at the crude oil charting on different time frames.
Both conventional and algorithmic chart models are provided below.
The focus in this report is toward “Keep it Simple Charting (KISS)” to visualize the range of trade which can make it easier to focus on general areas of support and resistance to watch.
For more detailed charting refer to recent premium member reporting and / or charting sent directly to our members via email and / posted in Discord or in oil trading room.
To simplify your trading take your trade positions only at key support or resistance decision areas on whichever time-frame is most appropriate to your requirements. When a trader is struggling, this is one method to correct course and get trading green again. This is also a great method of getting correct positioning / bias in significant sell-offs and bull runs.
Focus on the simple trading ranges first – the channels, the trend lines etc on various time frames on the simplified charts, then move to the algorithmic models to refine trade entries. Then consider time cycles, time of day, volume, recent trade action, technical indicators such as MACD and moving averages, fundamentals, news flow and more.
When you have the macro view in place, the technical algorithmic view then you can use your trading process for your entries. A refined trading process (an edge) is critical.
Keep it Simple (KISS) monthly oil chart says range 47 – 70 with 58 area pivot, 57.76 near resistance and 51.83 near support to watch. Trading 53.65 intra-day.
Also of note on the monthly time-frame is that the MACD is pinching / turning down and the squeeze momentum indicator is trending red.
KISS monthly oil chart says range 47 – 70 with 58 area pivot, 57.76 near resistance and 51.83 near support to watch. Trading 53.65 intra-day.
The Keep it Simple Weekly Crude Oil Chart – Price at 200 MA, MACD turned down, trend lines to watch.
While I am compiling this report price is testing the 200 MA support on the weekly crude oil chart, you can consider this area a prime consideration for a bounce near term. Moving averages are not precise indicators for support and resistance but do provide for near term trade bias. The MACD is turned down on the weekly which favors the bears considerably on this time-frame.
The Keep it Simple Weekly Crude Oil Chart – Price at 200 MA, MACD turned down, trend lines to watch.
On the simple Daily crude oil chart price is testing key trend line support areas intra day. Watch close here for a bounce.
The MACD is also turned down on the daily time-frame, and I wouldn’t expect an extended rally in crude oil due to the trade war, but a considerable bounce could happen here.
On the simple Daily crude oil chart price is testing key trend line support areas intra day. Watch close here for a bounce.
Oil did sell off in to the lower part of the 60 minute chart quad (time cycle) and should bounce to 55.00 area at minimum.
We were talking about this scenario possibly playing out in the oil trading room, and sure enough price sold off right in to that time cycle peak on the 60 minute chart model and is now bouncing on the other side of the time cycle.
Oil did sell off in to the lower part of the 60 minute chart quad (time cycle) and should bounce to 55.00 area at minimum.
Algorithmic Charting
The next time cycle low possible in VIX (see VIX report) is in to September 9 – 16 with a recent peak being August 5 (a week prior and after allowed for large time cycle). This implies that oil may bounce in to this time-frame and then begin its next leg down thereafter and in to the Oct 21, 2019 VIX time cycle peak. It is important however to keep top of mind that time cycles can work totally the opposite. The implied peak could be the bottom and the opposite is true, so be cautious with trajectory of trade to determine bias. https://www.tradingview.com/chart/VIX/6pKtcjcR-Volatility-VIX-swing-trade-strategy-is-to-wait-until-between-S/
Learning to Trade Crude Oil is Like No Other. At this link you will find select articles from our oil traders real life day-to-day experience in our oil trading room. Crude Oil Trading Academy : Learn to Trade Oil
Daily Profit and Loss Summary for Personal Day and Swing Trades, Oil and Bitcoin Trades, Machine Trades and Alerts. Includes Live Trading Room Video and Alert Feed Screen Shots.
I recently posted to my Twitter feed that I would start providing daily trade profit and loss summaries and also posted some info on our goals for our machine trading / alert compound gains. Thread is below.
This is the first profit and loss post, this will for now be basic and over time we’ll get more info and more formal (with proper P&L spreadsheets). Below is what time allows for today.
Oil Machine Trades / Alerts
There were four oil trades, all winners, the target (goal) for the day was exceeded by the machine trade.
3 of 4 of the trades were alerted. Alerts went to private Discord server, private member oil alert feed, were broadcast (my voice with charting) in the live trading room. 1 of 4 was only alerted live in trading room.
Personal Oil Trades.
None, however, I will be trading along side the machine trade alerts going forward now that our coding is mostly complete for oil.
Machine Bitcoin Trades.
N/A in development.
Personal Bitcoin Trades.
I shorted Bitcoin at 1/10 size, it went well and I covered 50% of the trade holding half at this point. Looking for a bounce to add to the short or if price gets to the price target I will close the short and re short after a bounce. Members can refer to the alert feed and / email sent out explaining the charting and trading plan for this short.
Personal Swing Trades.
The one swing trade was long AMD, which was a 2/10 size intended as an add to the current swing position (initial position at channel) and the other portion of the 2/10 size was to be a day trade, however, the day trade didn’t work so I am 3/10 long AMD.
Members can check to the private member swing trade alert feed on Twitter and recent reports for all current swing trades (there’s a new consolidation report on deck coming also).
Personal Day Trades.
As above the AMD day trade, it went against me and the only reason I held it is because I’m in an AMD swing trade and because my sizing is correct. When you have a swing trading plan and you’re also day trading a stock then this becomes an option for a trader. This is why we first start with the larger structure of the financial instrument and put together a trading plan for the swing trade and then perhaps also day trade the stock. You can take any of the swing trade charting in the reports and bring it down to a day trading time frame. If I day trade a stock that we do not have models for I would never hold the trade whether it goes well or not.
Historical Profit and Loss Trading Statements.
Jen is currently reconciling all the trading profit and loss statements for the purpose of review and study. The most recent working document update is available here:
The video below is raw feed only, to find live trading and trade alerts voice broadcast when lead trader is trading in the room reference the time of day on the alerts.
Live Trading Room Raw Feed $AMD $USOIL $WTI $CL_F $BTC $XBT_F
Supporting Trade Alerts and Charting on Day:
If you cannot see a chart below, a link is not available or not showing to the alert and/or chart or parts of the data is blocked with ******, this is because it is a premium member chart or alert.
Crude Oil Trade Alerts.
3 for 3 for machine trade alerts today. Exceeding .6% daily 151% per annum goal. #OOTT FX $USOIL $WTI $CL_F $UWT $DWT #OilTradeAlerts #machinetrading https://twitter.com/curtmelonopoly/status/1145164315726684161 …
BITCOIN (BTC) Short term trading plan, short or long at each arrow, timing on lower time frames $BTC #tradingplan
BITCOIN (BTC) We have met all targets now since buy alert (green arrow), trajectory early, what’s next on deck in new charting and report due later today. $BTC #Bitcoin
Long $AMD 31.89 (already in swing, so partial is swing add and partial day trade), day trade partial. Resistance / price targets 32.58 trading box, 32.89 trendline diagonal, 33.64 mid quad, 34.29 trend line diagonal, 34.65 trading box final target. #daytrade #swingtrade #alerts
Trade Alerts. Trade Set-ups Report and Video from Live Day Trading Room September 20: $NBEV, $CRON, Oil, $AAPL, $NFLX, $FB, $AMD, $BABA, $CARA, $BLDP, $EDIT, $BZUN and more. #daytrading #swingtrading
#TradeAlerts
Trading alerts and Swing Trading and Day Trading set-ups raw video from Live Trading Room mid-day review Sept 20, 2018. Some of the trade set-ups in this video are from the Trading Boot-Camp.
It has been excellent this week! I had reported last week that I seen an inflection coming early this week and we nailed it! Continued market momentum if very possible in to next week. Many of the set-ups I have been posting the last week are firing trade signals consistently.
ITS SEEMS WE HAVE SOLVED THE BROADCASTING ISSUES WITH HARD WIRED FIBER INTERNET.
BE SURE TO LOOK AT THE CHART DATE AND TIME IN TOP LEFT HAND CORNER OF EACH CHART.
September 20, 2018
Crude Oil Trading Update ($USOIL, $WTI, $CL_F, $USO) – I review the crude oil algorithm on the video. Twice this week I took trades that I closed only to have them run after closing (I was away from monitors at each time). Execution of trades at the support and resistance of the crude oil trading algorithm (EPIC) has been excellent.
The weekly oil price targets from the weekly crude oil trading report and the charting provided in the reports have been really predictable lately also.
The crude oil trading alerts feed has been quieter this week because the trading plan in oil was to take the trades at the wider ranges to leg in to the trades, I did however alert the channel support and channel resistance and following through those trades would have been very profitable for oil trading members.
SP500 $SPY $SPXL $SPXS – On the SPY algorithm charting for 60 minute time-frame I have been watching for a break over the test area resistance 291.60 (trade alert on SPY went to swing trading alerts feed). Sept 24 time cycle 288.88 283.77 and uptrend 299.50 would be most bullish scenario. 294.33 resistance intra and main support on SPY intra-day 293.00.
SP500 (SPY) premarket bullish with 294.31 key resistance and one smaller one in between $SPY $ES_F $SPXL $SPXS #SPY #SwingTrade #Daytrade
APPLE $APPL – Apple’s stock is over 50 ma on 240 minute chart, trade alert went out on swing trading alert feed for Apple today. Testing the 20 MA, 224.70 resistance, 229.70 resistance, 236.75 is heavy resistance. Support 215.60 area intra-day and 219.02.
APPLE (AAPL) premarket bullish momentum with 20 MA test and 224.60 range buy sell trigger above $AAPL #swingtrading #tradealerts
NETFLIX $NFLX – The long side trade that alerted that some members took has been very good at main support on the Apple chart. The trading support and resistance areas are discussed on video. Review of the chart model and video are important to understand the trading signals for Apple. 364.00 362.14 support areas, 395.59 397.90 are resistance areas. Really important to look at the chart and video explanation however.
NETFLIX (NFLX) perfect turn at previous alerted trendline support 309.54, cleared 313.52 res (red blue) 338.66 mid quad bounce $NFLX #swingtrading #tradealerts
NETFLIX (NFLX) Part 2 – past 361.91 key resistance, over 200 MA 380 mid quad resistance on deck trading 372.11 $NFLX #swingtrading #tradealerts
NETFLIX (NFLX) PT 3 over 380 mid quad resistance, targets 395.57 trendline (gray dotted) 398.20 red blue key resistance $NFLX #swingtrading #tradealert
FACEBOOK $FB – One of my favorite trade set-ups, especially for wash-out snap back trades. Facebook is currently under significant government pressure now so I am not expecting the same as previous. The horizontal red and blue support and resistance areas (forming the test area box on the charts) is reviewed and the diagonal Fibonacci trend lines. Here again review of the video and chart is really important. 167.51 mid quad resistance caution here, 100 MA resistance 169.40, diagonal Fib resistance, 173.51 is upside possible, 169.03 downside possible. The trading box is reviewed on the model. Buy sell triggers for trading signals on Facebook are also reviewed.
There is a previous special report on how to trade Facebook on our website.
FACEBOOK (FB) bounce off quad wall in to key resistance (red blue) upside test 20MA 50 MA – key test area $FB #swingtrading #tradealerts
EDITAS $EDIT – The value of structured set-ups with symmetry in the algorithmic stock chart models is discussed here. Examples are $GDX, $BLDP, $NBEV, $AGN, $EDIT and many more. The symmetry on EDIT chart has hit five times and typically you will see it stretched at that point. A trade alert went out today on $EDIT to watch closely going in to this time cycle. The video explains the details.
EDITAS MEDICINE (EDIT) at 200 MA resistance test with peak time cycle Sept 24, careful on other side of cycle $EDIT #swingtrade #tradealert
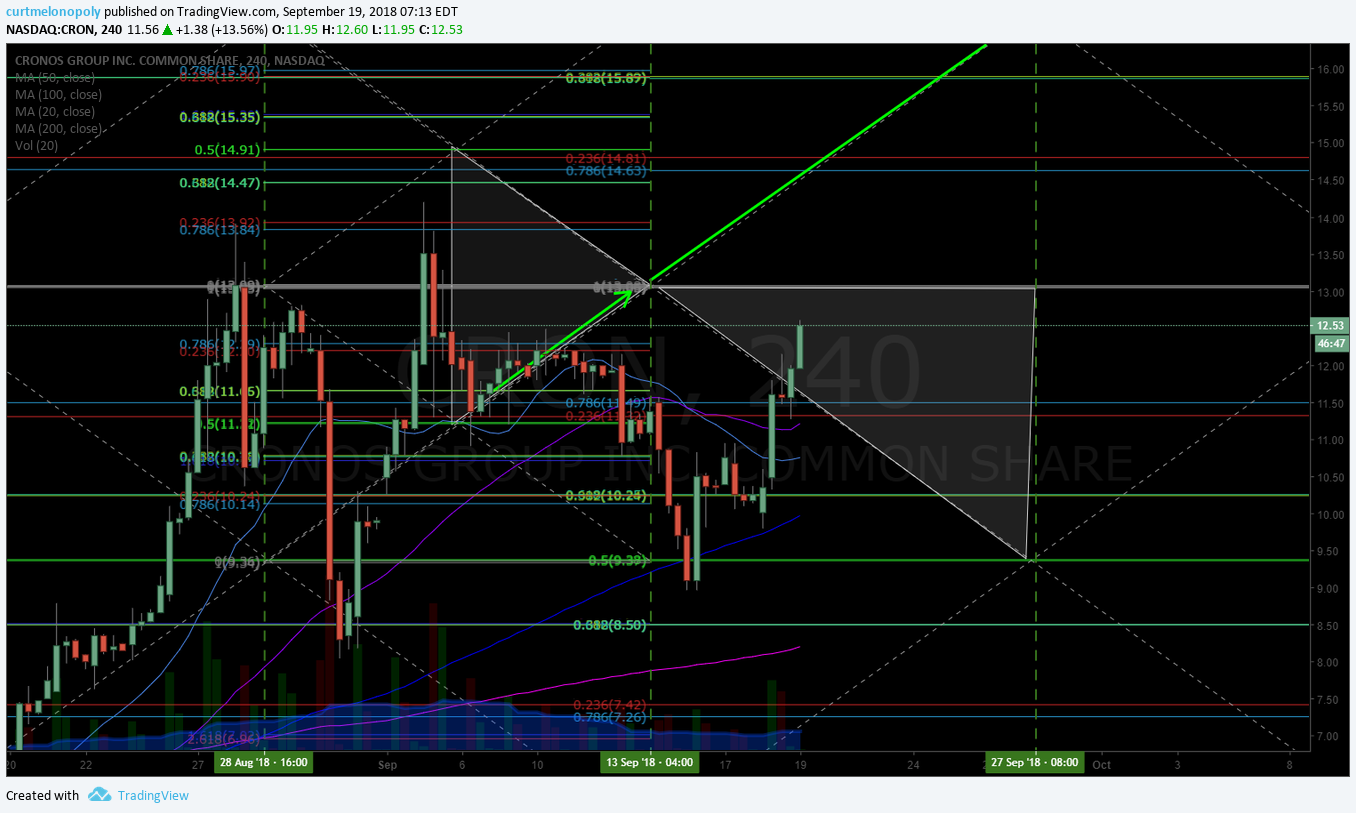
CRONOS $CRON – I have reviewed CRON chart set-ups many times this week. There is a light sidewinder trade set-up with the 50 MA and 20 MA on the CRON charting. You can expect a fairly decent move when the 20 MA breaches the 50 MA upside. It’s a lower time-frame being on a 240 minute chart, but it still may be enough to get price over that key resistance area reviewed on the chart and video. Pivots support and resistance areas also reviewed on video.
CRONOS – per yesterday’s trade alert and review video over trendline on way to resistance test in premarket $CRONO #tradealert #premarket
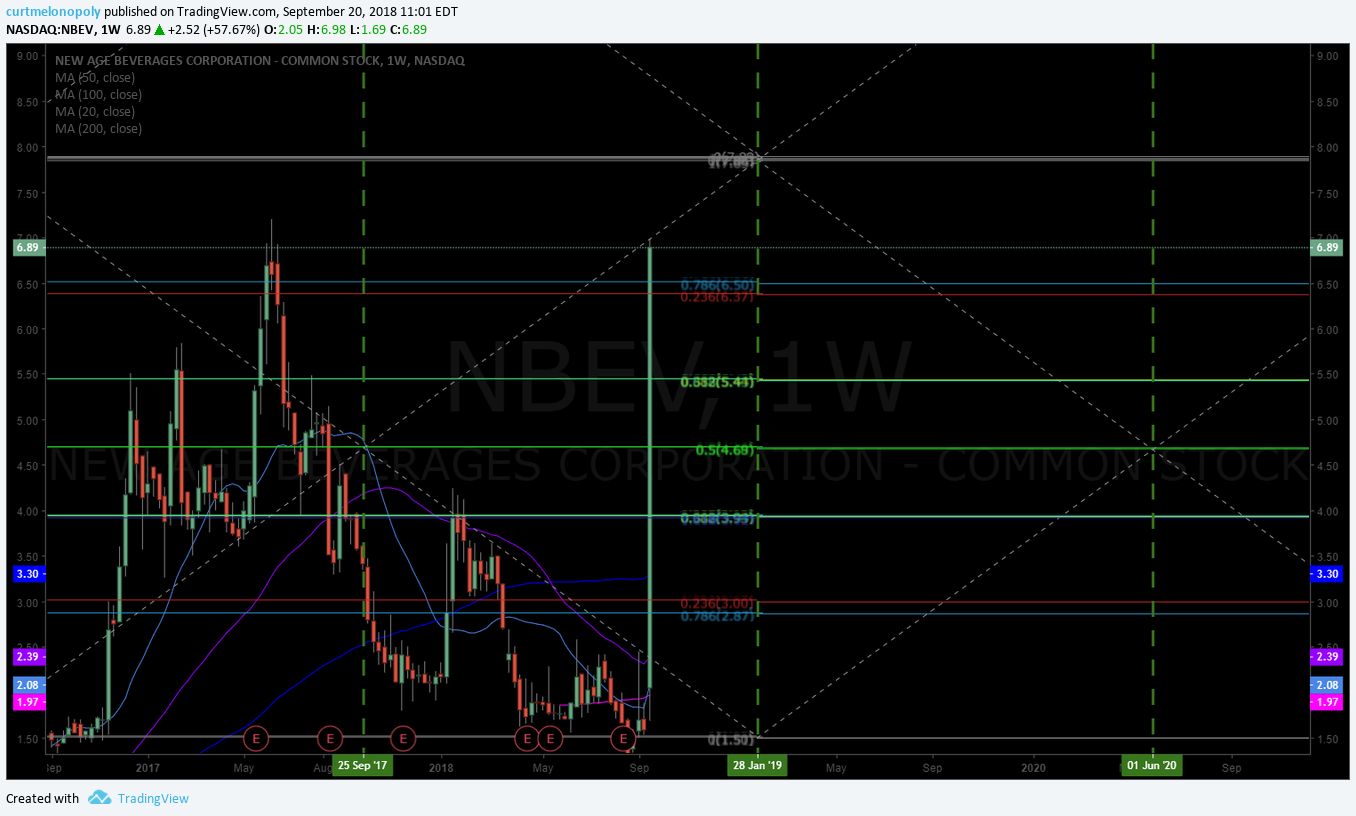
NEW AGE BEVERAGES $NBEV – I put out a special report to members today on NBEV and the trade has been fantastic since. The resistance areas and time cycles are reviewed on the video. The testing area (trading box) are reviewed. Also the price extensions (price targets) are reviewed. If price holds and price moves bullish in to time-cycle discussed on video the upside price targets for NBEV are extremely positive and reviewed on video. 9.38 is a very critical resistance and support area in to the key time cycle peak on the NBEV chart.
NEW AGE BEVERAGES (NBEV) testing previous highs, technical set-up here forward for chart structure $NBEV #tradealerts #swingtrading #daytrade
NEW AGE BEVERAGES premarket bullish with trade alert price targets hitting, trim in to each add above. $NBEV #tradealerts #swingtrading #daytrade
BALLARD POWER $BLDP – On the swing trading alert feed today a special alert went out on the fact that the last five time cycle completions in Ballard Power stock charting the price reversed in trade of Ballard. This is a symmetrical stock trade set-up that traders should not ignore. BLDP trading 4.50 up 7.42% intra-day spiking in to time cycle completion Oct 10, resistance 4.50 and the test range on the chart is reviewed.
BALLARD POWER (BLDP) Five out of five of the last major time cycles price reversed, Oct 10 is next time cycle peak. $BLDP #swingtrading #tradealerts
BOAZUN $BZUN – Holding key support intra-day, if it holds a run up in price is possible. Termination of time cycle on 4 hour chart is near so get ready soon. High probability set-up. Details of trade set-up for BZUN reviewed in video. My bias is that this runs up.
ADVANCED MICRO $AMD – key support hit on chart and bounced, Oct 2 price target in bullish scenario is 33.62 and bearish scenario 22.87 in sell-off, mid quad on chart is discussed on video with various price target scenarios like 31.40 range being indecisive price target on Oct 2.
ADVANCED MICRO (AMD) hit key support and bounced, targets 33.62 Oct 2 or sell off 28.87, watch structure uoutlined on chart #swingtrading #tradealerts
OSI SYSTEMS $OSIS – trading 77.55 testing 50 MA and key Fibonacci resistance on diagonal Fibonacci trend line, price target 84.21 Dec 28 is possible in uptrend trading. Resistance and support lines and how to trade the chart is reviewed on the model in video.
OSI SYSTEMS (OSIS) Trading 77.55 testing 50 MA and key Fib resistance, over targets 84.21 Dec 28, 18 $OSIS #tradealerts #swingtrading
CARA THERAPEUTICS $CARA – I knew this one was going to get going, you don’t get many trade set-ups this strong.
There is a trade coaching bit of advice at this point on the video with reference to trading structured charting and its benefits to traders. Also market inflections and how to trade for your profit and loss and associated sizing in market inflections is also reviewed.
CARA is a great case study, going back to NBEV chart is reviewed on video – how price was getting bullish in to time cycle and how that relates to symmetry and price targets that can be traded.
28.20 is very likely fast in CARA trading if trade gets above key resistance. I put a trade alert out while recording video.
CARA THERAPEUTICS (CARA) Nice swing trade from trading bootcamp in to next leg at resistance intra day $CARA #swingtrade #tradealert
ALIBABA $BABA – this is the swing trade that I was under water on, bounced of 100 MA, now back in it’s structure, has a number of tests, 206.85 price target to upside with 237.62 most bullish scenario May 27, 2019. See chart review in video.
ALIBABA (BABA) bullish up 2% intra day, holding support of trading range well. Trim in to resistance add above. $BABA #tradealerts #swingtrade
LEVEL BRANDS $LVEB – anything over 6.00 will confirm an upside trend and if that triggers we’ll structure the charting for you and go from there.
ALTIMMUNE $ALT – hit 50 MA resistance today, alarmed for a breach above the 50 MA and a possible run to 100 MA. Will alert the trade in ALT if it breaches the 50 MA and structure the chart model for members.
NII HOLDINGS $NIHD – up 19% in trading today, aggressive chart, bounced off 20 MA, trading 5.06, good argument 5.60 as a watch area on other side of the bowl, 6.25 is a safer region to look at a possible big run to 9.00. A double upside extension is possible. It is a structured trading chart. I alarmed NIHD for a trade.
$ICCC – trading 9.13 up 20%, swing trading service provider dream, signal long when price is over 200 MA and win almost every trade, you would take the odd cut but the moves would make up any cuts taken.
$VXRT – trading 2.85, terrible chart.
$COE – bad chart.
$KNDI – not a bad chart, testing the 50 MA, over 200 MA you could start to look at it, this will likely go on a run upside over 200 MA, possible reversal setting up on this chart.
$FTNW – bad chart.
$COCP – bad chart.
$LOMA – bad chart.
TRADING ROOM VIDEO Trade Alerts: #daytrading #swingtrading
Trade Alerts Report and Video from Live Day Trading Room: $NBEV, $TLRY, $CGC, $CRON, $VKTX, $MOMO, $ROKU, $NVTA, $CRC, $THO, $DGLY, $YELP, $XXII, $CVM, $SHOP, OIL, $DXY, $SPY #daytrading #swingtrading
#TradeAlerts
Trading alerts and trading set-ups raw video from Live Trading Room mid-day review Sept 18, 2018. Some of the trade set-ups in this video are from the Trading Boot-Camp.
Again, the sound upload quality struggled, today we’ll test the hardwired set-up and see if it’s better.
Reviewed the PL for 2017 and 2018 along with goals for Q4 2018 and Q1 2019 – gearing up for a big Q4 this year and Q1 2019 (getting back to basics of trading vs software development because development funds come from trading of course).
BE SURE TO LOOK AT THE CHART DATE AND TIME IN TOP LEFT HAND CORNER OF EACH CHART.
Crude Oil $WTI $CL_F $USO – review of crude oil algorithm and crude oil trading alert at channel support that I should have held, anyway I cut and missed it. Also the top channel resistance crude oil trade set-up was good (missed it, but some of the members reporting they nailed it). Opportunities this week with trading range and EIA reviewed. Crude oil machine trading price targets reviewed also (for last week’s trade). Only 1 minute chart below showing intra day resistance on second trade attempt on day (algorithm models not below).
Oil, 1 Min, trading, chart
VIKING THERAPEUTICS $VKTX – we had this lined up in premarket, retraced intra-day.
VIKING THERAPEUTICS (VKTX) premarket up 140% on liver trial news. $VKTX #premarket #daytrading
TILRAY $TLRY – trading at only 420 x earnings or something like that. Weekly chart gap on gap on weekly body of candles. Only way I would long this is on short time frames, and I likely will when the pot stocks settle a bit – working on the charting for all the pot stocks right now (hopefully released this weekend in prep for a sector pull back when it happens).
SP500 $SPY $SPXS $SPXL – 60 minute chart reviewed, over 291.70 is the upside break resistance, above the box price targets for Sept 27 reviewed on video, various support and resistance areas reviewed.
MOMO $MOMO – signalling a long or add long over 48.50 (if it holds, you always trim in to resistance areas and then add above or wait for a pull back and add to your long trade), expected trading trajectory reviewed on video, price targets for between now and Feb 5, 2019 large time cycle peak conclusion reviewed on video. This is a very structured chart.
MOMO Inc. from Trading BootCamp over 48.50 targets 49.66 50.46 51.42 65.57 Feb 5 #swingtrading #tradealerts
22nd Century Group $XXII – price targets reviewed on video. Very structured equity that has excellent ROI ROE. Not a chart or trade set-up to ignore IMO.
22nd Century Group (XXII) over 2.85 targets 3.09 then 3.53 Nov 19 time cycle. $XXII #tradealerts #swingtrading
SHOPIFY $SHOP – bulls pressing the upside diagonal Fibonacci resistance, price targets reviewed. Great alert from Sean for an excellent swing trade. Could see previous highs in 177.00s really fast.
CEL SCI Corp $CVM – targets at 5.00 and 6.00 reviewed on chart on video and more is possible, liquidity is my issue. A double upside extension move is possible with this bullish scenario, bottom bounce structure coming out of bowl.
CVM Looking to break recent highs out of bullish bowl targets 5.00 then 6.00. $CVM #swingtrading
ROKU $ROKU – was at resistance 73.55 and price targets reviewed on video. As price nears the peak of the time cycle on the chart prepare for possible double extension blow-through on this one.
CARA THERAPEUTICS (CARA) Testing break-out area intra-day. On watch. $CARA #tradingsetups #tradealert
US Dollar $DXY – decision October 3, 2018 that is important on the US Dollar DXY charting (parallel to many other peak time cycles in broad markets). Probability is up at or prior to time cycle completion.
$RLM – no.
$OASM – if you’re a risk taking trader this is a real aggressive chart structure, top of bowl is where it is trading now but it has a nature of coming off hard and it is thinly traded.
$NBEV NEW AGE BEVERAGES – weekly chart over 50 MA targeting 100 MA not a great ROI there in that set-up, chart is hard read. On daily up over 200 MA, does respect the 200 MA on daily, Showing bullish initial signals of a return. This one should go. Volume is good, Initial view I was not too interested but as I looked closer at the NBEV chart I realized this on should be on high watch. I went in to great detail of the pivots on the chart, buy sell triggers and price targets for NBEV.
NEW AGE BEVERAGES (NBEV) Above 2.80, targets 3.27, 4.17, 4.89.
NEW AGE BEVERAGES (NBEV) Above 2.80, targets 3.27, 4.17, 4.89 $NBEV #tradealerts #swingtrading #daytrade
$BHTG – no.
$RDCM – sitting on previous trading range support. 16.00 is reasonable, decent chart.
CRONOS GROUP (CRON) $CRON – reviewed on video, on the fly chart structure model reviewed. On high watch, expect a possible upside trading scenario with CRONOS. A trendline resistance was reviewed and important support and resistance and price targets reviewed on video (while we are processing this report the morning of Sept 19 it is moving in premarket trading up 8.39% at 12.53 in premarket this morning nearing its upside trading test area, the trendline resistance was broke to upside and the 13.00 area resistance in next). Over trendline sees the next test fast and the other price targets reviewed on video.
CRONOS – per yesterday’s trade alert and review video over trendline on way to resistance test in premarket $CRONO #tradealert #premarket
AVON – Daily chart for AVON reviewed, likes the 200 MA with some room, testing resistance right now, I can’t touch it until it’s up for 3.00, needs to see recent highs first and then still some challenges.
$PYX – weekly chart reviewed, no structure I can work with.
$NVTA – aggressive structure, 18.90 alarmed on chart, has potential for a rip upside.
$EPM – not enough there. Doesn’t have margin, widths.
$CL – bad structure on chart.
YELP $YELP – technical bounce off 200 MA on the weekly chart in to resistance area on chart, if you’re long go to previous steps shown on chart in video, not taking the trade but it may work, not my thing – not enough range for ROI ROE for me.
$SRT – no.
$JONE – no.
$DEQ – no.
CANOPY GROWTH $CGC – had the opportunity to be in ground floor of this industry in Canada and turned it down jeez, getting close to previous candle high on weekly chart, could see a large a move there. Chart for Canopy Growth reviewed on the video. Can’t chase it here where it is on the chart and I’ll watch. Working on the structure of all the charts on our equities covered in our swing trading platform and when we’re done I’ll get more day trade aggressive.
CALIFORNIA RESOURCES $CRC – Aggressive chart and trade set-ups, coming out of bowl, 39.32 an 39.86 pivots on chart reviewed on video. Start watching it at 40.00 and see how it does.
THOR INDUSTRIES $THO – resting on the 200 MA trading about half way between it and 100 MA, it will likely turn here, price above moving averages on chart with 20MA breaching the 50 MA is a good entry long on this chart. The sidewinder set-up will be key on this one (reviewed on video) – that’s where the good returns are.
$MRSN – no chart structure, junk.
DIGITAL ALLEY $DGLY – trading 4.05, daily chart, getting in to diagonal trendline resistance at 12.20 right now, over 12.31 is a nice confirmation to the long side of this trade. Nice chart.
$CCXI – swing traders service type of trending stock that has way to many steps and not enough ROI, the step type that chop up a trader I’m not interested in.
$MHLD – no.
$BRID – no.
$NXIO – chart structure can get aggressive, gapping through chart structure makes me nervous.
There were many more of the momentum stocks for the day reviewed and the stocks selling-off on the day were also reviewed.
TRADING ROOM VIDEO Trade Alerts: #daytrading #swingtrading