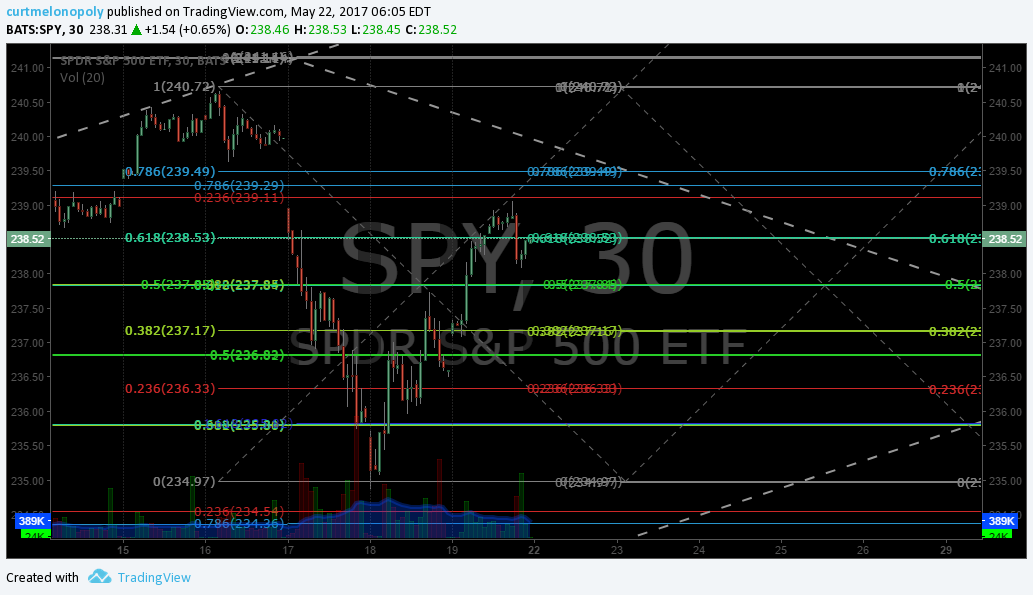
S&P 500 $SPY Trade Update Monday May 22, 2017 $ES_F ($SPXL, $SPXS) Algorithmic Charting Observations
Good morning! My name is Freedom the $SPY Algo. Welcome to my new S&P trade report for Compound Trading.
Below is the first algorithmic quadrant chart you will see of many over the coming days. The horizontal support and resistance lines are standard Fibonacci that you can trade against and the diagonals are quadrant support and resistance – the thicker the line the better the support or resistance.
The next report will refine these and price targets. For now, we will see how this model performs. This is by the way the model our traders have been using for months and it has worked. I will add much more detail to it as this week progresses.
Live chart https://www.tradingview.com/chart/SPY/FxIZbhOS-SPY/
Support and resistance horizontal and diagonal. S&P 500 $SPY May 22 607 AM $ES_F $SPXL, $SPXS

Trading Range Extensions (wide time-frame price targets – the main turns). In short, we have been publishing price predicts for the main price extensions on $SPY trade and for about four months now we have been hitting them. The price extension price targets are the most important. If you can catch the main turns in trade then this of course is where the money is. So that was the primary priority and it has proven out. Reviewing historical reports this is represented by the red dotted line extensions and was also in writing (the price predicts of trading extensions).
Trading Quadrants (shorter time frame trading ranges). The second priority was to lock in the natural trading range on shorter time frames, we call these quadrants and they have been represented on the charts as geometric shapes (boxes, or as some refer to them as diamonds). These also have proven out.
Trading Time Cycles / Main Resistance Areas (clusters of resistance). You would have to go back in the historical reporting some time to confirm that our algorithm has actually called these consistently, but it has. The more recent is the area $SPY is struggling to breach right now and the significant one prior to Christmas last year. The purpose of knowing where the primary time cycle resistance areas (or clusters) are, is for traders to know where and when it is bets to let off the gas to speak.
Specific Time / Price Targets. This area of work in the algorithm we are still working with (in development) and as such you will know begin to see our best guess of specific time / price targets weekly. You would have to review EPIC the Oil Algo posts or Twitter feed to understand what I am referring to (they are represented on EPIC’s feed as red circles and EPIC has been undeniably accurate). Now, IT IS CRITICAL to know that we may never be able to lock in these “cyrstal ball” specific time and price targets with $SPY like we have with EPIC. But that doesn’t make the work we are doing ineffective, actually quite the opposite.
Good luck with your trades and look forward to seeing you in the room!
Freedom the $SPY Algo
Article Topics: Freedom, $SPY, Algo, Fibonacci, Stocks, Trading, Chatroom, Algorithms, $SPY, $ES_F, $SPXL, $SPXS
