How to Trade $BOX Earnings:
Price Targets | Buy Sell Triggers | Symmetry | Channel | Time Cycles | Support and Resistance
May 13, 2018
What’s New
- Now available for serious traders, information here for our exclusive Legacy All Access Membership.
- 24 Hour Crypto Trading Desk opens mid May 2018 along with our Coding Algorithm Models for Machine Trading. This team is also responsible for alerting trades on the live Twitter alert feeds for all models. Formal announcements to follow.
This trade symmetry was alerted today by Sean @chefducati (Twitter). Give him a follow – he does his homework.
Part 1 – The Battle Plan | How to Trade the BOX Earnings Move (Chart Structure)
This time I will start with the exclusive member algorithmic model charting (the end of the story) and if time allows I’ll put out a conventional charting post to the public.
But for members, here’s the set-up;
If I have time I will also publish the daily time-frame, below is a weekly simple charting model.
https://www.tradingview.com/chart/BOX/7il5UXjz-BOX-Weekly-Algorithmic-Model-Chart-earnings-trading/
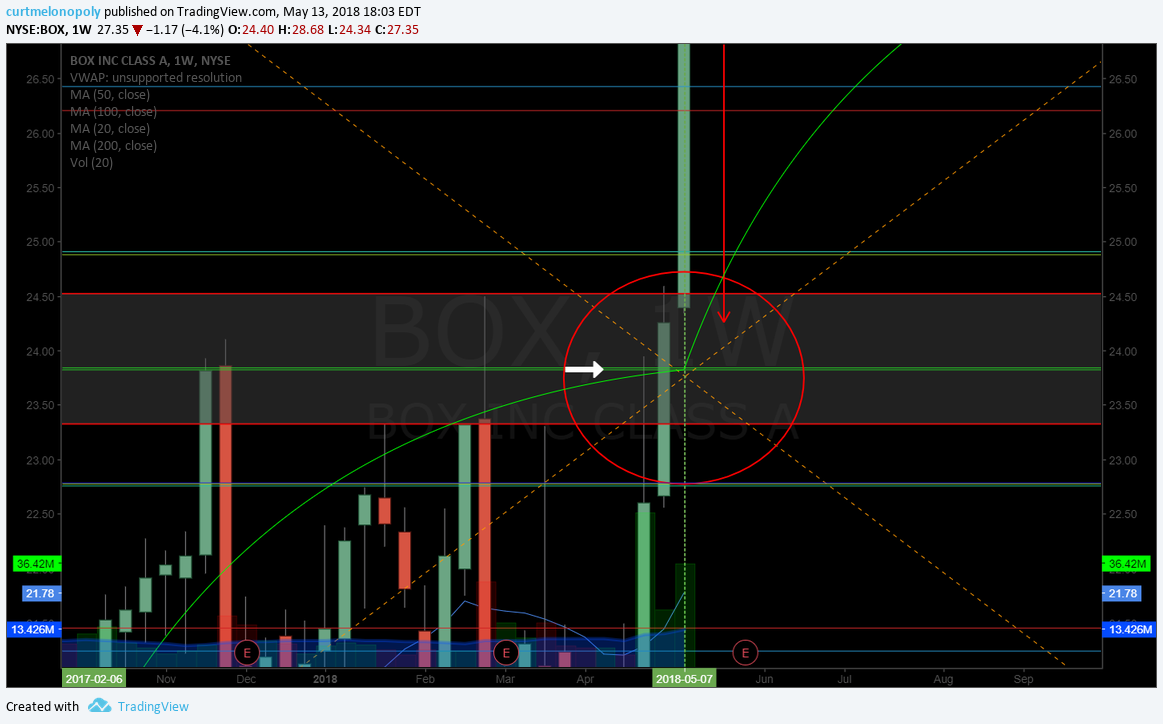
$BOX Weekly Algorithmic Model Chart #earnings #trading

Trading the move.
Here’s a break down of your key levels, it is technical so don’t hesitate to ask questions:
Symmetry – As Sean pointed out when he alerted my, the symmetry is amazing with this stock. The weekly symmetry is charted between the targets with the green arcs and red circular targets. Each time price lands at a mid quad (important horizontal Fib support / resistance).
Channel – The weekly time-frame uptrending channel allows for a potential price spike to 32.87 to 33.15 with-out trade being divergent (outside of the algorithmic charting structure). Anything over that would be considered divergent in this time-frame and is a significant short sided bias scenario.
Support and Resistance – Your primary current upside resistance is at 28.36 – it closed Friday at 27.35. Your primary support in the current trading range (the current quadrant) is 23.85. See white arrows.
The Nature of Trade – It is in its nature to test the first Fib support down from the mid quad horizontal support / resistance. In this instance that is at 26.44 area. If it bounces prior to this that is a bullish signal. Long side adds in here are appropriate if trade turns on a tighter time frame such as th 30 min or 1 hour or even 4 hour.
The opposite is true if trade is above the mid quad and that resistance is at 30.24. In a long scenario trim heavy in to 30.24 and add above.
The Channel – The yellow arrows are the top and the bottom of the wide time frame (weekly) structure. They are absolute short or long side signals if trade enters either region.
Price Targets – The next price target in symmetry is Dec 10 at 28.32. However if it becomes extremely bullish the upper price target is 37.24 in that trading quadrant and top of channel.
In a bearish scenario on the same day, December 10, 2018 the target is 19.30.
Trade price toward the target but don’t forget to trim longs one Fib above the mid quad or in a short scenario cover bias should be engaged at one Fib lower than the mid quad (as explained above).
Again, this is technical so if you need a hand with your trading plan let me know. Bottom line is that each line is support and resistance – add above and trim in to them when long and when short start covering in advance and increase sizing when support fails.
In Closing:
I will re-iterate that a few hours of trade coaching or study on exactly how to trim in to resistance and how to add to your positions on winners and how to cut losses properly and quickly will return huge dividends.
You can subscribe to our Weekly Swing Trading Newsletter service here, use temporary Promo Code “30P” for 30% off Reg 119.00 Sale Price 83.30.
Or click here to subscribe and get 30% off Real-Time Swing Trading Alerts Reg 99.00 Sale Price 69.37 use temporary Promo Code “Deal30” for 30% off.
I personally guarantee our swing trading service is one of the best in the business and it’s very reasonably priced considering the technical expertise invested in the platform.
Any questions feel welcome to contact me anytime.
Hopefully I will get time to model this on shorter time-frames soon for more intra-day daytrading scenarios.
Thanks again to Sean for alerting this!
Good luck with your $BOX earnings trade and if you need any help message me anytime!
Best,
Curt
If you are not already on our Free Swing Trading Periodical email list follow the link here to get on it to receive trading set-ups in the future. Unsubscribe anytime.
Connect:
Register to free email list for trade set-ups, webinars, special events: https://compoundtrading.com/contact/
Website: https://compoundtrading.com
Free chat room: https://discord.gg/2HRTk6n
Subscribe: https://compoundtrading.com/overview-…
Twitter: https://twitter.com/CompoundTrading
Lead Trader: https://twitter.com/curtmelonopoly
Tradingview: https://www.tradingview.com/u/curtmel…
Facebook: https://www.facebook.com/compoundtrad…
StockTwits: https://stocktwits.com/compoundtrading
Email: https://info@compoundtrading.com
Compound Trading Platform: Algorithm model charting for $SPY, $VIX, #OIL, #GOLD, #SILVER, #Crypto ($BTC Bitcoin, $ETH, $LTC, $XRP,) $DXY US Dollar and Swing Trading Newsletter. Live trading rooms for daytrading and oil traders. Private coaching and live alerts.
