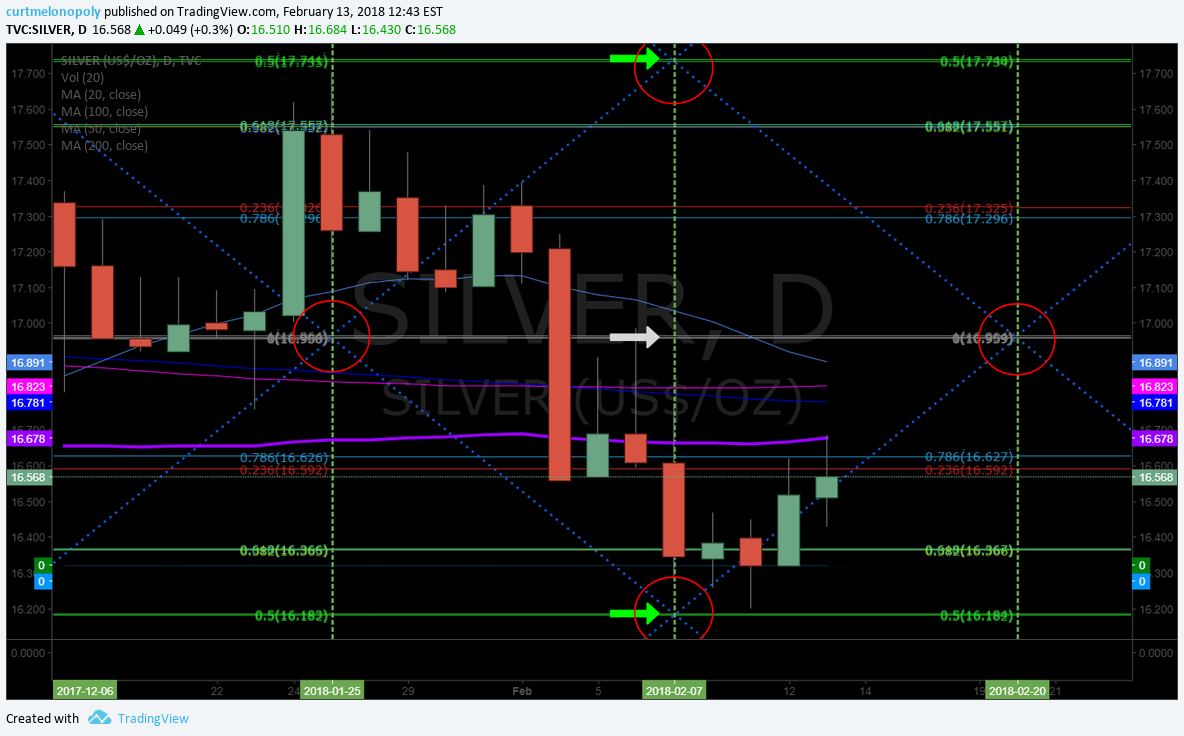
Silver Trading Chart Update Tuesday February 13, 2018 $SLV ($USLV, $DSLV) Chart and Algorithm Observations
My name is SuperNova the Silver Algo. Welcome to my new Silver trade report. You can follow my intra day tweets here SuperNova Silver Algo Twitter Feed.
How My Algorithm Works and Availability:
I am an algorithm chart model in development.
Below you will find my simplified view of levels that can be used on a traditional chart to possibly advance a traders’ edge (both intra-day and as a swing trader). This work, and your subsequent trading, should be considered one decision at a time, “if this happens then this or this are my targets”… price – trigger – trade and so on (rooted in technical set-up).
My algorithmic charting will eventually transition to developer coding phase for our trader’s dashboard program. I am not an automated bot or high frequency type algorithm (HFT). Please review my algorithm development process.
Below you will find simple Generation I Level chart modeling with a goal toward generation 5 modeling as with EPIC the Oil Algorithm model (for example).
Silver Trading Observations
SuperNova $SILVER Algo Chart Model Daily Chart Tuesday Feb 13 2018 $SLV ($USLV, $DSLV)
Real-Time Silver Daily Chart Link:
Buy sell triggers are represented with green and grey arrows. Trading quadrant walls are also support and resistance decisions (blue dotted diagonal lines) as are horizontal Fibonacci horizontal lines (various colors).
The current short term trend is bullish so trade in direction of trend using the support and resistance decisions of the Fibs, Quad walls and paying attention to the upper apex, inverse apex and mid quad horizontal support / resistance line targets.
Key Silver Buy Sell Triggers (wide range swing trading):
18.51
17.74
16.97
16.18
Silver Generation I simple model functioning well with quads, price targets, buy sell triggers. 1245 PM Feb 13 $SLV $DSLV $USLV #Silver

Wider view of mids, upper, inverse apex quad price targets hitting. 101 PM Feb 13 $SLV $DSLV $USLV #Silver

Per previous;
SuperNova $SILVER Algo Chart Model Daily Chart Sun Jan 28 2016 PM $SLV ($USLV, $DSLV)

Uptrend channel scenario if resistance MA and Fib horizontal line resistance gained. 110 PM Feb 13 $SLV $DSLV $USLV #Silver

Lower downtrend channel scenario if resistance MA and Fib horizontal line resistance points hold. 106 PM Feb 13 $SLV $DSLV $USLV #Silver

Silver on Daily Chart hit 50 MA and 20, 100, 200 MA’s not far above. Could get interesting soon IMO but needs 16.99. $DSLV $USLV #Silver

SuperNova $SILVER Algo Chart Model 2 Hour Chart for day trading Silver Feb 13 133PM PM $SLV, $USLV, $DSLV
Below is a 2 hour time-frame Silver chart that allows for precision trade entries and daytrading Silver as you deem.
Realtime Silver chart link:

Per previous;
Real-Time silver chart link (2 hour time-frame) https://www.tradingview.com/chart/SILVER/XP7eaTex-SuperNova-SILVER-Algo-Chart-Model-2-Hour-Chart-Sun-Jan-28-2024/

Silver has a time price cycle peak terminating Jan 31 615 AM – watch for a move in to that peak range in timing. $SLV ($USLV, $DSLV)

Silver MACD on Daily chart provides consistent trend directional trade indication and ROI. $SLV $DSLV $USLV #Silver
Real-time Silver chart link with MACD:

Per previous;
Silver MACD on Daily chart provides consistent trend directional trade indication and ROI. $SLV $DSLV $USLV #Silver #SI
Real-time chart link:
https://www.tradingview.com/chart/SILVER/DI9NmX6M-Silver-MACD-on-Daily-chart-provides-consistent-trend-directional/

Good luck with your trades and look forward to seeing you in the room!
SuperNova Silver Algo
Article Topics: Commodities, Trading, Silver, Chart, Algorithm, $SILVER, $SLV, $USLV, $DSLV
