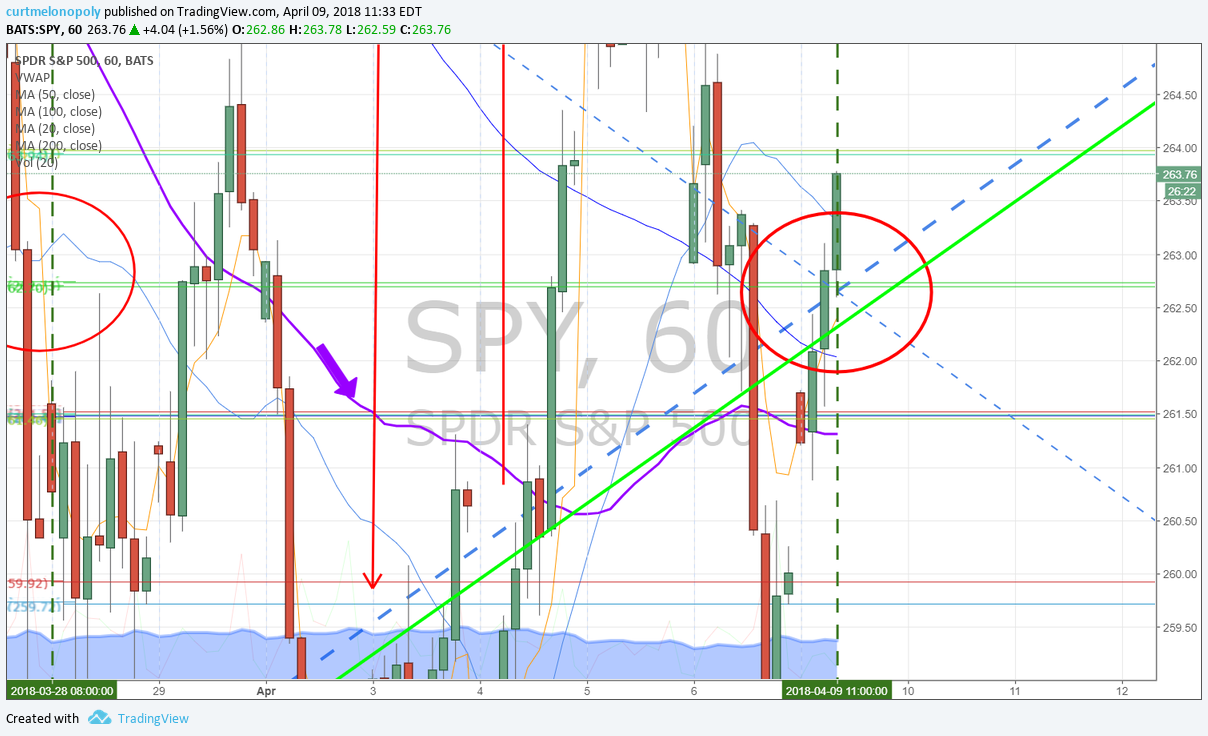
Trade had to jam hard to nail price target on $SPY model. It was posted many days ago – the structure, the support area , the channel of trade and the exact price target and timing.
$SPY really had to get some jam to nail that simple algorithm model price target in to time cycle peak. #Boom

Last week I posted this chart of the model saying that Monday (today) was do or die and that I was long biased. See last week’s $SPY chart here:
Today is a time-cycle peak so this has been a fantastic trade set-up for us.
Then right before market close on Friday 3:04 PM when I was about to literally dive in the deep blue for a free dive I looked at my phone one last time and seen $SPY dumping… I knew folks were panicking so I sent out this urgent tweet and then in to the deep I want (peaceful place). The tweet was as follows;
$SPY Don’t let em steal from you folks. Monday is SP500 1.50% do or die day. Time cycle peak. See chart Notes. https://www.tradingview.com/chart/SPY/3wnnSkEX-Monday-is-SP500-do-or-die-day-Time-cycle-peak-Chart-Notes/ …
See tweet here: https://twitter.com/curtmelonopoly/status/982333206639841280
Prior to March 28 I was signalling long side support in range and on Mar 28 published this on the fly simply model stating channel support was likely going to be in this range. Subsequent posts followed up with structured trade charting alerts.
This is how it is done…. “they” know in advance where the test areas are…. knowing how to model the instrument structure in advance of trade and then being able to recognize what “structure” is needed is critical for your trading profits.
On March 31 I signaled my formal Long buy positioning and have enjoyed the trading range since.
For more detail on the time cycle peaks for your trade, price targets, and support / resistance points relating to your personal trading plan contact me with any questions you have.
Best and peace!
PS Remember to trade price – if the trade goes against you it is always better to take a small loss than be married to a bad chart / stock.
$SPY. How I nailed exact price and time on this model and alerted the long side in advance of today's #boom. See detailed chart notes. "SPY really had to get some jam to nail that price target in to time cycle peak". #Boom #trading #algorithm #edge https://t.co/vrpCSGlzGU pic.twitter.com/aE12CaD3g6
— Melonopoly (@curtmelonopoly) April 9, 2018
I will be live broadcasting this trading set-up and other chart set-ups documenting my process in detail for review w/ daily PL’s, video, charting set-ups and alerts.
Click here to Subscribe to $SPY Algorithm Charting Newsletter.
Get Involved, other important links:
Register to free email list for trade set-ups, webinars, special events: https://compoundtrading.com/contact/
Website: https://compoundtrading.com
Free chat room: https://discord.gg/2HRTk6n
Subscribe: https://compoundtrading.com/overview-…
Twitter: https://twitter.com/CompoundTrading
Lead Trader: https://twitter.com/curtmelonopoly
Tradingview: https://www.tradingview.com/u/curtmelonopoly/
Facebook: https://www.facebook.com/compoundtrading/
StockTwits: https://stocktwits.com/compoundtrading
Email: https://info@compoundtrading.com
Compound Trading Platform: Algorithm model charting for $SPY, $VIX, #OIL, #GOLD, #SILVER, #Crypto ($BTC Bitcoin -4.30% , $ETH, $LTC, $XRP,)$DXY -0.19% US Dollar -0.19% and Swing Trading Newsletter. Live trading rooms for daytrading and oil 2.08% traders. Private coaching and live alerts.


