How to Trade Alphabet (GOOGL) Post Earnings. Google Stock Trade $STUDY and Preparation. Technical Charting for Swing Trading, Day Trading and Investing. Member Edition of Report.
Trading Plan for Alphabet (GOOGL), July 29, 2018.
Google has been an excellent swing trade / investment for our team and the alerts and charting have been spot on. The post below revises our existing charting and brings more specific levels to the trade of this instrument for shorter time frames (even daytraders will be able to take advantage of the levels) and of course longer term investors / swing traders.
There is wisdom in timing your entries as well as trimming and adding at key points in the chart structure.
I have always said to simply buy and hold the Google stock and don’t look at it, however, there is wisdom in timing your entries as well as trimming and adding at key points in the chart structure.
Also, this week the key support area could touch in trade and this would present an excellent day trade scenario (or weekly trade scenario for daytraders to add and trim through the chart structure).
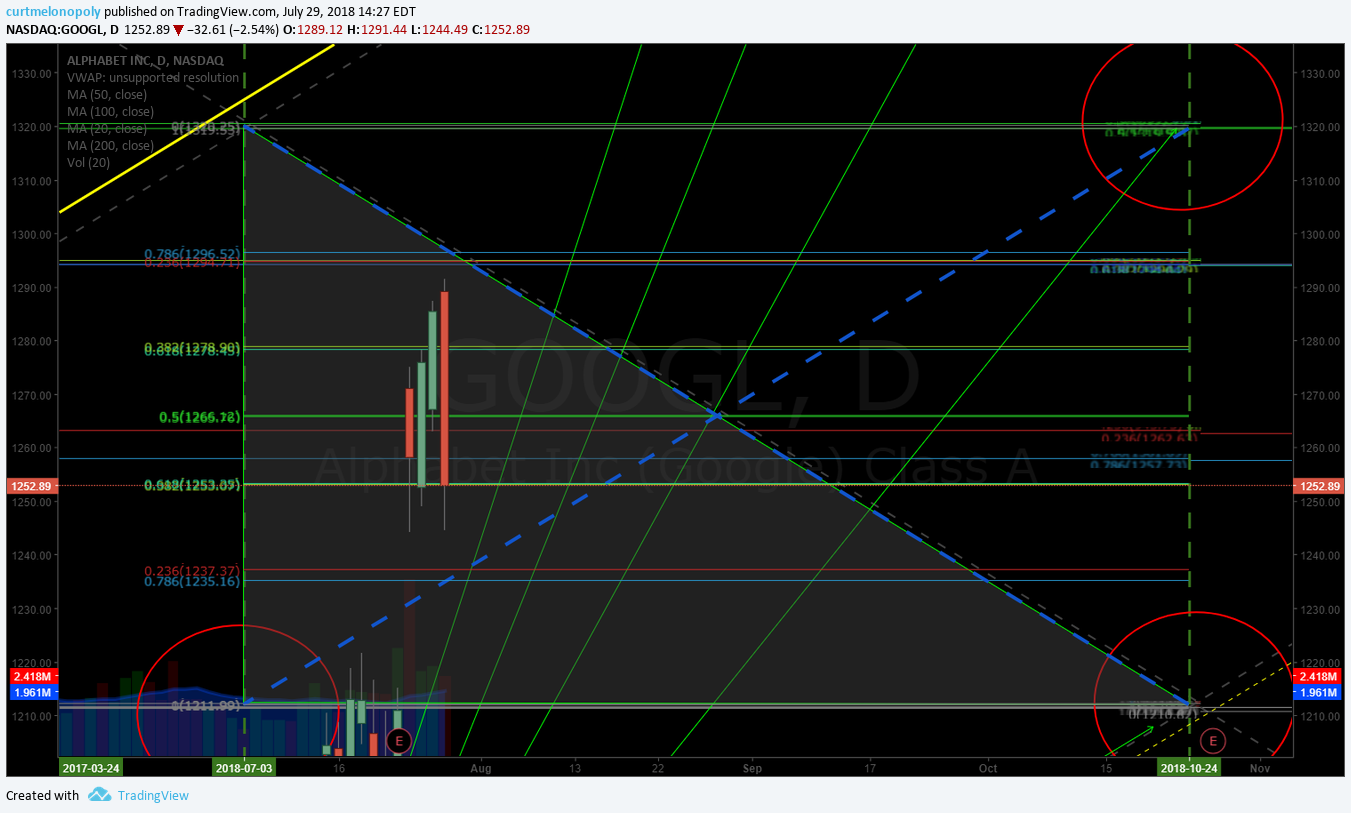
ALPHABET (GOOGL) The projected July 3 target area did hit (albeit a bit late), current trade structure on chart, price came off at Fibonacci resistance / quad wall (diagonal down slope Fib trend line). $GOOGL
1320.20 is key range resistance.
1294.89 Fibonacci resistance and quad wall area price came off.
1263.00 Fib resistance.
1257.80 Fib resistance.
1252.89 trading intra.
1211.80 key range support.
1102.74 key range support one leg down in a sell-off.
Keep in mind the diagonal up trend yellow lines that illustrate the algorithmic channel. Above the channel is considerably over bought, mid channel (dotted yellow) has been historical buy zone and below that (yellow bottom channel line) is the bottom of the channel. Price is not visiting the bottom of the channel, but in a sell-off scenario this will be a considerable buy zone to contemplate.
Current trading range is highlighted in the green triangle. For shorter time frame traders long near bottom of the triangle and short at the outter upper edge of trading structure (triangle) are key points for trimming longs and adding etc.
Upside is limited here for new entries unless price nears the mid channel (dotted yellow).
Also pay attention to those trajectory lines (green) from target to target, you will find trade will react to those areas. This should only be considered for short time frame trims and adds.
Most probable Google price target is 1320.20 October 24, 2018
Most probable Google price target is 1320.20 October 24, 2018 but the 1440.00 area at top of channel on October 24 is also possible.
In a sell-off 1211.80 area is likely and in considerable sell-off look to 1102.00 then 994.00 on same Oct 24, 2018 time cycle peak – unlikely but noted.
Our Google Trading Plan:
We have been long for some time (in accordance to alerts and swing trading member reports), we are trimming at top of this trading structure (triangle in green) and adding at bottom of structure until the structure is broke and then we will move to the next.
Below is the Google main chart with live link:

Trading Alphabet – Google on shorter time frames for daytrading and trade entries and trims for swing trading and investing. $GOOGL
Below is a tighter time frame charting with additional lower time frame Fibonnaci support and resistance areas.
This chart will be front and center for my premarket and market open trading on Monday morning.

Alphabet (Google) in the News:
$GOOGL Alphabet is looking even better after Facebook’s disappointing earnings #swingtrading #earnings $FB https://cnb.cx/2LZ6jRe
Google is laying the groundwork for life beyond advertising $GOOGL #swingtrading https://qz.com/1342305/google-is-laying-the-groundwork-for-life-beyond-advertising/?utm_source=YPL&yptr=yahoo
If you have any questions about this special Google trading report message me anytime. If you do not know how to take advantage of algorithmic structured trading charts please consider basic trade coaching of at least 3 hours to get on the winning side of your trading – you will find details here.
Cheers!
Curt
Temporary Promo Discounts (for new members only).
Subscribe to Weekly Swing Trading Newsletter service here Reg 119.00. Promo Price 83.30 (30% off). Promo Code “30P”.
Or Real-Time Swing Trading Alerts Reg 99.00. Promo Price 69.37 (30% off). Promo Code “Deal30”.
I personally guarantee our swing trading service is one of the best in the business and it’s very reasonably priced considering the technical expertise invested in the platform (Lead Trader).
Subscribe to Swing Trading Service:
Swing Trading Bundle (Swing Trading Newsletter and Live Swing Trading Alerts).
Swing Trading Newsletter (Weekly Newsletter Published for Traders).
Real-Time Swing Trading Alerts (Private Member only Twitter Feed).
One-on-One Trade Coaching (Via Skype or In-Person).
Free Mailing List(s):
Join Email List for Free Trade Charting Trade Set-ups, Deals, Podcasts and Public Webinars.
Free Swing Trading Periodical Contact Form (Complimentary Swing Trade Set-Ups to Email)
Public Chat:
Visit our Free Public Chat Room on Discord.
Follow Me:
