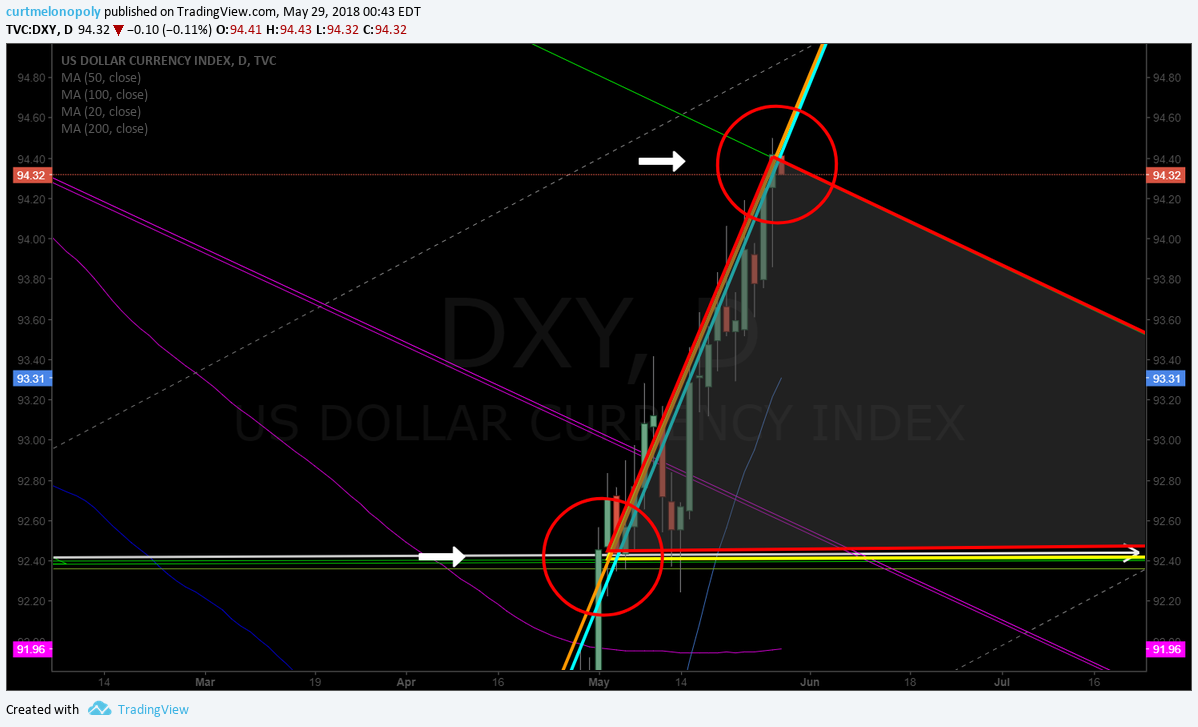
Specific Levels to Trade US Dollar Index (Swing Trading and Day Trading). $DXY $UUP
From Part 1 below is the webinar video in case you missed it:
Video: How to Trade US Dollar Webinar:
Click here for a direct link to the How to Trade US Dollar Index $DXY Video.
Swing Trading Levels for US Dollar $DXY
US Dollar Index Weekly chart 200 MA resistance is long side swing trade trim area. $DXY $UUP #USD
Currently the 200 MA is at 94.84 and the dollar is trading at 94.33 so it isn’t far off. Careful on long side swings in to that resistance point on the chart.
The 50 MA and the pivot (red horizontal line) are support areas in a wash-out.
https://www.tradingview.com/chart/DXY/sAFAfThC-US-Dollar-Index-Weekly-chart-200-MA-resistance-is-long-side-swin/

US Dollar Index Algorithm chart support and resistance points on charting. $DXY $UUP #USD
The US Dollar in this uptrending move has followed the trend line on the algorithm charting and has now hit three target areas.
It is currently trading at 94.33 with target area hit in earlier trade around 94.40.
The next resistance above is the diagonal trendline (white dotted) at just over 95.00 intra-day.
The next resistance above that is the horizontal purple line (historical resistance) at approximately 95.72.
And the next resistance over that is the top of the next trading range (the blue triangle) The upper blue triangle downtrending line is a resistance line (as are all others like this one).
Then above those are the next triangle tops at approximately 97.50 and 100.50 and other lines on the charting in between.
It is important to note that the diagonal uptrending dotted white lines act as significant support in a retracement after the price has hit the apex area of a triangle structure (which is occurring now – top of red triangle structure). Price may not retrace here as it is a smaller less important triangular structure in the model but it is important to note just in case the US Dollar retraces here.

Historical example from 2017 of how price can use diagonal trendline as support. US Dollar Index Algorithm. $DXY $UUP #USD
Below is a chart from 2017 that shows trade bouncing off the diagonal trendline I described in the previous chart.

Day Trading Levels for US Dollar $DXY
When daytrading the US Dollar use the weekly chart above as your important pivots (keep them in mind). Also use the geometric charting of the algorithm. Every line is a potential support and resistance. Be well aware of where each line is.
Then use simple charting per below for entries and exits on your trades:
The 200 MA on hourly $DXY chart is a very high probability long signal. #daytrading #USDollar

On the 5 min or 15 min trimming long positions should be at each MA lost. #daytrading
Understanding how to use your moving averages to trim long positions is an important mechanism as a daytrader and makes trades really simple. Depending on your comfortable time-frame, you can long above the 200 MA on a wider time-frame like the 60 or 30 min and trim longs on the 1 min, 5 min or 15 min as price loses each MA. In the example below the chart shows the 20 MA, 50 MA, 100 MA and 200 MA.
And then be sure you are watching the levels on the geometric algorithm charting and the other algorithm charting included in reports.

Connect:
Register to free email list for trade set-ups, webinars, special events: https://compoundtrading.com/contact/
Subscribe to our Weekly $DXY US Dollar Index Newsletter Here
Website: https://compoundtrading.com
Blog: https://compoundtrading.com/blog/
Free chat room: https://discord.gg/2HRTk6n
Subscribe: https://compoundtrading.com/overview-…
Twitter: https://twitter.com/CompoundTrading
Lead Trader: https://twitter.com/curtmelonopoly
Tradingview: https://www.tradingview.com/u/curtmel…
Facebook: https://www.facebook.com/compoundtrad…
StockTwits: https://stocktwits.com/compoundtrading
Email: https://[email protected]
Curtis Melonopoly (@curtmelonopoly) is rated Top 250 Stock exchanges authority, covering also Mathematical finance and Economy of the United States.
Compound Trading Platform: Algorithm model charting for $SPY, $VIX, #OIL, #GOLD, #SILVER, #Crypto ($BTC Bitcoin, $ETH, $LTC, $XRP,) $DXY US Dollar and Swing Trading Newsletter. Live trading rooms for daytrading and oil traders. Private coaching and live alerts.
