Author: $DXY US Dollar Index
US Dollar Index (DXY) Algorithm Report Thurs July 12. $DXY $UUP #USD #Algorithm
DXY US Dollar Algorithm Model Charting Report Thursday July 12, 2018 $DXY $UUP
Welcome to my report for Compound Trading – $DXY the US Dollar algorithm charting model.
I am an early development model – one of seven in development at Compound Trading Group. This work is very early stage generation 1 work. Generation 2 – 5 is scheduled for 2018 and will eventually be coded to a digital dashboard for our traders to use as an intelligent assistant.
This charting is to be used in conjunction with conventional charting as trader assisted signals. The signals in the model (at this point) are simple that each line on the model chart are considered a support and resistance test.
Notices:
Feature Post with Charting: How to Trade the US Dollar Index Move (Part 1) $DXY $UUP #USD #trading #chart #algorithm
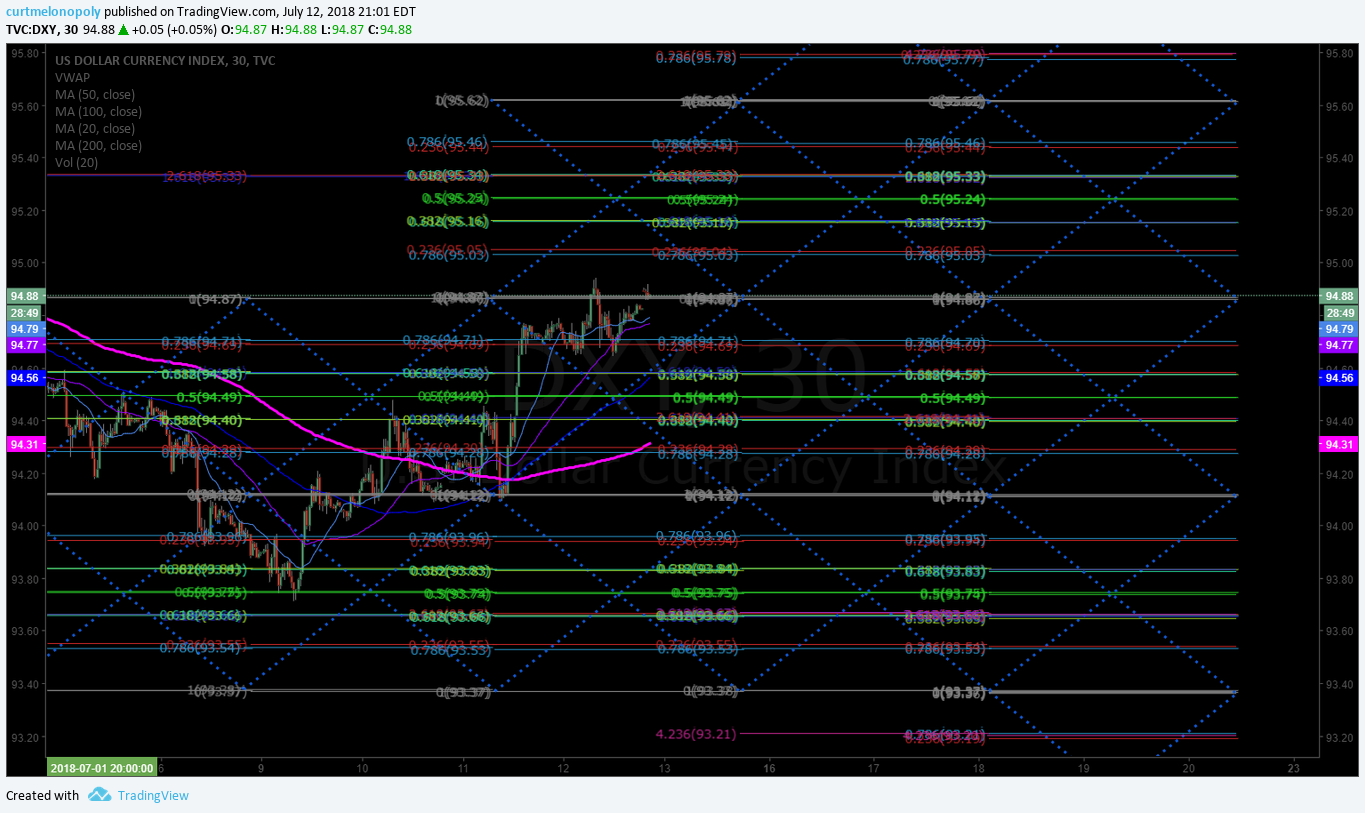
US Dollar Index (DXY) Algorithm. 30 Minute Chart Model $DXY $UUP
US Dollar Index (DXY). Above 200 MA in an upturn on daytrading 30 Min Chart Model. July 12 901 PM $DXY $UUP #algorithm #chart
The mid quad 94.87 area is an important resistance point.

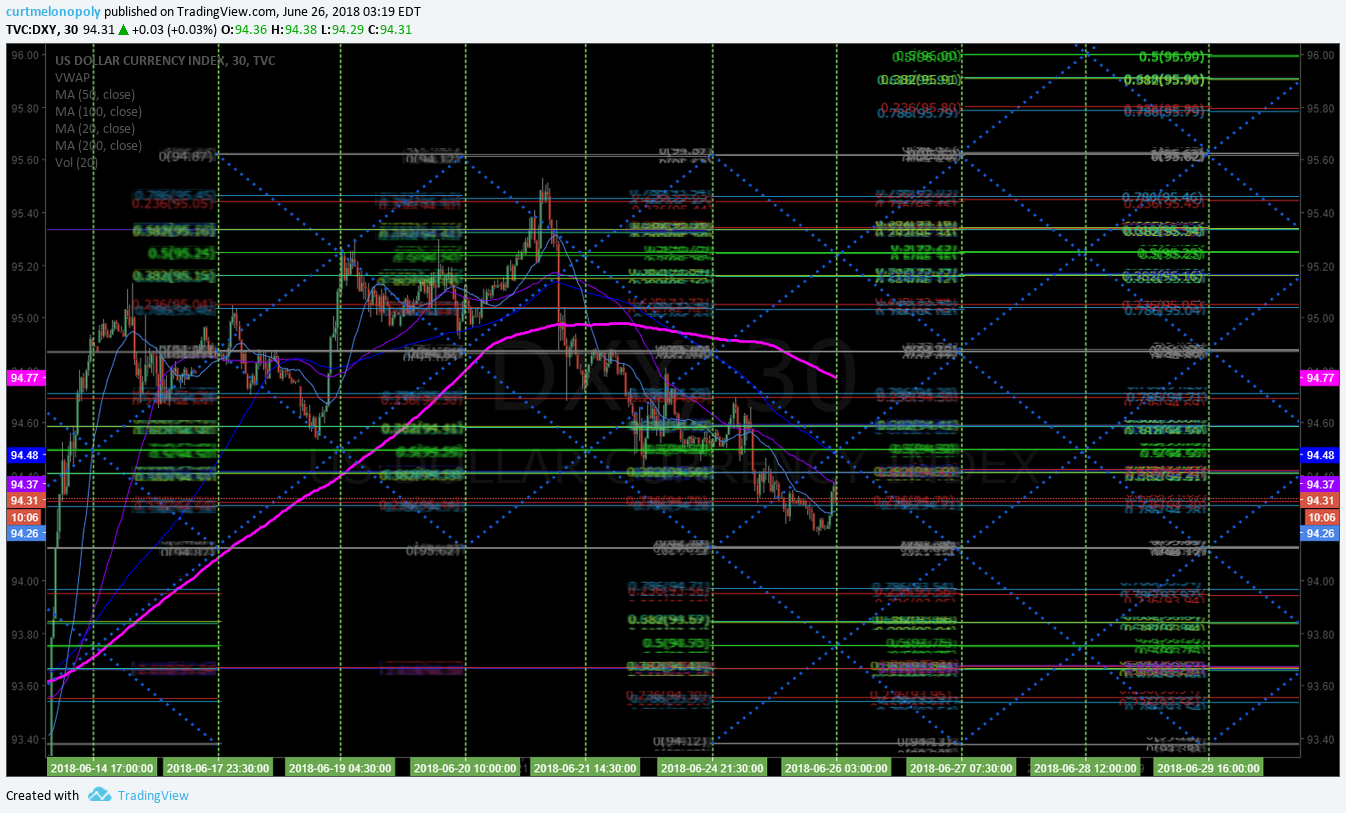
US Dollar Index (DXY). Under pressure from 200 MA on 30 Min Chart Model.June 26 321 AM $DXY $UUP #algorithm #chart

$DXY Geometric Daily Algorithm Chart Model
US Dollar Index (DXY) Algorithm. Above light blue structure resistance is the orange structure on chart. July 12 949 PM #algorithm $DXY #Chart

US Dollar Index (DXY) Algorithm. Structure in play. Trade in geometric structure (light blue). #algorithm $DXY #Chart

Per recent;
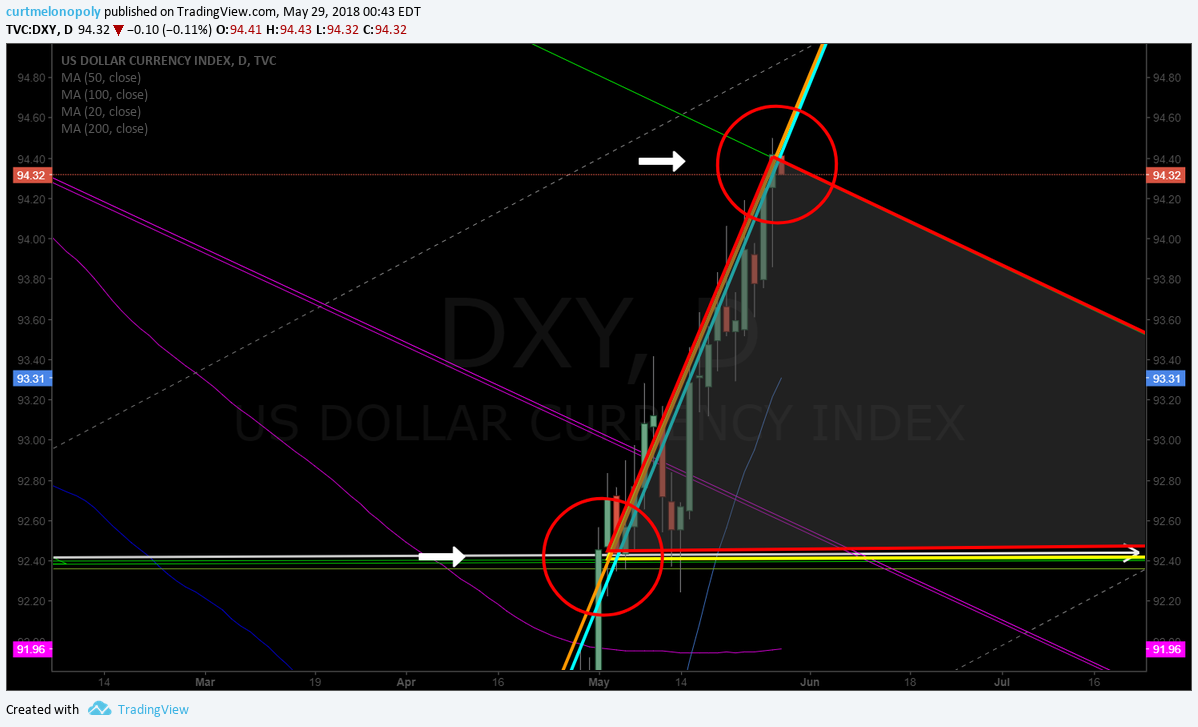
US Dollar Index (DXY). Geometric algorithm chart model magnified ith test structure. $DXY #Algorithm #Dollar

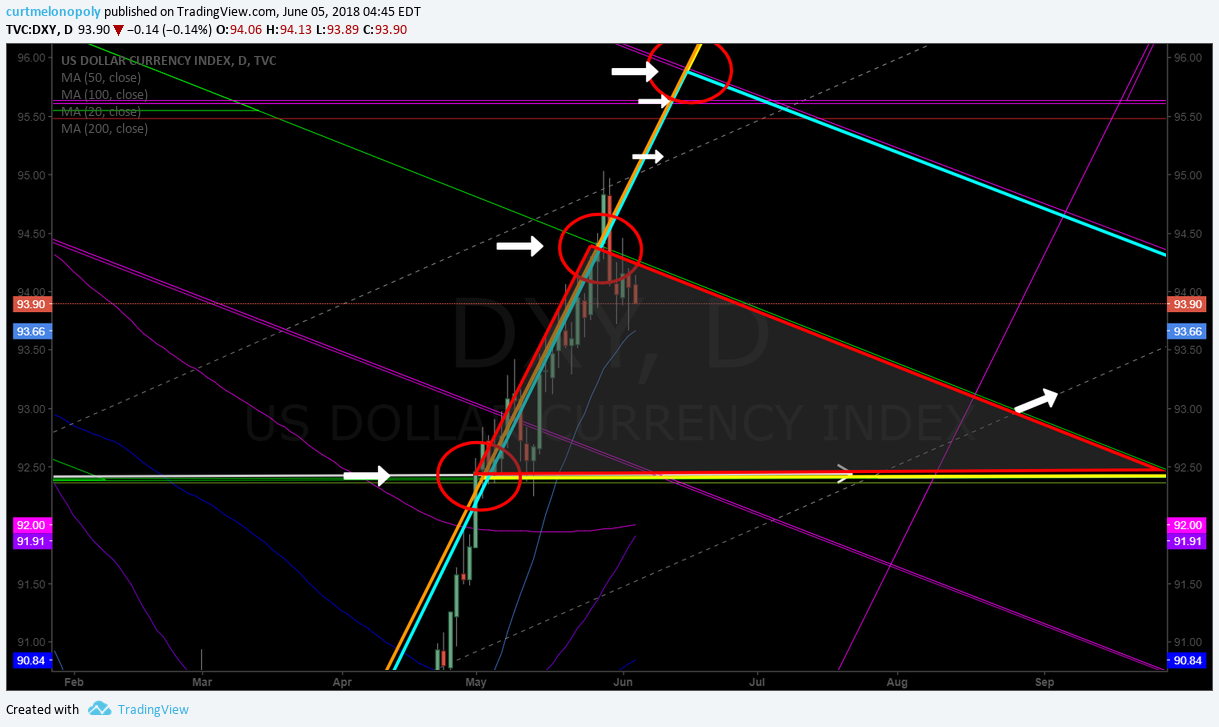
US Dollar Index (DXY). Algorithm structure in play on daily chart. Trade inside geometric structure (red). #algorithm $DXY #Chart

Per recent;
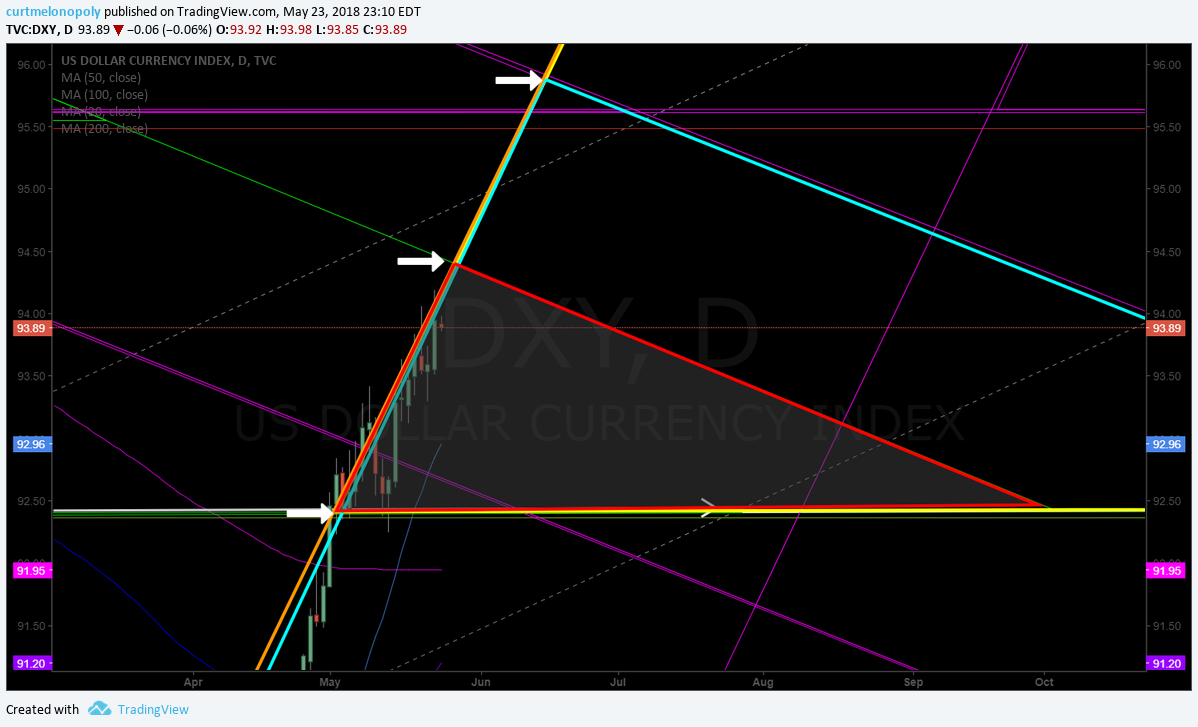
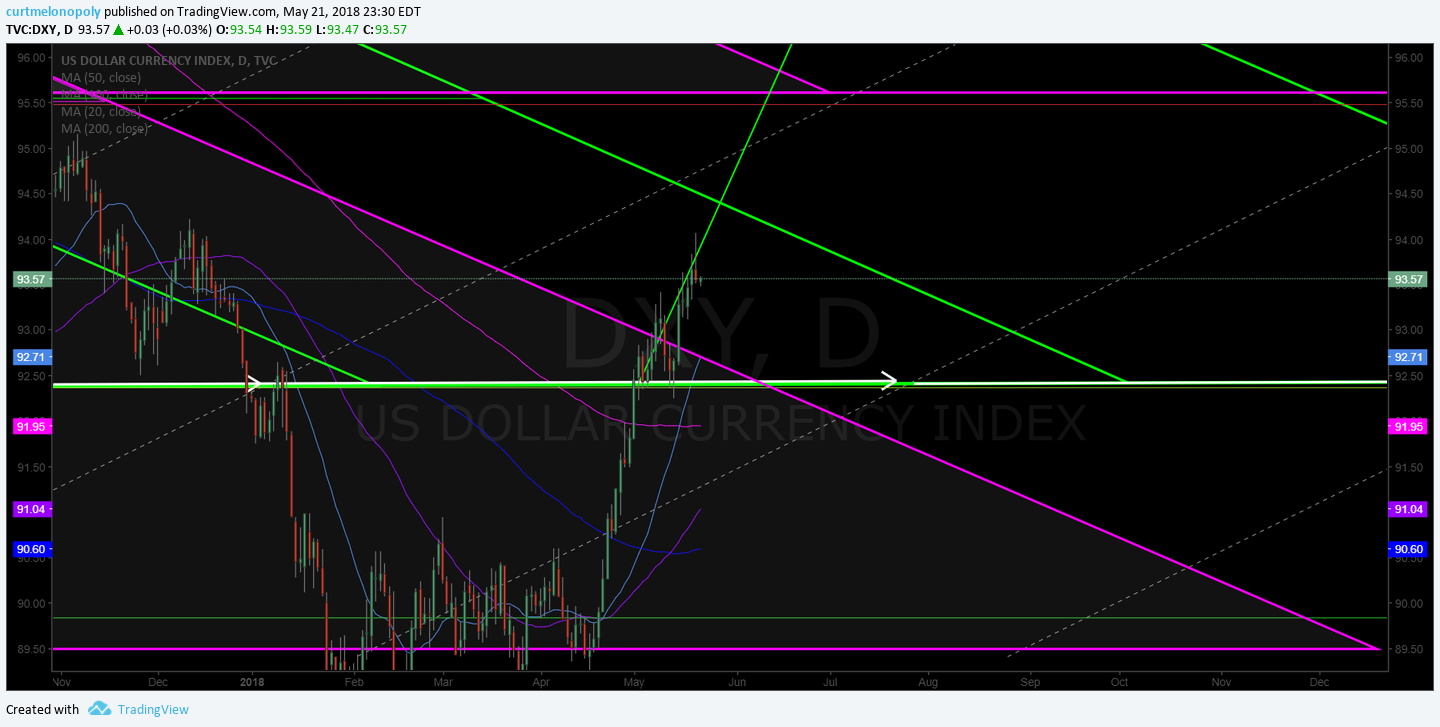
Below is the geometric model for the US Dollar. I’ve provided a close up image and a regular image with chart link.
The most important areas of trade structure are the red, orange, blue, yellow triangles.
The chart needs a significant reset, but for now we are watching the structure of the red triangle to see how it concludes.
Close up of Geometric Algorithmic Model for US Dollar Index $DXY.

https://www.tradingview.com/chart/DXY/GD3huNnE-DXY-Geometric-Model/

Per recent;
May 13 – Big test with the dollar here. Visually intense on the geometric US Dollar model. $UUP $DXY
Use link below from last report to view real time chart.

Per recent;
US Dollar $DXY touched 200 MA on daily and backed off. Geometric model charting.

Conventional Charting Considerations:
July 12 – US Dollar Index (DXY) Chart. Trade continues to pressure 200 MA on weekly chart. #chart $DXY #Dollar

June 25 – No significant structural change to Weekly chart – refer to previous report link below.
Per recent;
US Dollar Index (DXY) Chart. Trade came under pressure at 200 MA on weekly chart as we expected. #chart $DXY #Dollar

Per recent;
US Dollar over 50 MA on its way to 200 MA resistance on Weekly Chart. $DXY $UUP

Per recent;
Bull bear fight is on with dollar closing the week at the 50 MA. Watch that close. $DXY $UUP

Per recent;
If $DXY US Dollar Index builds structured base over main pivot (red line) it’s a long all day long. $UUP.
If $DXY -0.18% US Dollar Index -0.18% builds structured base over main pivot (red line) it’s a long all day long. $UUP.
WATCH the MACD for a turn down. Has it’s 200 MA (pink), but that’s not considerable relatively speaking right now.
Watch the pivot and watch the MACD on the daily. MACD turns down and it will be a retrace 99 in 100 times.

Per recent;
$DXY There it is, reach up and touch to 200 MA and a back off intra. MACD trending on Daily.

Dollar bulls keep an eye on 200 MA overhead on daily. $DXY #USD $UUP #chart #resistance

US Dollar News:
Trump’s trade war is undercutting his hopes for the dollar https://finance.yahoo.com/news/trumps-trade-war-undercutting-hopes-dollar-152345957.html?soc_src=social-sh&soc_trk=tw via @YahooFinance
Dollar falls vs yen as trade disputes intensify, yuan at 6-month lows
Dollar falls vs yen as trade disputes intensify, yuan at 6-month lows https://t.co/kSEM7pvFov
— $DXY US Dollar Algo (@dxyusd_index) June 26, 2018
Best with your trades and look forward to seeing you in the room!
$DXY US Dollar Algo
Article Topics: $DXY, Trading, USD, DXY, Dollar, Algorithm, $UUP, Chart
US Dollar Index (DXY) Algorithm Report Tues June 26. $DXY $UUP #USD #Algorithm
DXY US Dollar Algorithm Model Charting Report Tuesday June 26, 2018 $DXY $UUP
Welcome to my report for Compound Trading – $DXY the US Dollar algorithm charting model.
I am an early development model – one of seven in development at Compound Trading Group. This work is very early stage generation 1 work. Generation 2 – 5 is scheduled for 2018 and will eventually be coded to a digital dashboard for our traders to use as an intelligent assistant.
This charting is to be used in conjunction with conventional charting as trader assisted signals. The signals in the model (at this point) are simple that each line on the model chart are considered a support and resistance test.
Notices:
Feature Post with Charting: How to Trade the US Dollar Index Move (Part 1) $DXY $UUP #USD #trading #chart #algorithm
US Dollar Index (DXY) Algorithm. 30 Minute Chart Model $DXY $UUP
US Dollar Index (DXY). Under pressure from 200 MA on 30 Min Chart Model.June 26 321 AM $DXY $UUP #algorithm #chart

Per recent;
US Dollar Index (DXY). Trade under pressure from 200 MA on 30 Minute Chart Model. $DXY $UUP #algorithm #chart

Per recent;
$DXY US Dollar 30 Min Algorithmic Model Chart with buy sell triggers, trading quads, channel, MAs, price targets. $UUP May 23 1027 PM

Per recent;
$DXY US Dollar 30 Min Algorithmic Model Chart with buy sell triggers, trading quads, channel, MAs, price targets. $UUP May 13 339 PM
If this goes to a sell, the yellow are your prospective channel support and resistance for a down turn.
https://www.tradingview.com/chart/DXY/uL7Ifwwc-DXY-US-Dollar-30-Min-Algorithmic-Model-Chart-with-buy-sell-trig/

$DXY Geometric Daily Algorithm Chart Model
US Dollar Index (DXY) Algorithm. Structure in play. Trade in geometric structure (light blue). #algorithm $DXY #Chart

Per recent;
US Dollar Index (DXY). Geometric algorithm chart model magnified ith test structure. $DXY #Algorithm #Dollar

US Dollar Index (DXY). Algorithm structure in play on daily chart. Trade inside geometric structure (red). #algorithm $DXY #Chart

Per recent;
Below is the geometric model for the US Dollar. I’ve provided a close up image and a regular image with chart link.
The most important areas of trade structure are the red, orange, blue, yellow triangles.
The chart needs a significant reset, but for now we are watching the structure of the red triangle to see how it concludes.
Close up of Geometric Algorithmic Model for US Dollar Index $DXY.

https://www.tradingview.com/chart/DXY/GD3huNnE-DXY-Geometric-Model/

Per recent;
May 13 – Big test with the dollar here. Visually intense on the geometric US Dollar model. $UUP $DXY
Use link below from last report to view real time chart.

Per recent;
US Dollar $DXY touched 200 MA on daily and backed off. Geometric model charting.

Conventional Charting Considerations:
June 25 – No significant structural change to Weekly chart – refer to previous report link below.
Per recent;
US Dollar Index (DXY) Chart. Trade came under pressure at 200 MA on weekly chart as we expected. #chart $DXY #Dollar

Per recent;
US Dollar over 50 MA on its way to 200 MA resistance on Weekly Chart. $DXY $UUP

Per recent;
Bull bear fight is on with dollar closing the week at the 50 MA. Watch that close. $DXY $UUP

Per recent;
If $DXY US Dollar Index builds structured base over main pivot (red line) it’s a long all day long. $UUP.
If $DXY -0.18% US Dollar Index -0.18% builds structured base over main pivot (red line) it’s a long all day long. $UUP.
WATCH the MACD for a turn down. Has it’s 200 MA (pink), but that’s not considerable relatively speaking right now.
Watch the pivot and watch the MACD on the daily. MACD turns down and it will be a retrace 99 in 100 times.

Per recent;
$DXY There it is, reach up and touch to 200 MA and a back off intra. MACD trending on Daily.

Dollar bulls keep an eye on 200 MA overhead on daily. $DXY #USD $UUP #chart #resistance

US Dollar News:
Dollar falls vs yen as trade disputes intensify, yuan at 6-month lows
Dollar falls vs yen as trade disputes intensify, yuan at 6-month lows https://t.co/kSEM7pvFov
— $DXY US Dollar Algo (@dxyusd_index) June 26, 2018
Best with your trades and look forward to seeing you in the room!
$DXY US Dollar Algo
Article Topics: $DXY, Trading, USD, DXY, Dollar, Algorithm, $UUP, Chart
US Dollar Index (DXY) Algorithm Report Tues June 5. $DXY $UUP #USD #Algorithm
DXY US Dollar Algorithm Model Charting Report Tuesday June 5, 2018 $DXY $UUP
Welcome to my report for Compound Trading – $DXY the US Dollar algorithm charting model.
I am an early development model – one of seven in development at Compound Trading Group. This work is very early stage generation 1 work. Generation 2 – 5 is scheduled for 2018 and will eventually be coded to a digital dashboard for our traders to use as an intelligent assistant.
This charting is to be used in conjunction with conventional charting as trader assisted signals. The signals in the model (at this point) are simple that each line on the model chart are considered a support and resistance test.
Notices:
Feature Post with Charting: How to Trade the US Dollar Index Move (Part 1) $DXY $UUP #USD #trading #chart #algorithm
US Dollar Index (DXY) Algorithm. 30 Minute Chart Model $DXY $UUP
US Dollar Index (DXY). Trade under pressure from 200 MA on 30 Minute Chart Model. $DXY $UUP #algorithm #chart

Per recent;
$DXY US Dollar 30 Min Algorithmic Model Chart with buy sell triggers, trading quads, channel, MAs, price targets. $UUP May 23 1027 PM

Per recent;
$DXY US Dollar 30 Min Algorithmic Model Chart with buy sell triggers, trading quads, channel, MAs, price targets. $UUP May 13 339 PM
If this goes to a sell, the yellow are your prospective channel support and resistance for a down turn.
https://www.tradingview.com/chart/DXY/uL7Ifwwc-DXY-US-Dollar-30-Min-Algorithmic-Model-Chart-with-buy-sell-trig/

Per recent;
$DXY US Dollar 30 Min Algorithmic Model Chart with buy sell triggers, trading quads, channel, MAs, price targets. $UUP Apr 30 352 AM

$DXY Geometric Daily Algorithm Chart Model
US Dollar Index (DXY). Geometric algorithm chart model magnified ith test structure. $DXY #Algorithm #Dollar

US Dollar Index (DXY). Algorithm structure in play on daily chart. Trade inside geometric structure (red). #algorithm $DXY #Chart

Per recent;
Below is the geometric model for the US Dollar. I’ve provided a close up image and a regular image with chart link.
The most important areas of trade structure are the red, orange, blue, yellow triangles.
The chart needs a significant reset, but for now we are watching the structure of the red triangle to see how it concludes.
Close up of Geometric Algorithmic Model for US Dollar Index $DXY.

https://www.tradingview.com/chart/DXY/GD3huNnE-DXY-Geometric-Model/

Per recent;
May 13 – Big test with the dollar here. Visually intense on the geometric US Dollar model. $UUP $DXY
Use link below from last report to view real time chart.

Per recent;
US Dollar $DXY touched 200 MA on daily and backed off. Geometric model charting.

Conventional Charting Considerations:
US Dollar Index (DXY) Chart. Trade came under pressure at 200 MA on weekly chart as we expected. #chart $DXY #Dollar

Per recent;
US Dollar over 50 MA on its way to 200 MA resistance on Weekly Chart. $DXY $UUP

Per recent;
Bull bear fight is on with dollar closing the week at the 50 MA. Watch that close. $DXY $UUP

Per recent;
If $DXY US Dollar Index builds structured base over main pivot (red line) it’s a long all day long. $UUP.
If $DXY -0.18% US Dollar Index -0.18% builds structured base over main pivot (red line) it’s a long all day long. $UUP.
WATCH the MACD for a turn down. Has it’s 200 MA (pink), but that’s not considerable relatively speaking right now.
Watch the pivot and watch the MACD on the daily. MACD turns down and it will be a retrace 99 in 100 times.

Per recent;
$DXY There it is, reach up and touch to 200 MA and a back off intra. MACD trending on Daily.

Dollar bulls keep an eye on 200 MA overhead on daily. $DXY #USD $UUP #chart #resistance

Best with your trades and look forward to seeing you in the room!
$DXY US Dollar Algo
Article Topics: $DXY, Trading, USD, DXY, Dollar, Chart, Algorithm, $UUP
Trading US Dollar Index (Part 2 – Member Exclusive) $DXY $UUP #USD #SwingTrading #Daytrading
Specific Levels to Trade US Dollar Index (Swing Trading and Day Trading). $DXY $UUP
From Part 1 below is the webinar video in case you missed it:
Video: How to Trade US Dollar Webinar:
Click here for a direct link to the How to Trade US Dollar Index $DXY Video.
Swing Trading Levels for US Dollar $DXY
US Dollar Index Weekly chart 200 MA resistance is long side swing trade trim area. $DXY $UUP #USD
Currently the 200 MA is at 94.84 and the dollar is trading at 94.33 so it isn’t far off. Careful on long side swings in to that resistance point on the chart.
The 50 MA and the pivot (red horizontal line) are support areas in a wash-out.
https://www.tradingview.com/chart/DXY/sAFAfThC-US-Dollar-Index-Weekly-chart-200-MA-resistance-is-long-side-swin/

US Dollar Index Algorithm chart support and resistance points on charting. $DXY $UUP #USD
The US Dollar in this uptrending move has followed the trend line on the algorithm charting and has now hit three target areas.
It is currently trading at 94.33 with target area hit in earlier trade around 94.40.
The next resistance above is the diagonal trendline (white dotted) at just over 95.00 intra-day.
The next resistance above that is the horizontal purple line (historical resistance) at approximately 95.72.
And the next resistance over that is the top of the next trading range (the blue triangle) The upper blue triangle downtrending line is a resistance line (as are all others like this one).
Then above those are the next triangle tops at approximately 97.50 and 100.50 and other lines on the charting in between.
It is important to note that the diagonal uptrending dotted white lines act as significant support in a retracement after the price has hit the apex area of a triangle structure (which is occurring now – top of red triangle structure). Price may not retrace here as it is a smaller less important triangular structure in the model but it is important to note just in case the US Dollar retraces here.

Historical example from 2017 of how price can use diagonal trendline as support. US Dollar Index Algorithm. $DXY $UUP #USD
Below is a chart from 2017 that shows trade bouncing off the diagonal trendline I described in the previous chart.

Day Trading Levels for US Dollar $DXY
When daytrading the US Dollar use the weekly chart above as your important pivots (keep them in mind). Also use the geometric charting of the algorithm. Every line is a potential support and resistance. Be well aware of where each line is.
Then use simple charting per below for entries and exits on your trades:
The 200 MA on hourly $DXY chart is a very high probability long signal. #daytrading #USDollar

On the 5 min or 15 min trimming long positions should be at each MA lost. #daytrading
Understanding how to use your moving averages to trim long positions is an important mechanism as a daytrader and makes trades really simple. Depending on your comfortable time-frame, you can long above the 200 MA on a wider time-frame like the 60 or 30 min and trim longs on the 1 min, 5 min or 15 min as price loses each MA. In the example below the chart shows the 20 MA, 50 MA, 100 MA and 200 MA.
And then be sure you are watching the levels on the geometric algorithm charting and the other algorithm charting included in reports.

Connect:
Register to free email list for trade set-ups, webinars, special events: https://compoundtrading.com/contact/
Subscribe to our Weekly $DXY US Dollar Index Newsletter Here
Website: https://compoundtrading.com
Blog: https://compoundtrading.com/blog/
Free chat room: https://discord.gg/2HRTk6n
Subscribe: https://compoundtrading.com/overview-…
Twitter: https://twitter.com/CompoundTrading
Lead Trader: https://twitter.com/curtmelonopoly
Tradingview: https://www.tradingview.com/u/curtmel…
Facebook: https://www.facebook.com/compoundtrad…
StockTwits: https://stocktwits.com/compoundtrading
Email: https://info@compoundtrading.com
Curtis Melonopoly (@curtmelonopoly) is rated Top 250 Stock exchanges authority, covering also Mathematical finance and Economy of the United States.
Compound Trading Platform: Algorithm model charting for $SPY, $VIX, #OIL, #GOLD, #SILVER, #Crypto ($BTC Bitcoin, $ETH, $LTC, $XRP,) $DXY US Dollar and Swing Trading Newsletter. Live trading rooms for daytrading and oil traders. Private coaching and live alerts.
US Dollar $DXY Algorithm Model Chart Update Wed May 23 $UUP
$DXY US Dollar Algorithmic Model Chart Update/ Observations Wednesday May 23, 2018 $UUP
Welcome to my report for Compound Trading – $DXY the US Dollar algorithm charting model.
I am an early development model – one of seven in development at Compound Trading. This work is very early stage generation 1 work. Generation 2 – 5 is scheduled for 2018 and will eventually be coded to a digital dashboard for our traders to use as an intelligent assistant.
This charting is to be used in conjunction with conventional charting as trader assisted signals. The signals in the model (at this point) are simple that each line on the model chart are considered a support and resistance test.
Notices:
Feature Post with Charting: How to Trade the US Dollar Index Move (Part 1) $DXY $UUP #USD #trading #chart #algorithm
$DXY US Dollar Algorithm Charting Model $UUP
$DXY US Dollar 30 Min Algorithmic Model Chart with buy sell triggers, trading quads, channel, MAs, price targets. $UUP May 23 1027 PM

Per recent;
$DXY US Dollar 30 Min Algorithmic Model Chart with buy sell triggers, trading quads, channel, MAs, price targets. $UUP May 13 339 PM
If this goes to a sell, the yellow are your prospective channel support and resistance for a down turn.
https://www.tradingview.com/chart/DXY/uL7Ifwwc-DXY-US-Dollar-30-Min-Algorithmic-Model-Chart-with-buy-sell-trig/

Per recent;
$DXY US Dollar 30 Min Algorithmic Model Chart with buy sell triggers, trading quads, channel, MAs, price targets. $UUP Apr 30 352 AM

Per recent;
$DXY US Dollar 30 Min Algorithmic Model Chart with buy sell triggers, trading quads, channel, MAs, price targets. $UUP Apr 24 306 AM

$DXY Geometric Daily Chart Model
Below is the geometric model for the US Dollar. I’ve provided a close up image and a regular image with chart link.
The most important areas of trade structure are the red, orange, blue, yellow triangles.
The chart needs a significant reset, but for now we are watching the structure of the red triangle to see how it concludes.
Close up of Geometric Algorithmic Model for US Dollar Index $DXY.

https://www.tradingview.com/chart/DXY/GD3huNnE-DXY-Geometric-Model/

Per recent;
May 13 – Big test with the dollar here. Visually intense on the geometric US Dollar model. $UUP $DXY
Use link below from last report to view real time chart.

Per recent;
US Dollar $DXY touched 200 MA on daily and backed off. Geometric model charting.

Conventional Charting Considerations:
US Dollar over 50 MA on its way to 200 MA resistance on Weekly Chart. $DXY $UUP

Per recent;
Bull bear fight is on with dollar closing the week at the 50 MA. Watch that close. $DXY $UUP

Per recent;
If $DXY US Dollar Index builds structured base over main pivot (red line) it’s a long all day long. $UUP.
If $DXY -0.18% US Dollar Index -0.18% builds structured base over main pivot (red line) it’s a long all day long. $UUP.
WATCH the MACD for a turn down. Has it’s 200 MA (pink), but that’s not considerable relatively speaking right now.
Watch the pivot and watch the MACD on the daily. MACD turns down and it will be a retrace 99 in 100 times.

Per recent;
$DXY There it is, reach up and touch to 200 MA and a back off intra. MACD trending on Daily.

Dollar bulls keep an eye on 200 MA overhead on daily. $DXY #USD $UUP #chart #resistance

Per recent;
April 9 – $DXY Daily chart range trade stuck with MACD indecisive. $UUP
https://www.tradingview.com/chart/DXY/bgTJqSqy-DXY-range-trade-stuck-with-MACD-indecisive-UUP/

Best with your trades and look forward to seeing you in the room!
$DXY US Dollar Algo
Article Topics: $DXY, Trading, USD, Dollar, Chart, Algorithm, $UUP
Feature Post with Charting: How to Trade the US Dollar Index Move (Part 1) $DXY $UUP #USD #trading #chart #algorithm
Webinar Recorded Sunday May 20, 2018: How to Swing Trade the US Dollar Index Move $DXY $UUP
Feature post includes video, charting and summary of the webinar.
Video of How to Trade US Dollar Webinar:
Click here for a direct link to the How to Trade US Dollar Index $DXY Video.
Summary of Video:
When the dollar lost the 200 MA on daily it dumped in to Feb of the year and went sideways.
We sat quiet through the sideways period since because it was divergent to our algorithmic model.
As price started to get closer to 200 MA from underside again and MACD turned we started to alert clients and share some alerts on social media.
There is a pivot at 92.61 area on the daily chart where the set-up triggered a long side trade for us.
If trade loses that pivot all bets are off long side bias. Not stated on the video.
On the geometric charting (broad structure) there are some key areas of trade to watch for;
The video explains the chart structure to watch for.
The primary trendline to watch in the structure is shown on the video.
Important resistance 94.38 in 8 days 28th of May, 97.78 July 10, 100.5 – 100.76 Aug 20 (primary resistance), trading 93.78 intra,
Intraday on the hourly over 200 MA is a long and to trim I move to 15 min chart and when price loses the 20 MA, 50, 100, 200 MA I move out and wait for price to gain the 200 MA again on the hourly and I scale long again.
There is a part two to this video in progress, for a copy register to our mailing list.
Close up image of US dollar Index $DXY algorithmic chart shown in webinar video. #HowtoTrade #USD #Dollar #Algorithm

US Dollar Index Daily Chart MACD flat, price above main pivot (red line) over 200 MA. $DXY $UUP

Connect:
Register to free email list for trade set-ups, webinars, special events: https://compoundtrading.com/contact/
Subscribe to our Weekly $DXY US Dollar Index Newsletter Here
Website: https://compoundtrading.com
Blog: https://compoundtrading.com/blog/
Free chat room: https://discord.gg/2HRTk6n
Subscribe: https://compoundtrading.com/overview-…
Twitter: https://twitter.com/CompoundTrading
Lead Trader: https://twitter.com/curtmelonopoly
Tradingview: https://www.tradingview.com/u/curtmel…
Facebook: https://www.facebook.com/compoundtrad…
StockTwits: https://stocktwits.com/compoundtrading
Email: https://info@compoundtrading.com
Curtis Melonopoly (@curtmelonopoly) is rated Top 250 Stock exchanges authority, covering also Mathematical finance and Economy of the United States.
Compound Trading Platform: Algorithm model charting for $SPY, $VIX, #OIL, #GOLD, #SILVER, #Crypto ($BTC Bitcoin, $ETH, $LTC, $XRP,) $DXY US Dollar and Swing Trading Newsletter. Live trading rooms for daytrading and oil traders. Private coaching and live alerts.
