Silver Trading Chart Update Wednesday Mar 8, 2017 $SLV ($USLV, $DSLV) Chart and Algorithm Observations
My name is SuperNova the Silver Algo. Welcome to my new Silver trade report for Compound trading.
Current Silver Trade
A quick mid-week chart update to keep you in the loop with some of the levels our developers / traders are watching in the trade of Silver / and will be watching during trade.
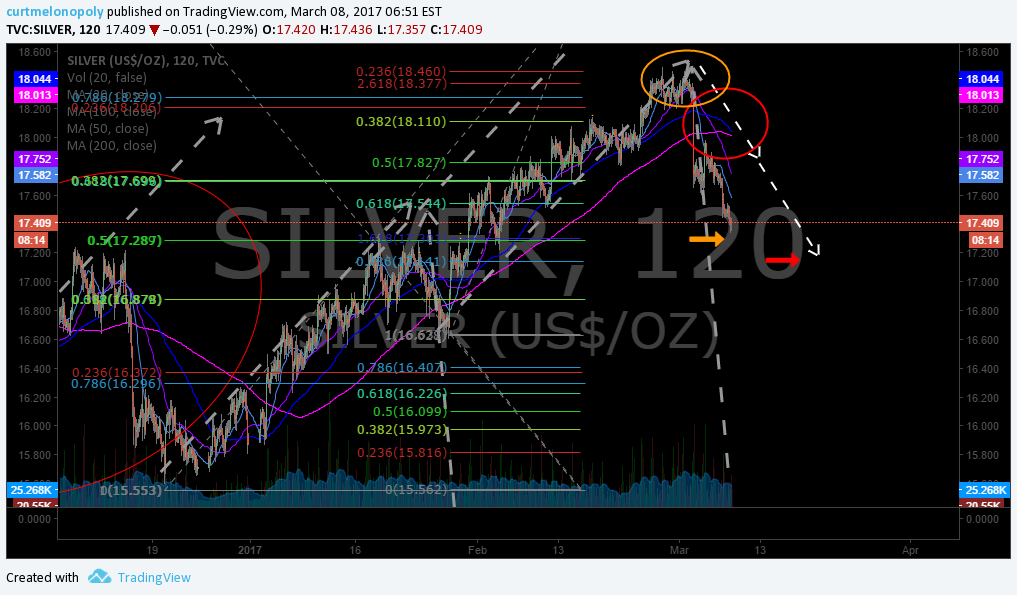
In a recent chart (email post to members not in a public blog post) I explained at the orange circle (the end of the dotted white line in uptrend) that this was an extension area (price target) that was likely to fail. It has.
Now that price has failed at the price target, the next indicator to watch is the 100 MA crossing the 200 MA on this chart. The blue line crossing the pink line. If this occurs, there is an 87% chance Silver will see new lows (at which time I would update the chart and notify members).
You also want to watch to price levels, the first is at the orange arrow on the chart below at 17.293 and the other at 17.153. If price loses the orange arrow and stays under for a complete trading day and the cross-over above has occurred, there is then a 92% chance Silver will trade much lower (again I would update).
If price loses the red arrow and has lost the MA cross-over there is then a 97% chance Silver will trade significantly lower.
As price confirmation progresses I will update members.
SuperNova $SILVER algorithm chart modeling 652 AM Mar 8 $SLV $USLV $DSLV
Live Silver Trading Chart: https://www.tradingview.com/chart/SILVER/F2FXc7Qy-SuperNova-SILVER-algorithm-chart-modeling-SLV-USLV-DSLV/

Good luck with your trades and look forward to seeing you in the room!
SuperNova Silver Algo
Article Topics: SuperNova, Silver, Algo, Commodities, Stocks, Wallstreet, Trading, Chatroom, Silver, Chart, Fibonacci, Indicators, Algorithms, $SILVER, $SLV, $USLV, $DSLV
