Volatility $VIX Charting / Algorithm Observations Report Thursday May 24, 2018 $TVIX, $UVXY, $VXX
Good day! My name is Vexatious $VIX the Algo. Welcome to my new $VIX algorithmic modeling charting trade report for Compound Trading.
Volatility Charting Observations:
$VIX 60 min quads with buy sell triggers. . $TVIX $UVXY May 24 513 PM

Buy sell swing trading triggers for $VIX:
23.2
22.4
21.6
20.8
20.1
19.3
18.5
17.7
16.9
16.1
15.3
14.5
13.7
12.9
12.1
11.4
10.6
9.8
9.0
Per recent’
$VIX 60 min quads with buy sell triggers. . $TVIX $UVXY Apr 30 332 AM

$VIX Volatility Index Conventional Charting
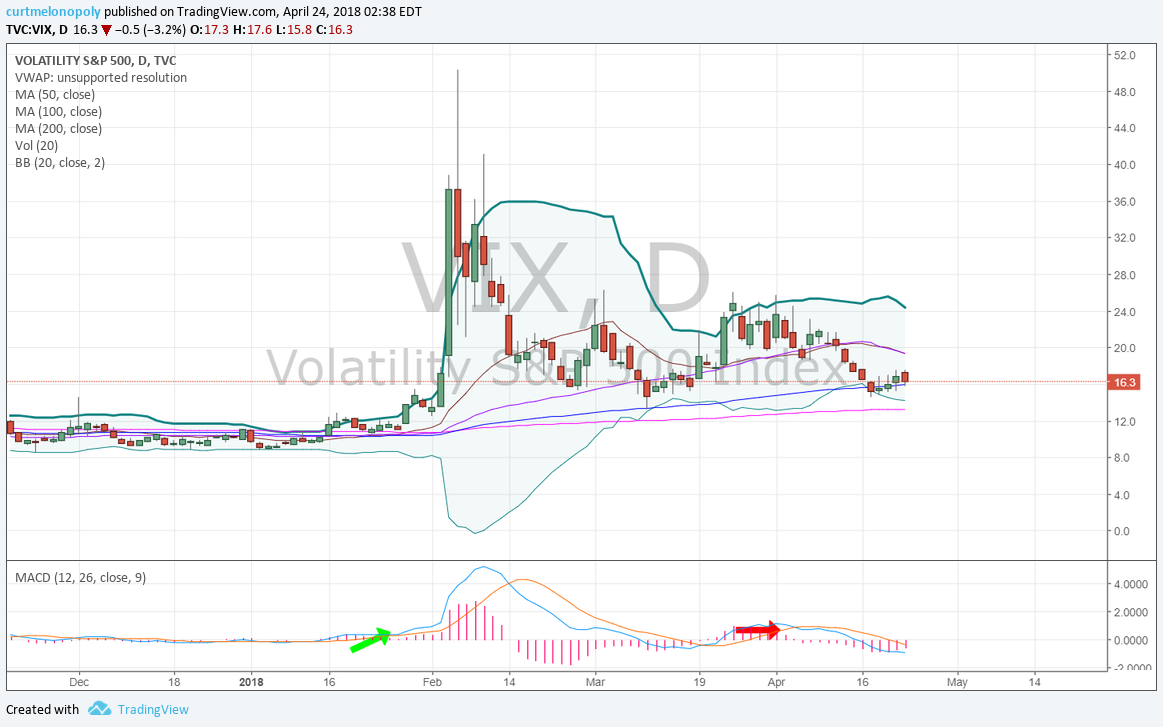
$VIX MACD on daily chart flat – limited short side opportunity left. Bottom range of Bollinger.
https://www.tradingview.com/chart/VIX/YxKSP12r-VIX-MACD-on-daily-chart-flat-limited-short-side-opportunity-l/

Per recent;
$VIX under moving averages on Daily Chart and under lower bollinger. Long bias RR setting in.

$VIX trading above 200 MA on trend with MACD completely flat and absent.

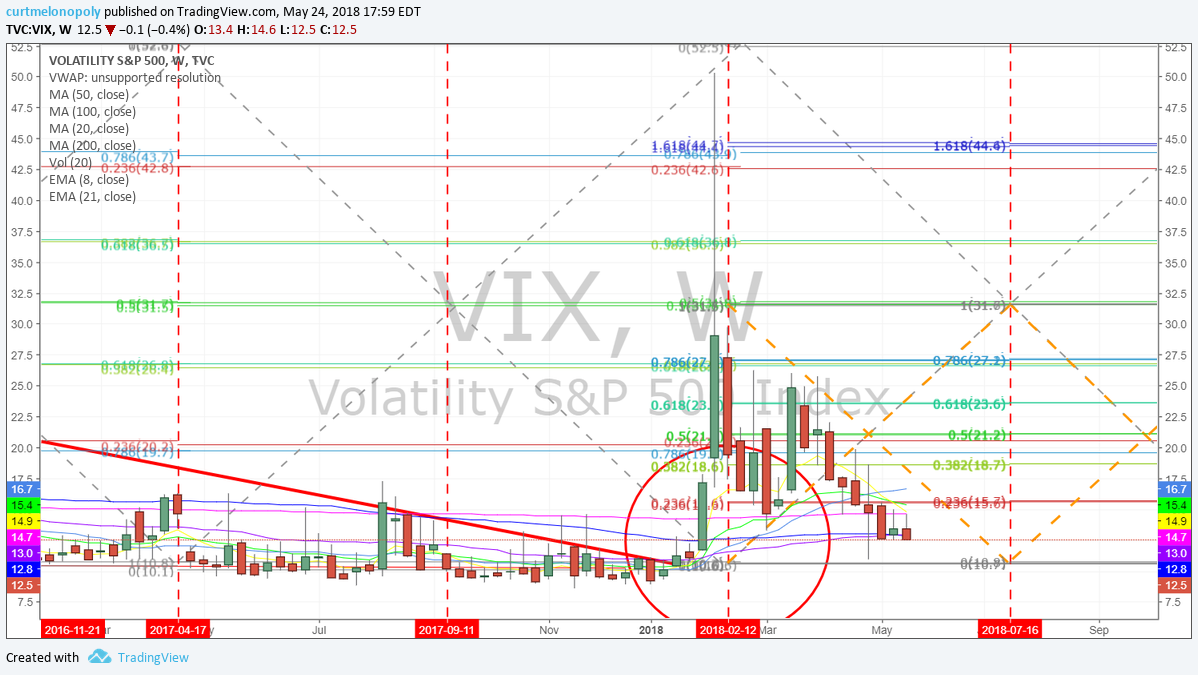
$VIX Weekly Chart
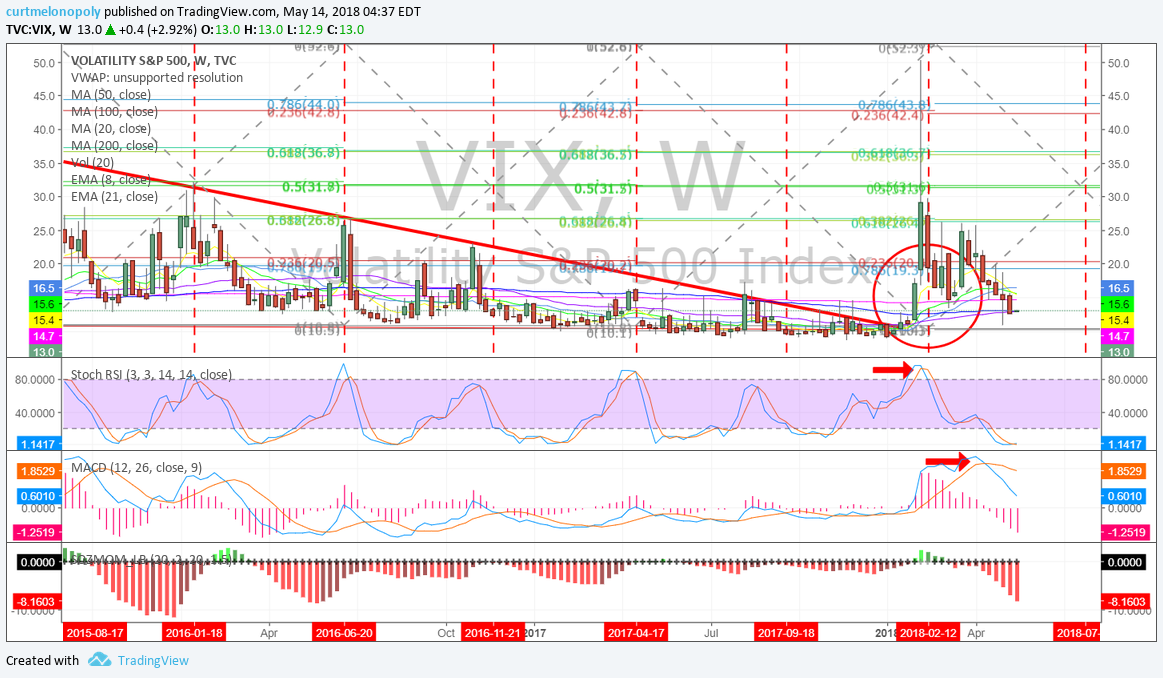
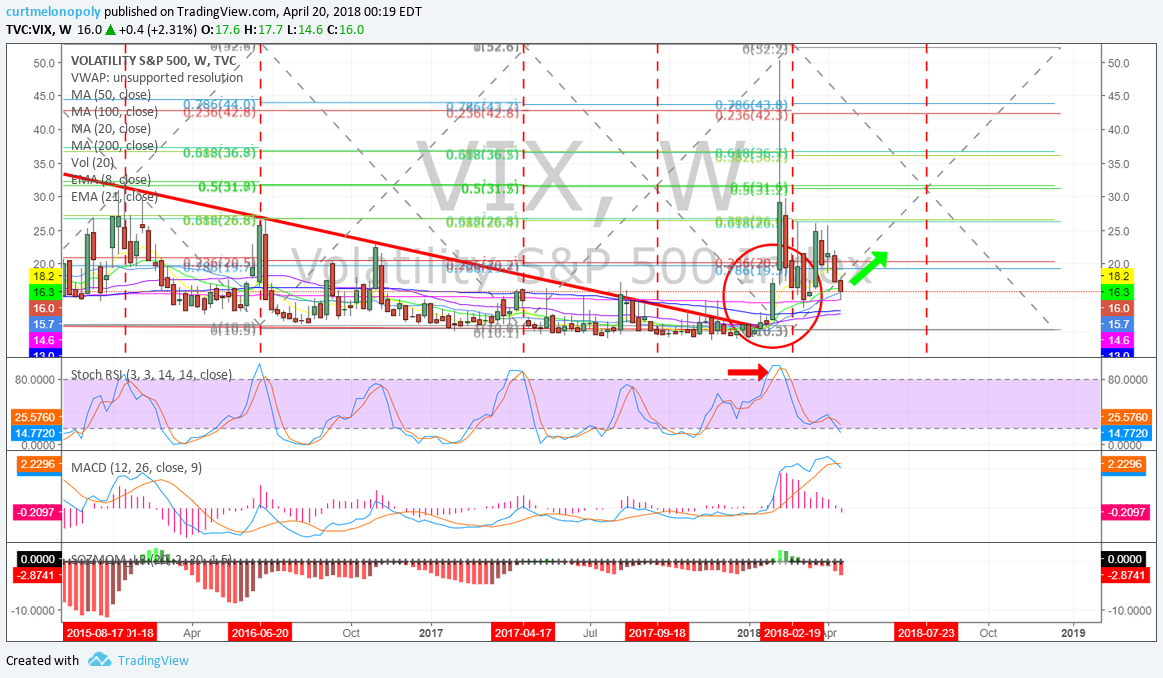
Simple symmetrical time cycle on weekly, Volatility reversal leading in to July 14 – 23 ish probable. $VIX $UVXY $TVIX

Simple symmetrical time cycle on weekly chart, Volatility reversal leading in to July 23 ish is probable. $VIX $UVXY $TVIX #volatility #trading

Per recent;
$VIX weekly chart has MACD trending down and structure broke.

Per recent;
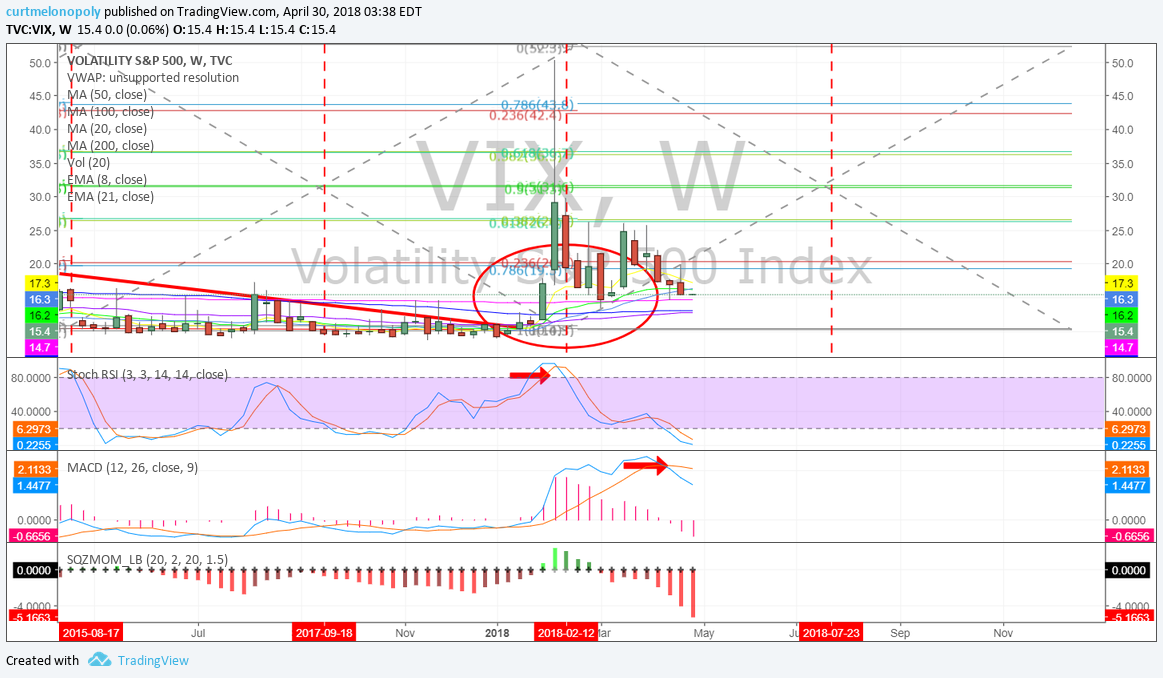
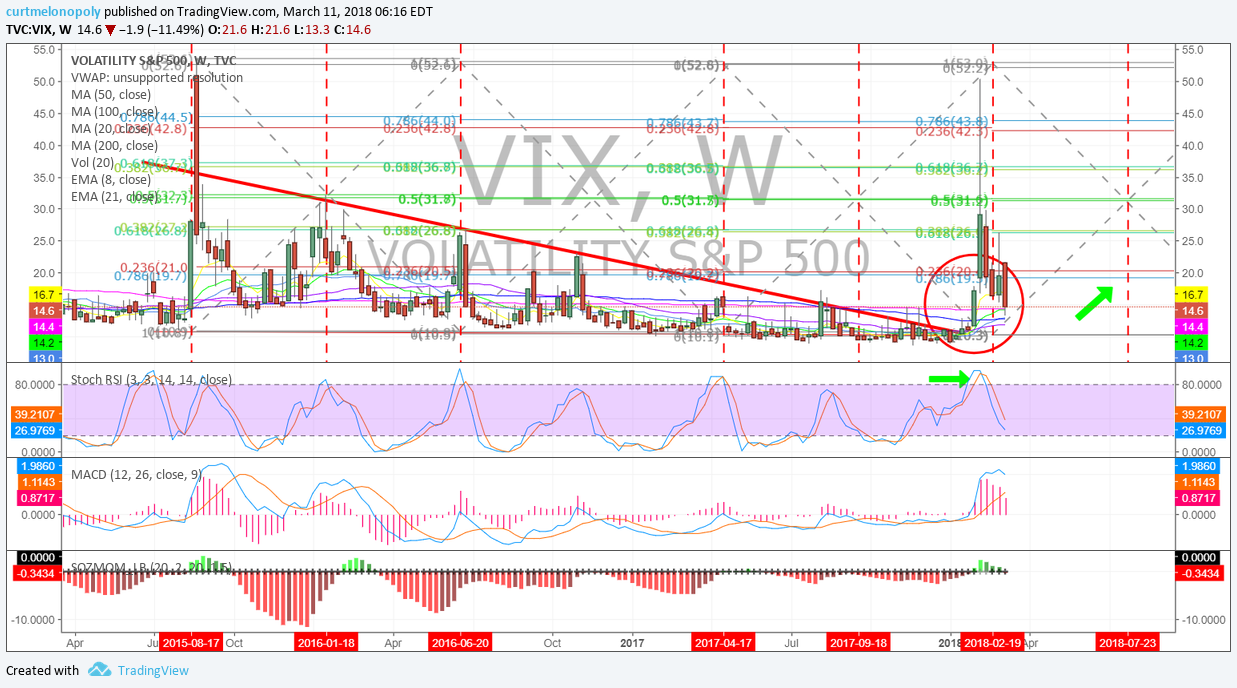
$VIX structure on the last bullish move is now all but gone. Likely continued decline.

Per recent;
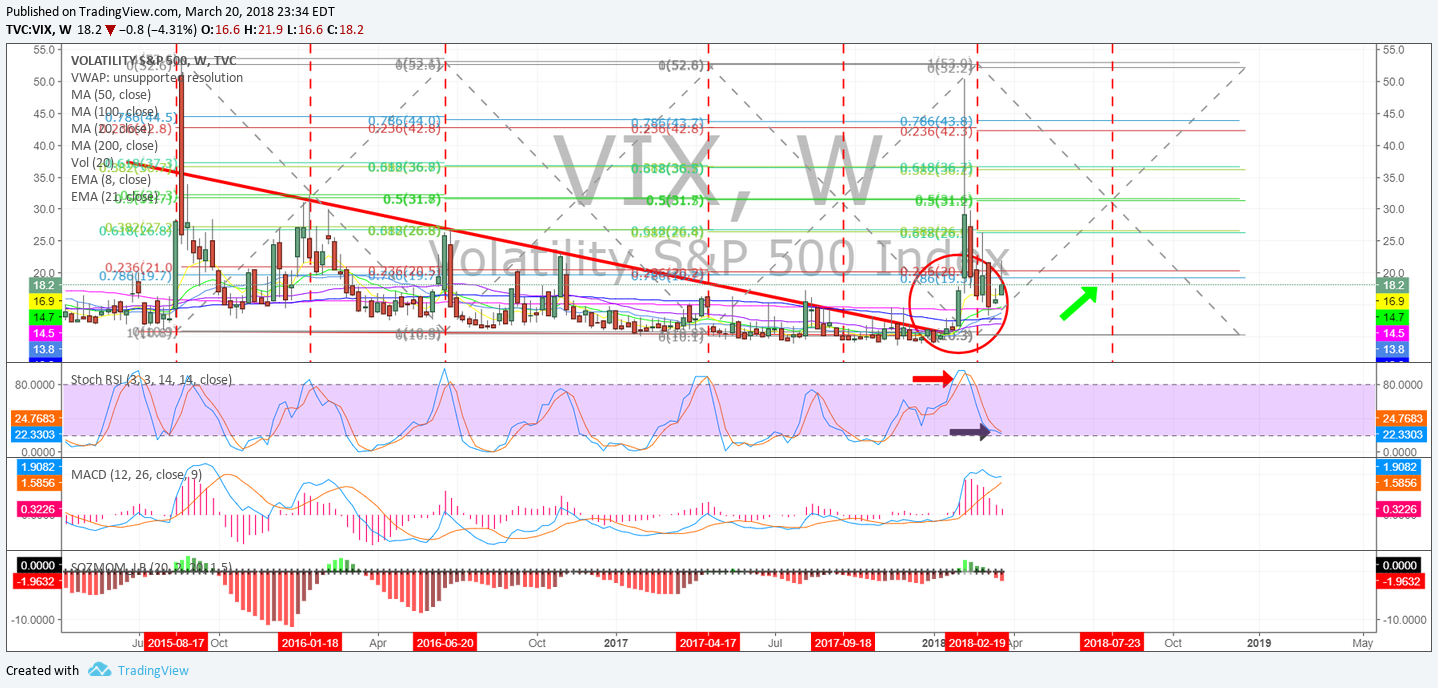
$VIX losing structure for bull move. MACD about to cross down.

Per previous;
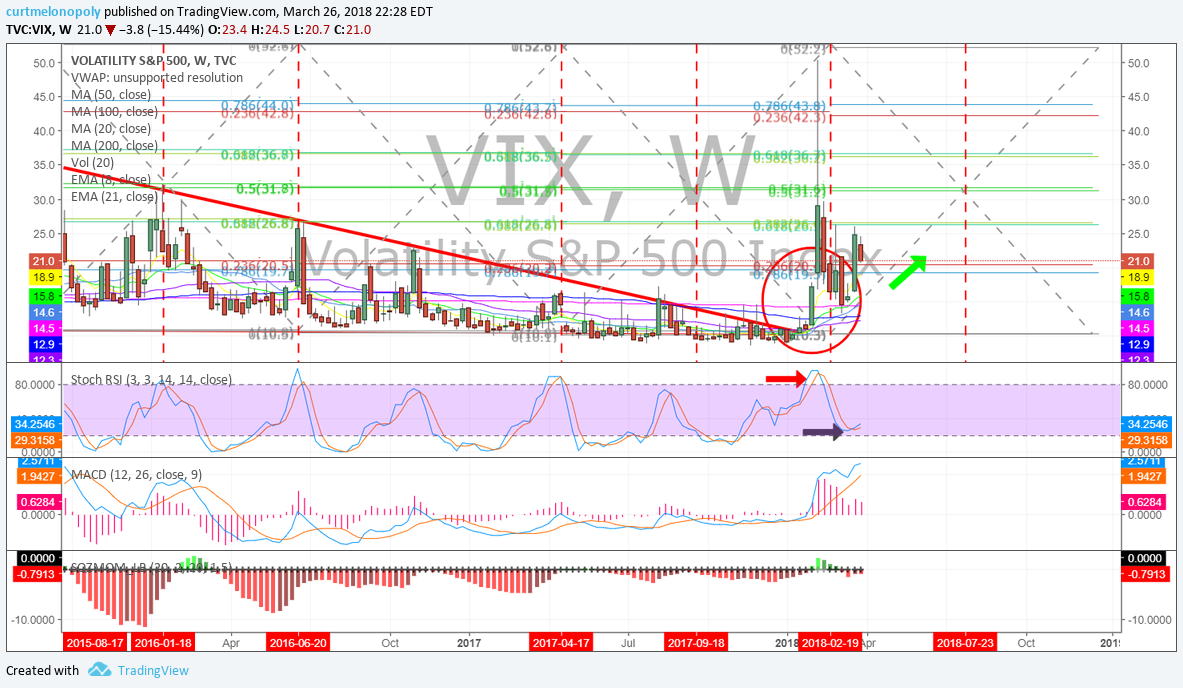
$VIX Weekly chart structure in place yet but MACD nearing top. #volatility #chart

Per recent;
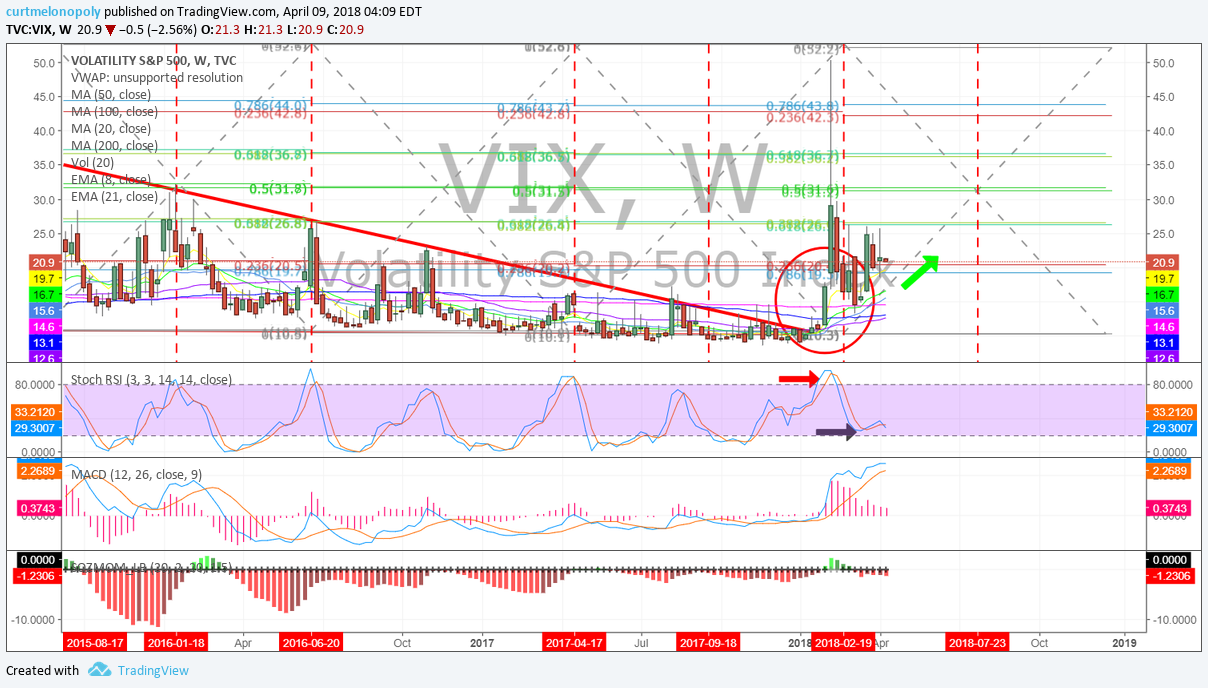
$VIX Weekly chart model provides bullish outlook also.
https://www.tradingview.com/chart/VIX/CbShhY1p-VIX-Weekly-chart-model-provides-bullish-outlook-also/

Good luck with your trades and look forward to seeing you in the room!
Vexatious the $VIX Algo
Article Topics: Vexatious, $VIX, Algo, Volatility, Stocks, Trading, Algorithms, $TVIX, $UVXY, $VXX