Welcome to the Compound Trading Swing Trading Report (1 of 5) Sunday Nov 12, 2017. $FSLR, $CELG, $HIIQ, $GOOGL, $AMZN, $AMBA, $SLCA, $AAOI and more …
Email us at [email protected] anytime with any questions about any of the swing trades listed below. Or, if we get bogged down private message Curtis in trade room or direct message him on Twitter. Market hours are tough but we endeavor to get back to everyone after market each day.
Notices:
This swing trading report is one in five we have in rotation.
We are going to categorize our coverage soon because we are following more than we expected when we first started the service..
When managing your trades with the weekly reports keep in mind that you will have to invest an hour or two a week to check the indicators mentioned for buy and sell triggers. I was asked recently why we do not usually (although we do sometimes) include precise entry and exit points. The reason is simple, they don’t work – those services have terrible results.
Swing trading success, even with a service, does require “some” maintenance on the part of the user, although the new live alert service will take much of that burden off the user as we know many of our users have busy lives. It is the indicators lining up that signal a trade long entry or an exit. In our case rely heavily on MACD on daily or weekly (or Stoch RSI and Moving averages) but indicators we are basing our trade entry and exits on are listed with each trade so any user that does even moderate trade management will know when the indicator(s) have turn with or against the trade.
Intra-week you can always DM myself on Twitter or email with specific questions regarding trades you are considering for assistance. But it is critical that you attend to the maintenance of your signals at least once a week if not twice and set stops and preferably alarms so that intra-week you can enter or exit. If nothing else you can always book some coaching time and I’ll assist also (although we are at a point of waiting list for the coaching, at minimum you can get on list or for immediate help as I said please DM or email).
IF WE DON’T GET BACK TO YOU RIGHT AWAY it is usually because we are pressured with deadlines or are trading.
Also, as live charts are made available below, click on link and open viewer. Then to use chart yourself click on share button at bottom right (near thumbs up) and then click “make it mine”.
Newer updates below in red for ease.
Recent Compound Trading Videos for Swing Traders / Charting Set-Ups:
Visit our You Tube channel for other recent videos.
BEST Trade Set-ups in a while! Nov 10 (starts 4:42): OIL, GOLD, $VIX, $VRX, $ROKU, $AAOI, $HTZ …
Wed Nov 8 Trade Set-Ups Review: $SPI, $BTC, $VRX, $AAOI, $KBSF, $LEU, $ONCS, $DEPO, $SNAP…
Nov 7 Trade Set-Ups Review: $DVN, $GOOGL, $TSLA, $HMNY, $VRX, $AAOI, $MYO, $TOPS, $BTC…
Nov 6 Trade Set-Ups Review: GOLD, $GLD, $HMNY, $RCL, $BTC, $WTI, $USOIL, $FB, $TOPS, $SPPI, $BAS…
Nov 2 Trade Set-Ups Review: $TSLA, $USOIL, $GPRO, $DRNA, $GSIT, $W …
Nov 1 Trade Set-Ups Review: $MDXG, $OSTK, OIL, $WTI, $AMBA, $TRIL, $AAOI, $UAA, $LBIX, $DWT…
Oct 31 SwingTrade Set-Ups Review: $UAA, $TAN, $SPPI, $SHOP, $SNGX, $AKS, $HMNU, OIL, $BTC, $VRX…
Email us at [email protected] anytime with any questions about any of the swing trades listed below. Or, if we get bogged down private message Curtis in trade room or direct message him on Twitter. Market hours are tough but we endeavor to get back to everyone after market each day.
Profit and Loss Statements:
Q# P/L will be published soon.
Q2 2017 Swing Trading Results are available here: P/L Realized Gains: $99,452.00 Percentage Portfolio Gain 105.74% (~35% per month).
https://twitter.com/CompoundTrading/status/896897288798392320
July 2017 Trading Challenge P/L Report $NFLX, $XIV, $AAOI, $AKCA, $BWA, $SRG, $MCRB, $UGLD, $IPXL, $HIIQ and more
https://twitter.com/CompoundTrading/status/895889454212108289
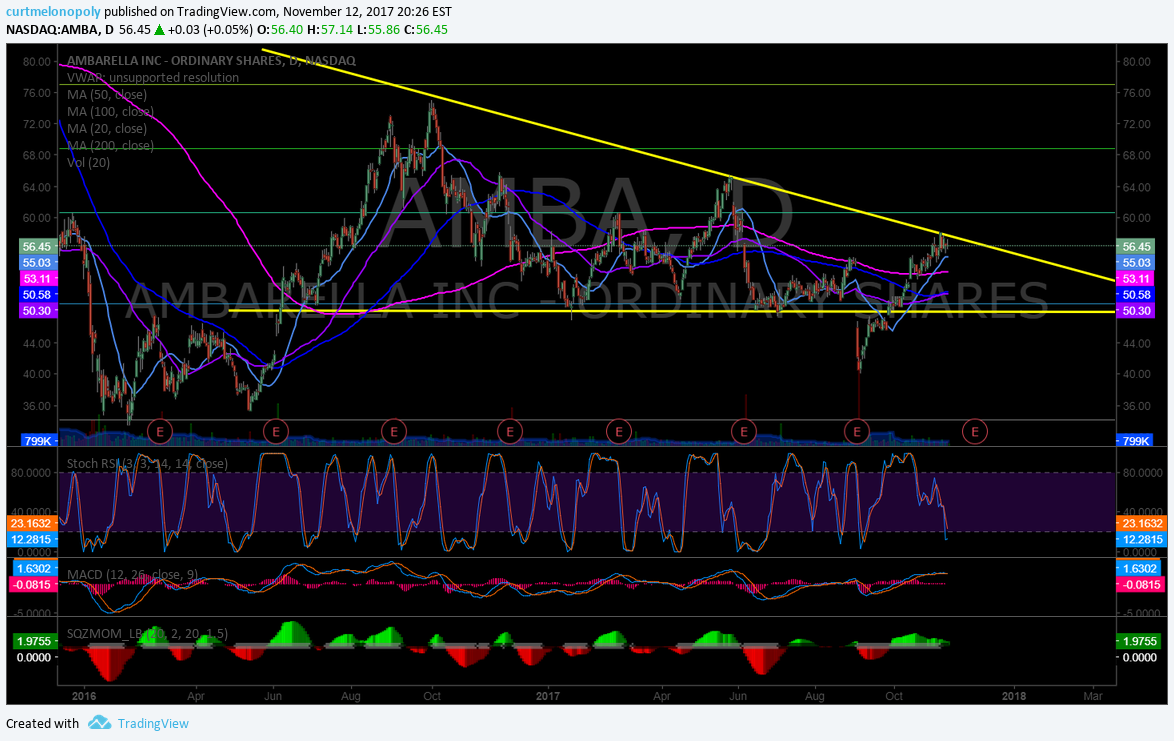
$AMBA – Ambarella Inc.
Nov 12 – On high watch here now. $AMBA could rip in to earnings – Stoch RSI close to bottom with a break above sees 61.00 fast 65.00 possible. #swingtrading

Sept 18 – Trading 46.40 with indicators under pressure.
Aug 9 – Trading 52.01 well under 200 MA with indecisive indicators. Watching.
July 25 – Trading 50.09. Watching.
$COTY
Nov 12 – Trading 16.31 tested 200 MA from underside and was rejected. Will wait.
Sept 18 – Trading 16.18 with indicators under pressure.
Aug 9 – Trading 19.90 over 200 MA and we are looking for a bounce at an MA on pull back and assessment of indicators at that time. Watching.
July 25 – Trading 19.18 and testing 200 MA right now. On High watch here. ER in 21 days.
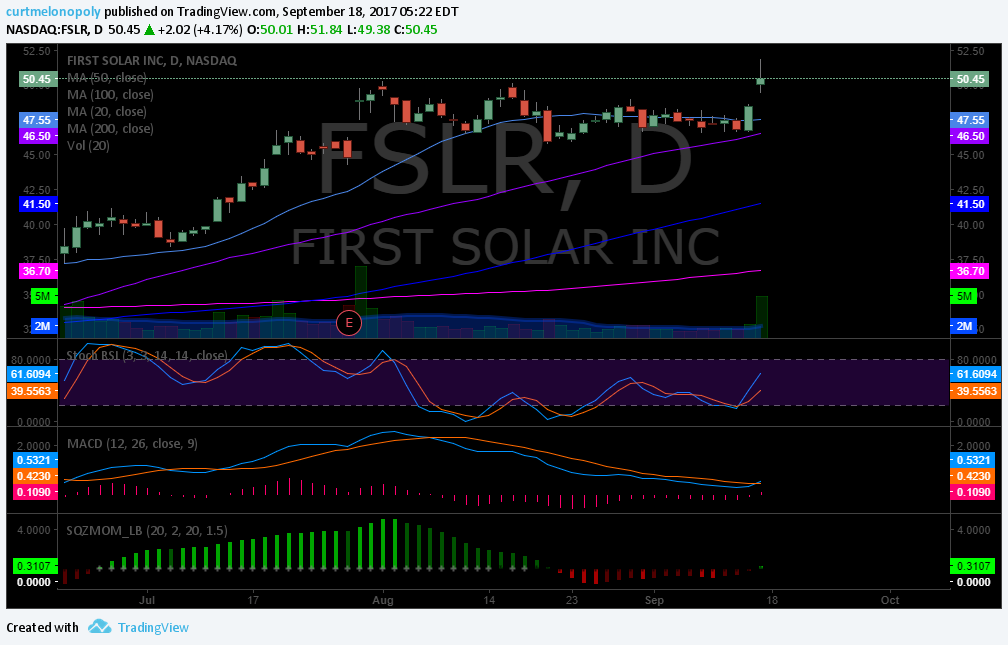
$FSLR – First Solar
Nov 12 – Trading 61.59 – congrats to the traders in our group that got this trade. I did not, but wow, what a trade. Now it is way above MA’s on the daily so I have an alarm set to view a possible bounce when it returns to the 20 MA.
Sept 18 – $FSLR Daily popped above recent highs with MACD turn up and SQZMOM STOCH RSI #swingtrading On High Alert Now.
https://www.tradingview.com/chart/FSLR/wJH4XW4B-FSLR-Daily-popped-above-recent-highs-with-MACD-turn-up-and-SQZM/

Aug 9 – Trading 47.72 post earnings in trend above 200 ma looking for pullback to ma bounce for assessment.
July 25 – Trading 44.98. ER in 2 days. Way over 200 MA and all MA’s. Waiting for a pull back to MA and bounce.
$AAOI – Applied Opto Electronics Inc
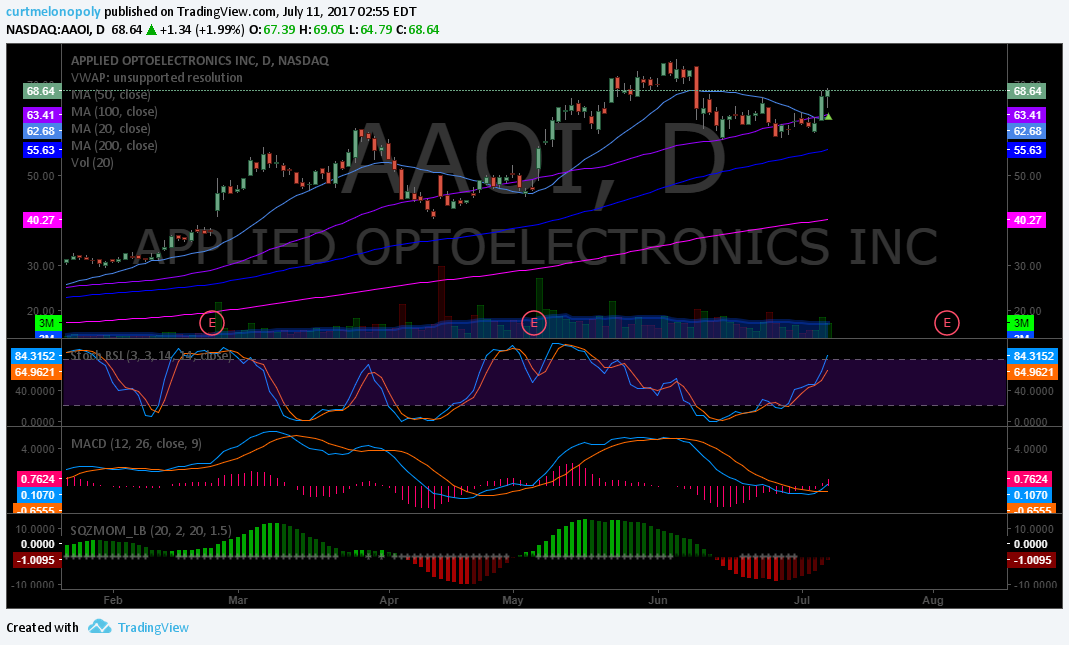
Nov 12 – $AAOI Trading 45.30 – I continue to hold and will likely start daytrading this, this week and maybe swing portions. It bottomed in the 36’s and now trades 45’s. On very high watch now.
$AAOI All indicators are turned up and it has 20 MA with 50 MA in sight.

Sept 18 – Trading 58.30 waiting on indicators on daily to turn back up.
Aug 9 – Trading 70.00 after big earnings miss – above 200 MA resting on 100 MA area. Watching for indicators such as MACD to turn back up and assess then.
July 25 – Trading 95.60. Significant runner ER in 9 days and threatening further break-out.
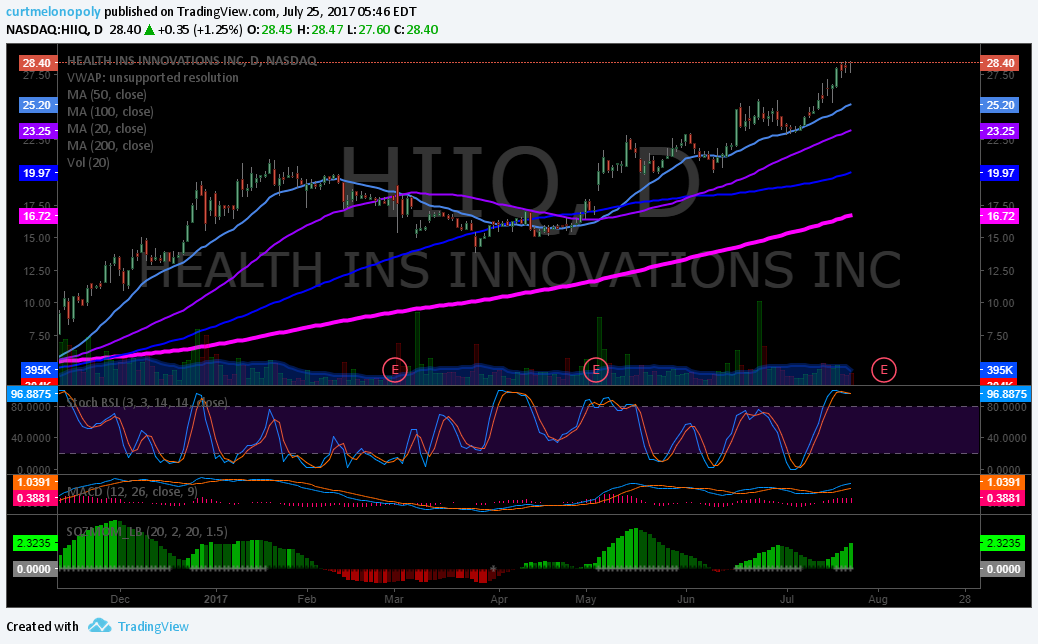
$HIIQ – Health Ins Innovations
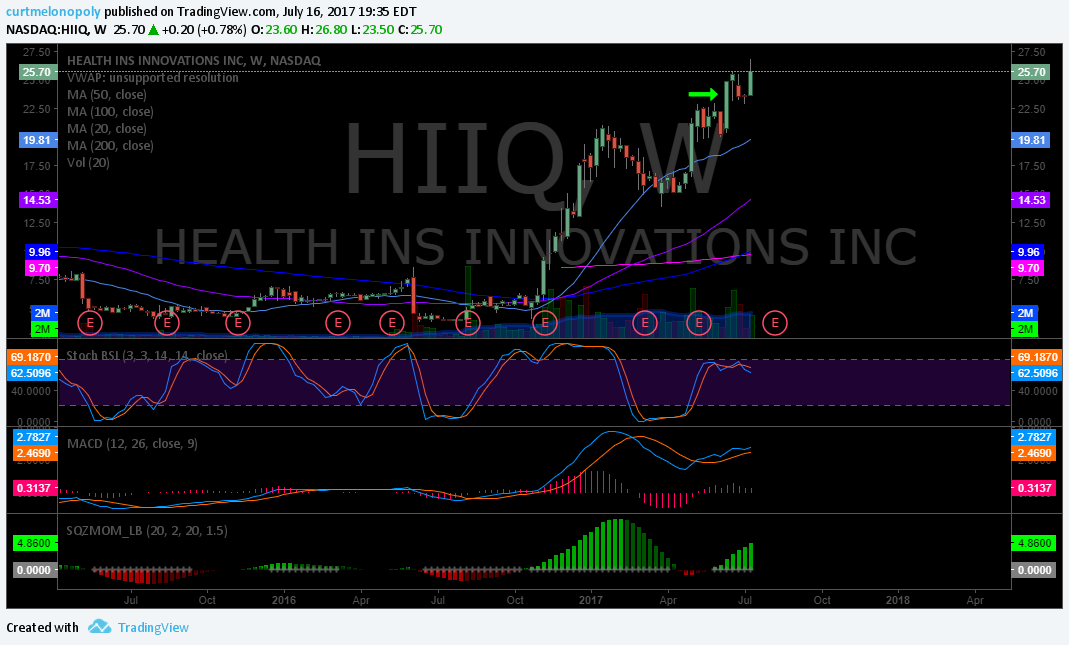
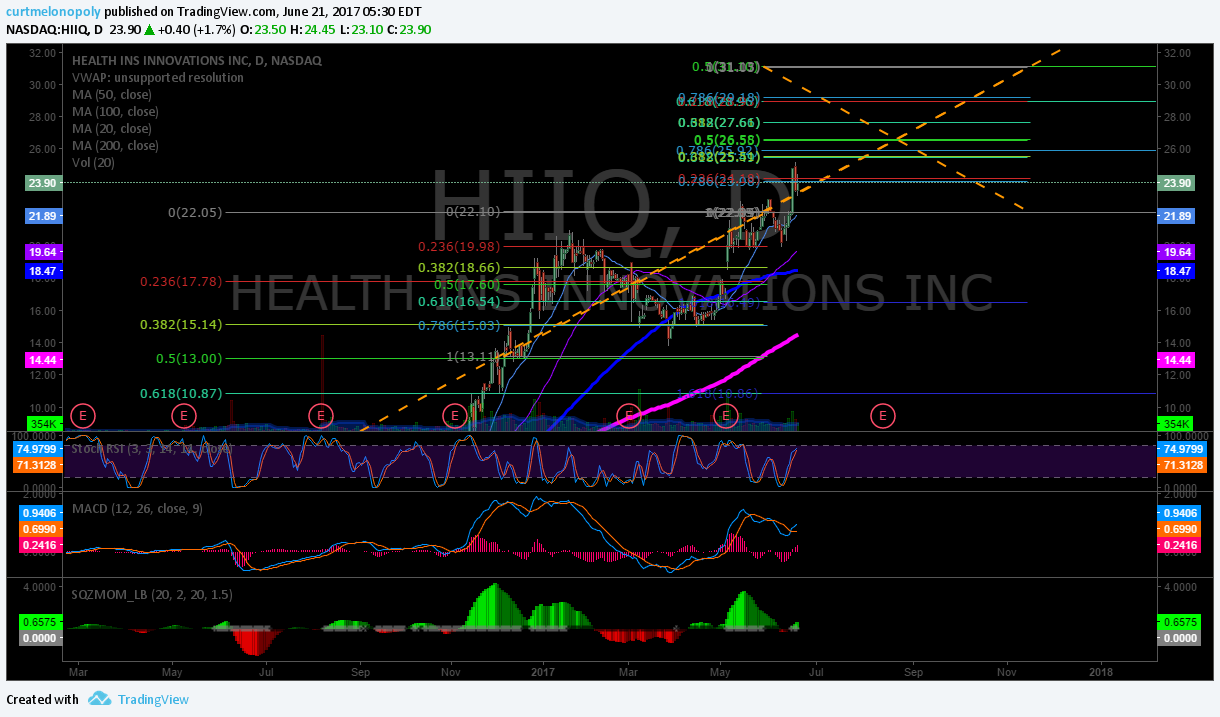
Nov 2 – Trading 23.95 on high watch now for a break above the 100 MA.
$HIIQ 20 MA breaching 50 and 200 MA to upside with 100 MA above. On high watch now.

Sept 18 – Trading 22.60 and just touched down on its 200 MA. Waiting for indicators on daily to turn.
Aug 9 – Trading 31.40 and all indicators still on bull mode. We are waiting for pullback to an ma to assess.
July 26 – $HIIQ closing 28.95 from 23.90 long.
https://twitter.com/SwingAlerts_CT/status/890255509336535044
$CELG
Nov 12 – $CELG Trading 102.34 after huge wash out with MACD now turned up. High watch.

Sept 18 – Trading 142.06. Testing previous highs now so it is on watch.
Aug 9 – Trading 135.27 with MACD and SQZMOM trending down. Waiting on MACD to assess indicators.
July 25 – Trading 137.49. ER in 2 days.
$LITE
Nov 12 – Trading 57.15 very near to 200 MA test – trending chart that will eventually fail the 200 ma test and it may be soon. On watch.
Sept 18 – Trading 57.20 with indecisive indicators at this point.
Aug 9 – Trading 60.35 on a pullback with earnings any moment. On watch.
July 25 – Trading 67.75 earnings in 5 days testing highs. Wow.
$CALA
Nov 12 – Trading 16.45 in a multi week sideway trading range. Watching.
Sept 18 – Trading 15.05 with indecisive indicators. Watching.
Aug 9 – Trading 14.11 on a pull back resting on 100 MA area waiting on MACD turn up to assess.
July 25 – Trading 15.18. ER 15 days and backtesting MA’s now. MACD trending down. Watching.
$XRT – SPDR S&P Retail ETF
Nov 12 – Trading 40.18 and MACD just turned up on daily but chart is under continued pressure. Only watching for now.
Sept 18 – Trading 41.20 and just under 200 MA on daily with extended indicators – likely turns down.
Aug 9 – Trading 41.11 and well under 200 MA with indecisive indicators. Watching.
$EXP Building Materials
Nov 12 – Trading 103.59 trading under pressure with price caught between MA’s – only watching for now.
Sept 18 – Trading 101.86. Just reclaimed 200 MA with extended indicators. On watch now.
Aug 9 – Trading 91.47 under 200 MA and indicators are poor. Watching.
$FIT
Nov 12 – Trading 5.93 with continued pressure and indecision in the chart.
Sept 18 – $FIT Trading 6.50 w reclaim 200 MA on daily and indicators up – on watch.

Aug 9 – Trading 5.85 under 200 MA watching.
July 25 – Trading 5.56. Same.
$VFC
Nov 12 – Trading 69.63 has been an excellent trending stock that is testing 20 MA and indicators are flashing warning signs for a failure. Only watching for now.
Sept 18 – Trading 62.43 with indecisive indicators and sideways trade.
Aug 9 – Trading 62.61 well above 200 MA and other MAs. Waiting on pull back and bounce and assessment of indicators at that time.
July 25 – Trading 58.88 in the bowl and may pullback for an MA test (watching for that now).
Alphabet (Google) $GOOGL, $GOOG
Nov 12 – Trading 1044.15 well above MA’s and likely to test 20 MA with indicators showing weakness just last few days. On high watch for a bounce off MA’s.
Sept 18 – Trading 935.69 with indecisive indicators.
Aug 9 – Trading 938.77 with price under 20 and 50 ma and waiting on MACD for an entry long.
July 25 – $GOOGL Last earnings held ER and banked. This ER didn’t hold and it tanked 2.45% Watching for possible long. https://www.thestreet.com/story/14240895/1/alphabet-shares-trade-lower-in-frankfurt-after-q2-earnings-highlight-traffic-cost-concerns.html?puc=yahoo&cm_ven=YAHOO&yptr=yahoo
Amazon $AMZN
Nov 12 – Trading 1125. 35 as with Google way above moving averages – will watch for a proper pullback.
Sept 18 – Trading 987.65 with indecisive indicators. Watching.
Aug 9 – Trading 985.45 and same set-up as GOOGL with price under 20 and 50 MAs and waitinig on MACD turn up now.
July 25 – Trading 1038.01 with ER on deck. Will watch.
Juno $JUNO
Nov 12 – Trading 57.59 and as I said early in 2017 it has rocketed. Way too far above MA’s right now to consider.
Sept 18 – Trading 44.30 in continued break out up against historical resistance. Watching.
Aug 9 – Trading 28.90 watching indicators for conclusive long thesis but we just cannot form one yet. Watching.
July 25 – Trading 30.20. Indicators are indecisive (likely due to ER in 9 day)
CombiMatrix Corp $CBMX
Nov 12 – Trading 7.05 with price action and indicators indecisive. Watching only.
Sept 18 – Trading 7.25 with weak indicators. Watching.
Aug 9 – Trading 7.30. We obviously missed this part of the move but it was an earnings gap up so now we wait for pullback to MAs and a bounce and assessment for long at that point.
July 25 – Trading 5.75 with all indicators flashing buy. ER in 8 days.
OakTree Capital $OAK
Nov 12 – Trading 42.45 after a major run up this year and significant wash-out – watching for a bounce.
Sept 18 – Trading 45.35 with 200 MA support test in progress. Watching close here.
Aug 9 – Trading 47.60 with indecisive indicators. Watching.
July 25 Trading 47.64 ER in 2 days. Watching.
VanEck Vectors Russia ETF $RSX
Nov 12 – Trading 22.28 with indecisive indicators. Only watching.
Sept 18 – Trading 21.95 testing previous highs.On high watch here.
Aug 9 – Trading 20.30 sitting on 200 MA with indecisive indicators. Watching.
July 25 – Trading 18.83. Under 200 again with Stoch RSI trending down and SQZMOM trending down.
BOFI Holdings $BOFI
Nov 12 – Trading 24.61 with poor indicators.
Sept 18 – Trading 26.29 attempting a 200 MA reclaim. Watching.
Aug 9 – Trading 27.75. This gapped up on earnings and may not pullback to MA to test so we are watching close now.
July 25 – Trading 25.30. Testing underside of 200 MA with ER in 2 days. On high watch here now.
US Silica Holdings $SLCA
Nov 12 – Trading 35.52 on high alert testing underside of 200 MA here.
Sept 18 – Trading 28.82 with indecision in indicators. Likely up next but watching.
Aug 9 – Trading 25.49 with all indicators down. Watching.
July 25 – Trading 26.95.First support I can see is around 22.80 and ER in 6 days.
$EOG EOG Resources
Nov 12 – trading 104.58 and extended way above moving averages. Watching for a return and bounce.
Sept 18 – Trading 93.22 and on its way to a 200 MA resistance test. Watching.
Aug 9 – Trading 91.15 under 200 MA and with mixed indicators and MAs. Watching.
July 25 – Trading 93.31. Testing underside of 200 MA with ER in 7 days.
$GREK Global Greece ETF
Nov 12 – Trading 8.96 and under all MA’s. Only watching for now.
Sept 18 – Trading 9.67 and trending toward a 200 MA support test.
Aug 9 – Trading 10.47 well above 200 MA and trending but under 20 MA and MACD down. Watching.
July 25 – Trading 10.67. Same.
July 16 – Trading 10.74. Same.
$TRCH Torchlight Energy
Nov 12 – Trading 1.24 and indecisive.
Sept 18 – Trading 1.34 and about to test 200 MA resistance.
Aug 9 – Trading 1.33. Same.
July 25 – Trading 1.40. Same.
July 16 – Trading 1.51. Holding. Watching. Original entry 1.50.
July 11 – Trading 1.43 holding.
June 27 – Trading 1.53. Holding 2000 from 1.50. Under 200 MA on weekly so I’m also waiting for that to be taken out.
$NG Nova Gold
Nov 12 – Trading 4.16 and indecisive.
Sept 18 – Trading 4.14 with weak indicators.
July 25 – Trading 4.40. Same.
July 16 – Trading 4.56. Same.
Email or DM me on Twitter anytime with thoughts or questions!
Cheers!
Curtis
Article Topics; Compound Trading, Swing, Trading, Stock, Picks, $FSLR, $CELG, $HIIQ, $GOOGL, $AMZN, $AMBA, $SLCA, $AAOI
