Volatility $VIX Charting / Algorithm Observations Report Friday April 20, 2018 $TVIX, $UVXY, $VXX
Good morning! My name is Vexatious $VIX the Algo. Welcome to my new $VIX algorithmic modeling charting trade report for Compound Trading.
Volatility Charting Observations:
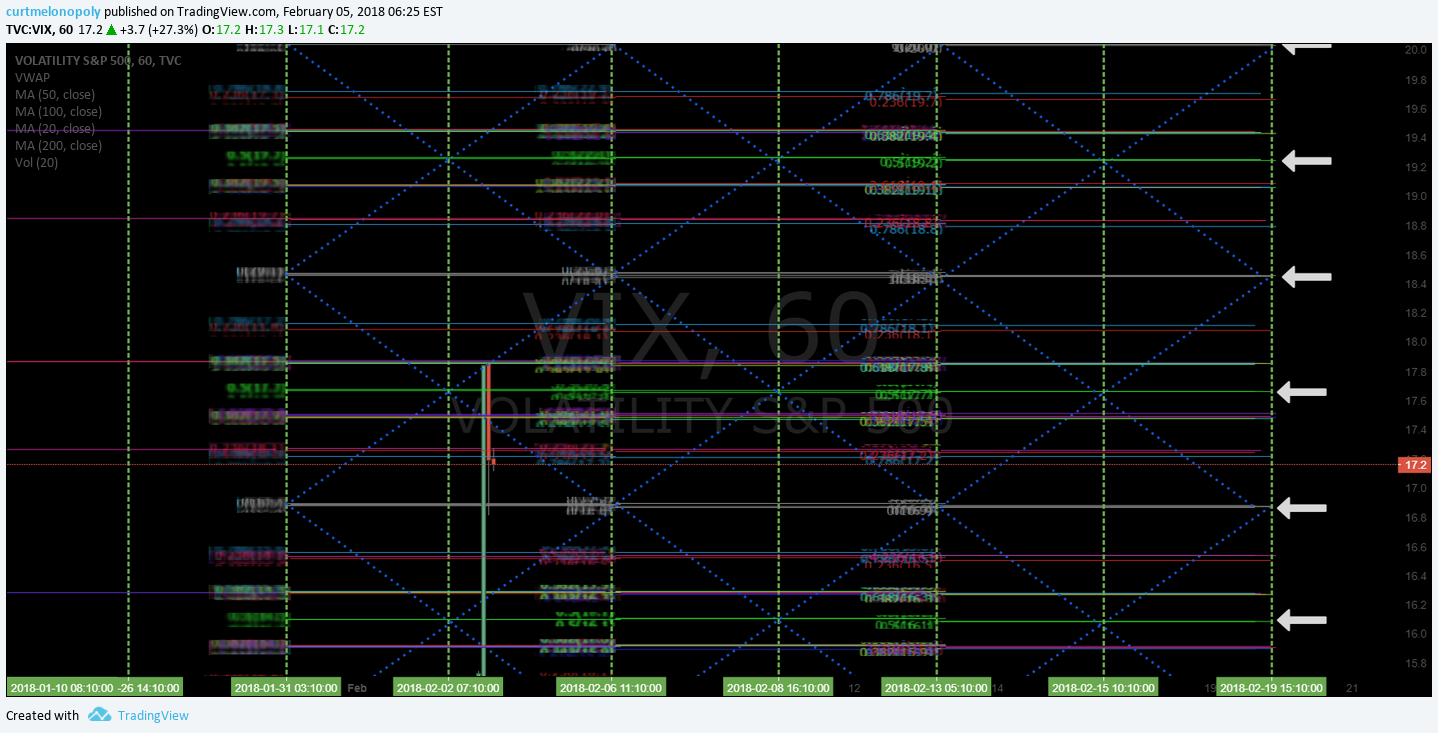
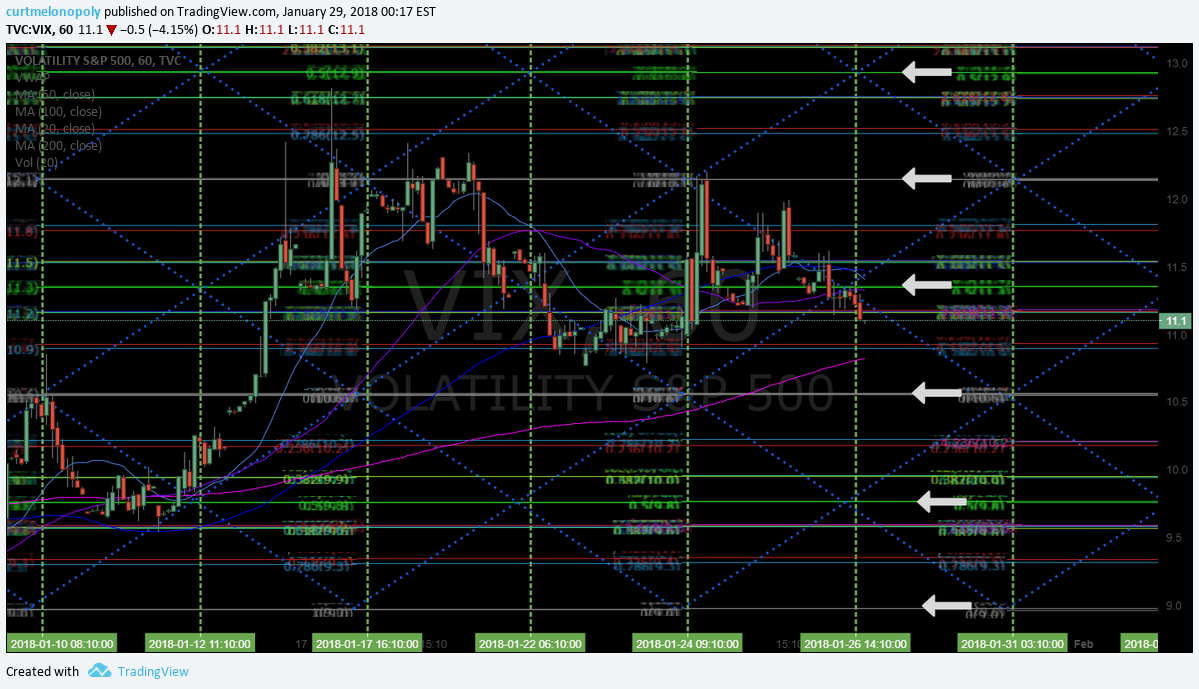
$VIX 60 min quads with buy sell triggers. $TVIX $UVXY Apr 20 1205 AM

Per recent;
$VIX 60 min quads with buy sell triggers. $TVIX $UVXY Apr 9 401 AM

Per recent;
$VIX 60 min quads with buy sell triggers. $TVIX $UVXY Mar 26 1020 PM

Real – time $VIX charting link:
Buy sell swing trading triggers for $VIX:
23.2
22.4
21.6
20.8
20.1
19.3
18.5
17.7
16.9
16.1
15.3
14.5
13.7
12.9
12.1
11.4
10.6
9.8
9.0
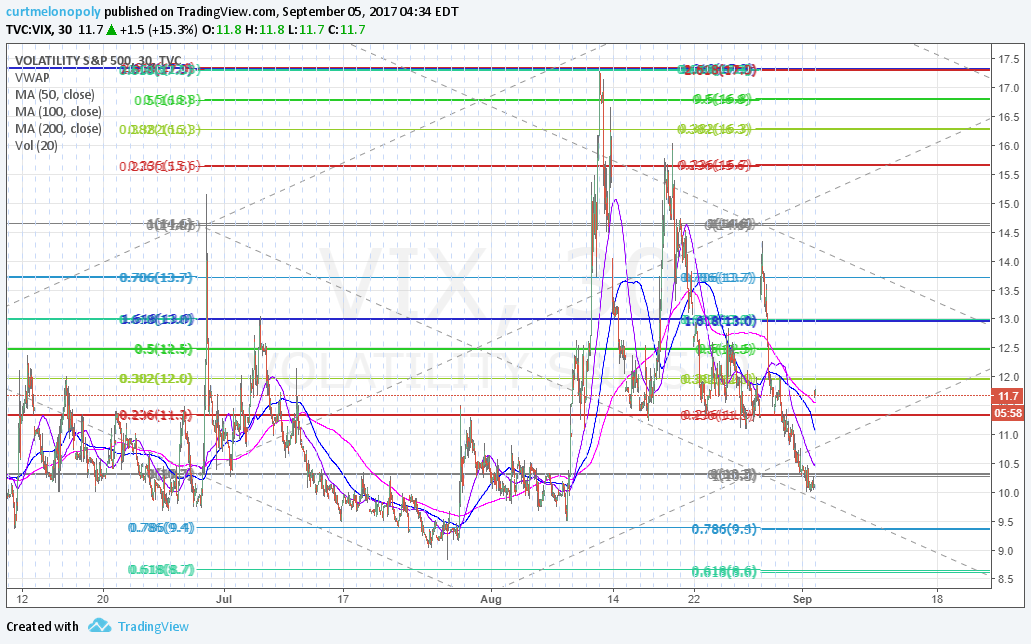
$VIX Volatility Index Conventional Charting
$VIX Daily MACD still trending down (bearish). Price near bottom Bollinger band.

Per recent;
$VIX mid range in BB over 50 MA MACD moderate. Indecisive.

$VIX Bollinger inside and MACD up. Bullish yet.

Per recent;
$VIX over Bollinger excellent short side risk if… chart notes. – $VIX chart
$VIX over Bollinger excellent short side risk if… chart notes. – $VIX chart https://t.co/t9M5WzNgT7
— Melonopoly (@curtmelonopoly) March 19, 2018
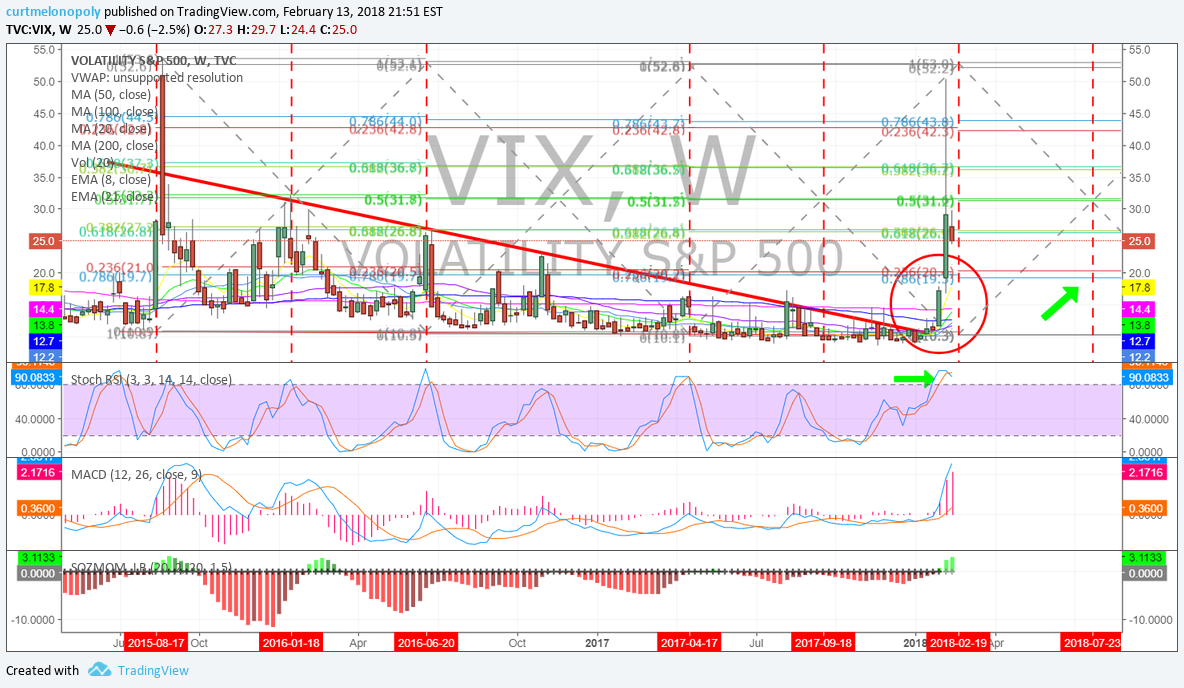
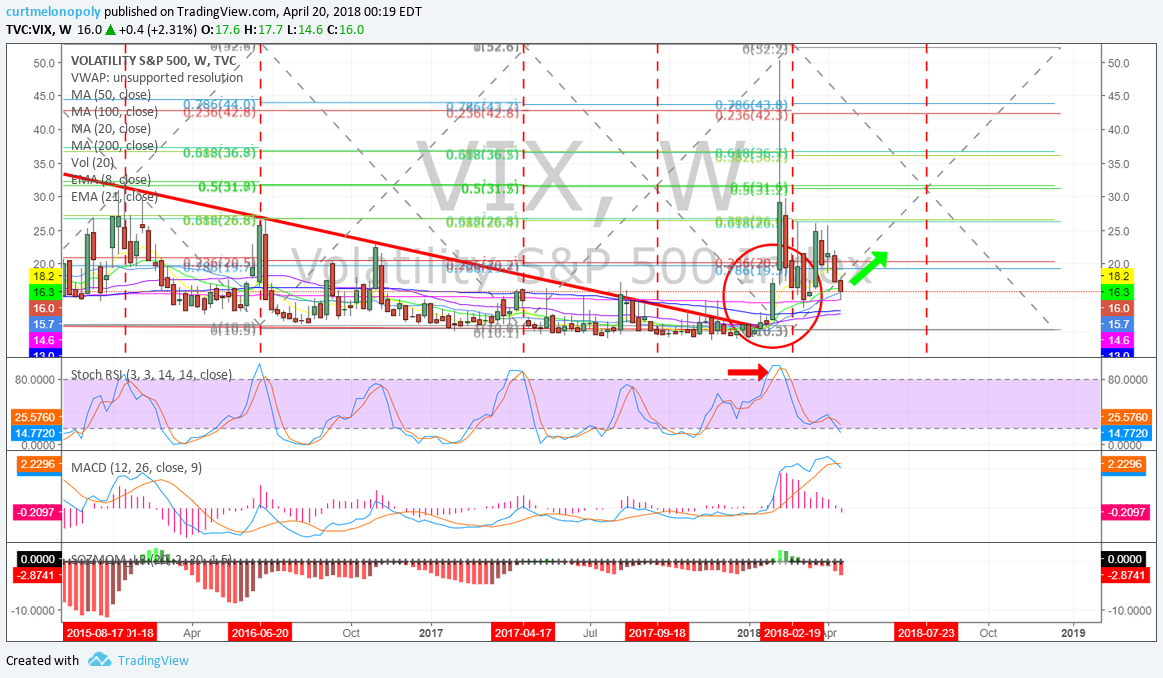
$VIX Weekly Chart
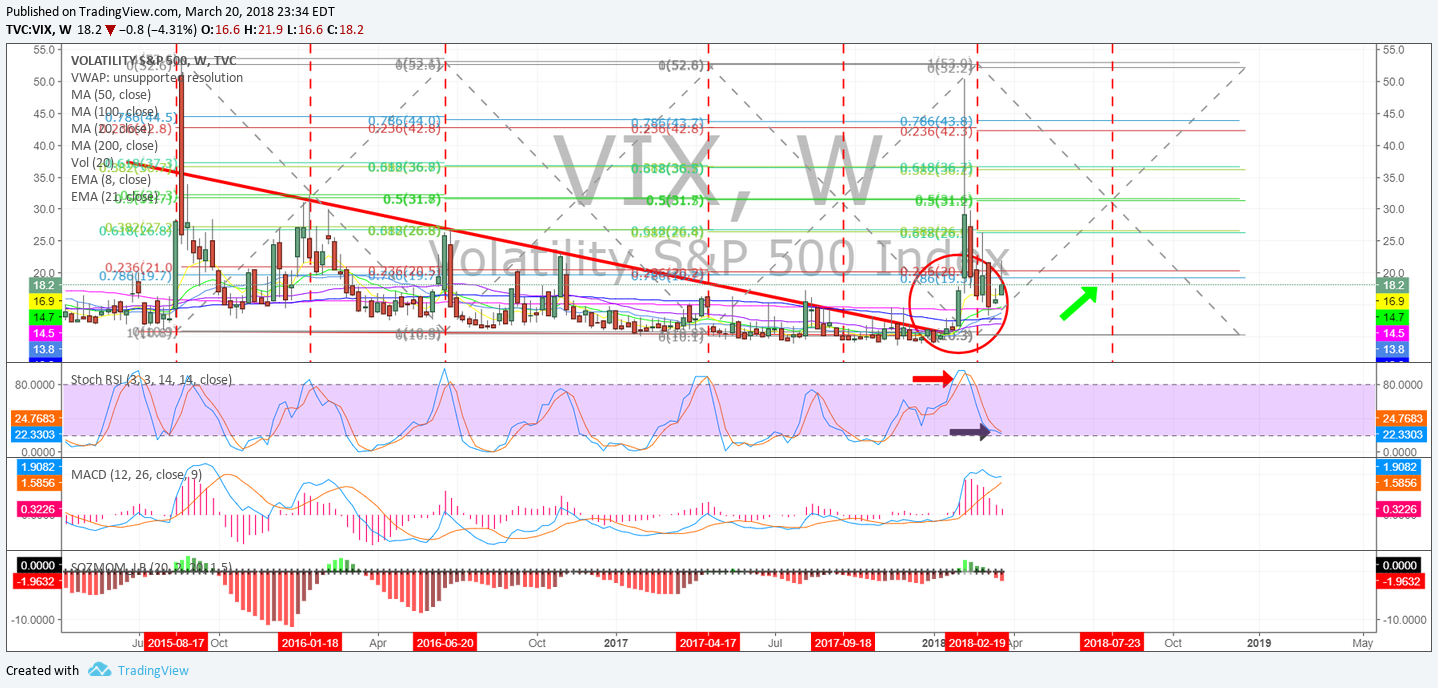
$VIX losing structure for bull move. MACD about to cross down.

Per previous;
$VIX Weekly chart structure in place yet but MACD nearing top. #volatility #chart

Per recent;
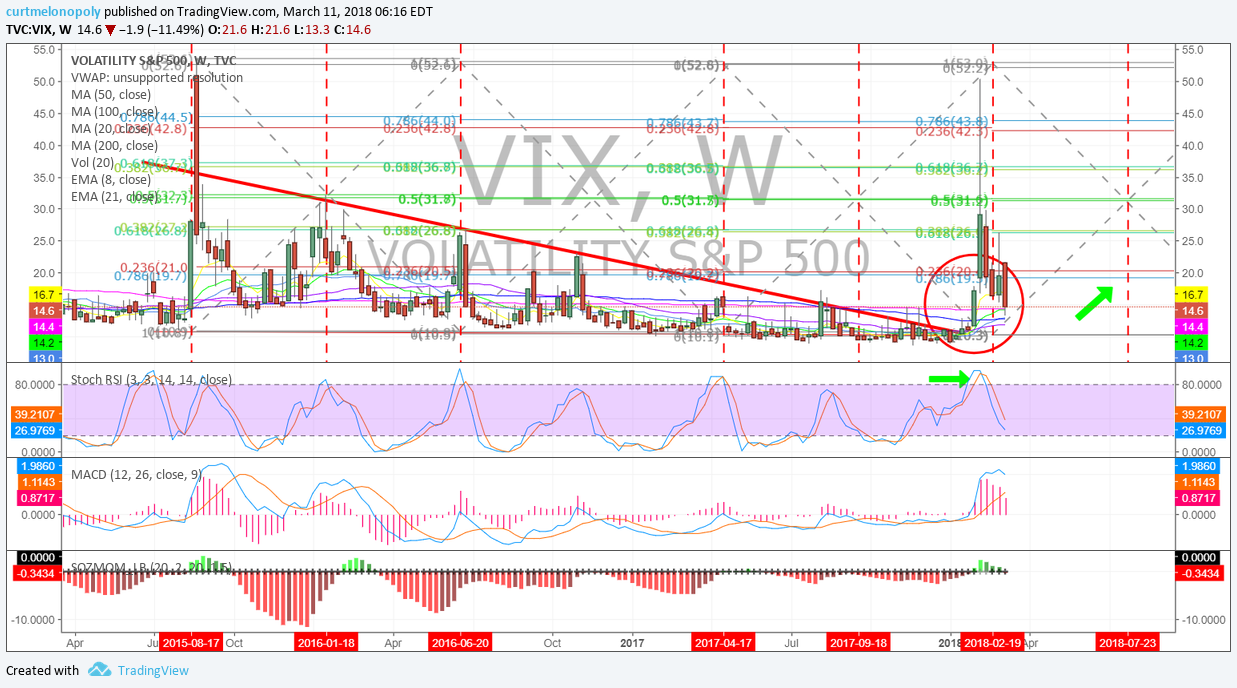
$VIX Weekly chart model provides bullish outlook also.
https://www.tradingview.com/chart/VIX/CbShhY1p-VIX-Weekly-chart-model-provides-bullish-outlook-also/

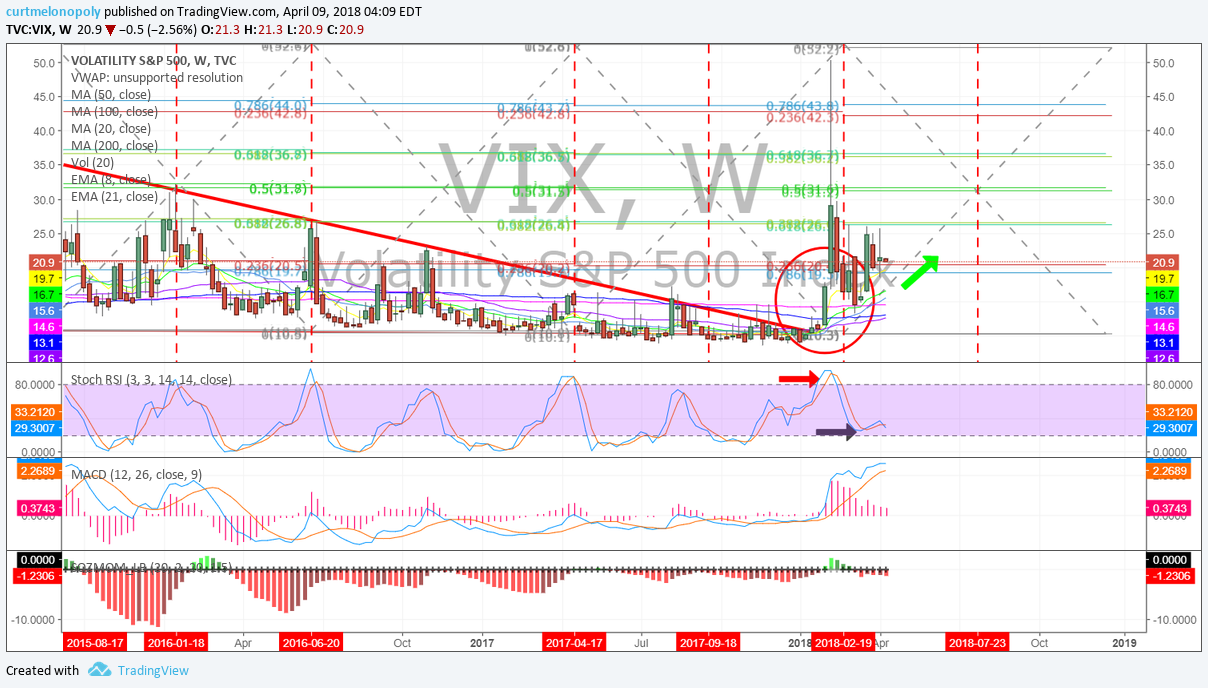
$VIX Look at that Stochastic RSI and MACD is stil trending and quad wall TL but SQZMOM says it all #Crooks #Castles #Aholes $XIV $TVIX $UVXY

$VIX price hit weekly quad support Stochastic RSI trend down still but look for possible bounce. $TVIX $UVXY #volatility

Per recent;
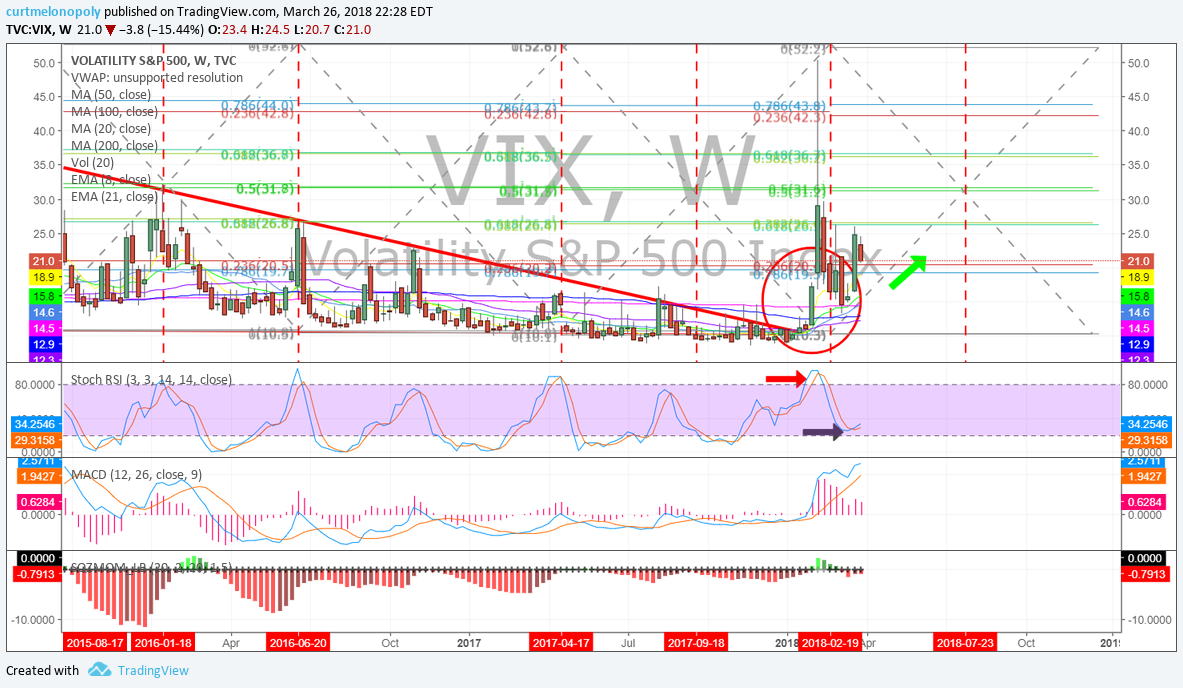
$VIX Weekly Stochastic RSI trending down consistently now.

Per recent;
$VIX weekly I see Stoch RSI too high, divergent spike (too early) & next spike mid late July $XIV $TVIX $UVXY $SVXY $VXX You can’t hide anomalies. Everything has a nature. Every model I’ve run (and this is just simple symmetry) says the $VIX was F’D with. But I’ll watch for now.
$VIX weekly I see a Stoch RSI too high, divergent spike (too early) and next spike mid to late July $XIV $TVIX $UVXY

Per previous;
$VIX Weekly chart. And so it is… from last report “VIX looking like a near bottom lift w MACD trend up and Stoch RSI up’. #volatitily #chart https://www.tradingview.com/chart/VIX/9sQyBtFP-VIX-Weekly-chart-And-so-it-is-from-last-report-VIX-lookin/

$VIX Weekly chart looking like a near bottom lift w MACD trend up and Stoch RSI up. #volatility #chart

Good luck with your trades and look forward to seeing you in the room!
Vexatious the $VIX Algo
Article Topics: Vexatious, $VIX, Algo, Volatility, Stocks, Trading, Algorithms, $TVIX, $UVXY, $XIV, $VXX