Volatility (VIX) Algorithm Chart Model Observations & Report Thursday July 12, 2018 $VIX, $TVIX, $UVXY, $VXX
Good day. My name is Vexatious $VIX the Algorithm. Welcome to my new $VIX algorithmic model charting report for Compound Trading Group.
Volatility (VIX) Charting / Observations:
Buy sell swing trading triggers for $VIX:
23.2
22.4
21.6
20.8
20.1
19.3
18.5
17.7
16.9
16.1
15.3
14.5
13.7
12.9
12.1
11.4
10.6
9.8
9.0
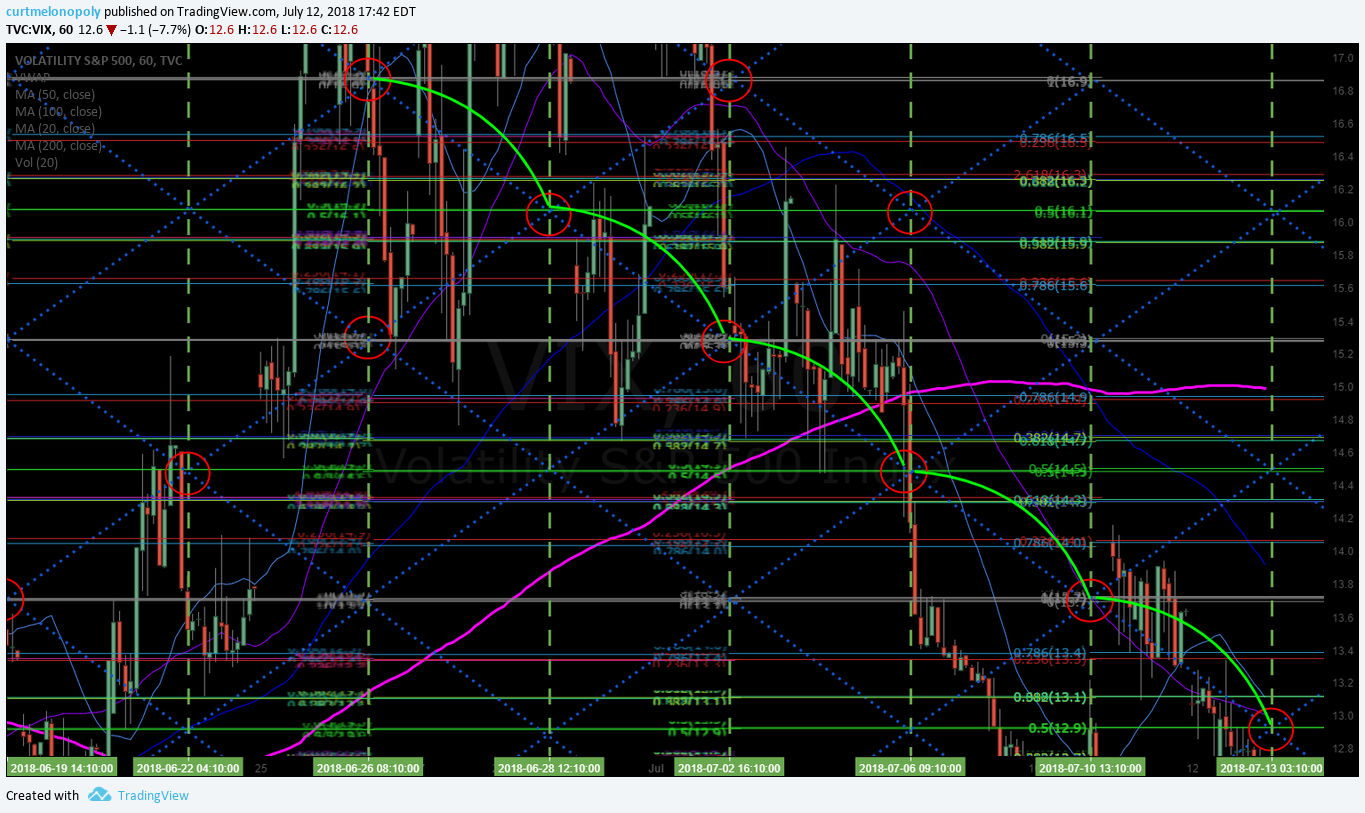
July 12 – Volatility S&P 500 Index (VIX) Structured symmetry on 60 min last time cycle has been awesome. $VIX #volatility $TVIX $UVXY

JUly 12 – Volatility S&P 500 Index (VIX) Continued down channel symmetry scenario – watch for time cycle completion however. $VIX #volatility $TVIX $UVXY

Volatility S&P 500 Index (VIX) Structured take-off on 60 minute model in to time-cycle peak. June 25 1108 PM $VIX #volatility $TVIX $UVXY

Volatility Index (VIX) Charting. Conventional Technical Observations.
Volatility S&P 500 Index (VIX) Within Bollinger bands under 200 MA. MACD down. July 12 728 PM $VIX #volatility $TVIX $UVXY

Volatility S&P 500 Index (VIX) Above bollinger bands on daily but use caution shorting. MACD up also. June 25 1136 PM $VIX #volatility $TVIX $UVXY

$VIX Weekly Chart
Volatility Index (VIX). Nearing completion of time cycle, watch for a possible reversal. 735 PM July 12 $VIX #chart #timecycle

Volatility Index (VIX). Weekly chart moving in to next time cycle peak with VIX spiking. $VIX #chart #symmetry

Per recent;
Volatility Index (VIX). Weekly chart suggests mid July time cycle peak could bring long side RR advantage soon. 216 AM June 5 $VIX #chart #symmetry https://www.tradingview.com/chart/VIX/zS0lmIbC-Volatility-Index-VIX-Weekly-chart-suggests-mid-July-time-cycl/

Per recent;
Simple symmetrical time cycle on weekly, Volatility reversal leading in to July 14 – 23 ish probable. $VIX $UVXY $TVIX

Simple symmetrical time cycle on weekly chart, Volatility reversal leading in to July 23 ish is probable. $VIX $UVXY $TVIX #volatility #trading

Per recent;
$VIX weekly chart has MACD trending down and structure broke.

Per recent;
$VIX structure on the last bullish move is now all but gone. Likely continued decline.

Volatility News:
Wall Street’s ‘fear index’ jumps as stocks slide, could see biggest one-day move in 4 months.
https://twitter.com/CompoundTrading/status/1011453669160648704
Fear index VIX jumps by 26% on trade worries w/ S&P 500 fell most since Apr.
Fear index VIX jumps by 26% on trade worries w/ S&P 500 fell most since Apr. pic.twitter.com/gFQH3se5an
— Holger Zschaepitz (@Schuldensuehner) June 25, 2018
Good luck with your trades and look forward to seeing you in the room!
Vexatious the $VIX Algorithm
Article Topics: Vexatious, VIX, Algorithm, Volatility, Chart, Trading, $TVIX, $UVXY, $VXX