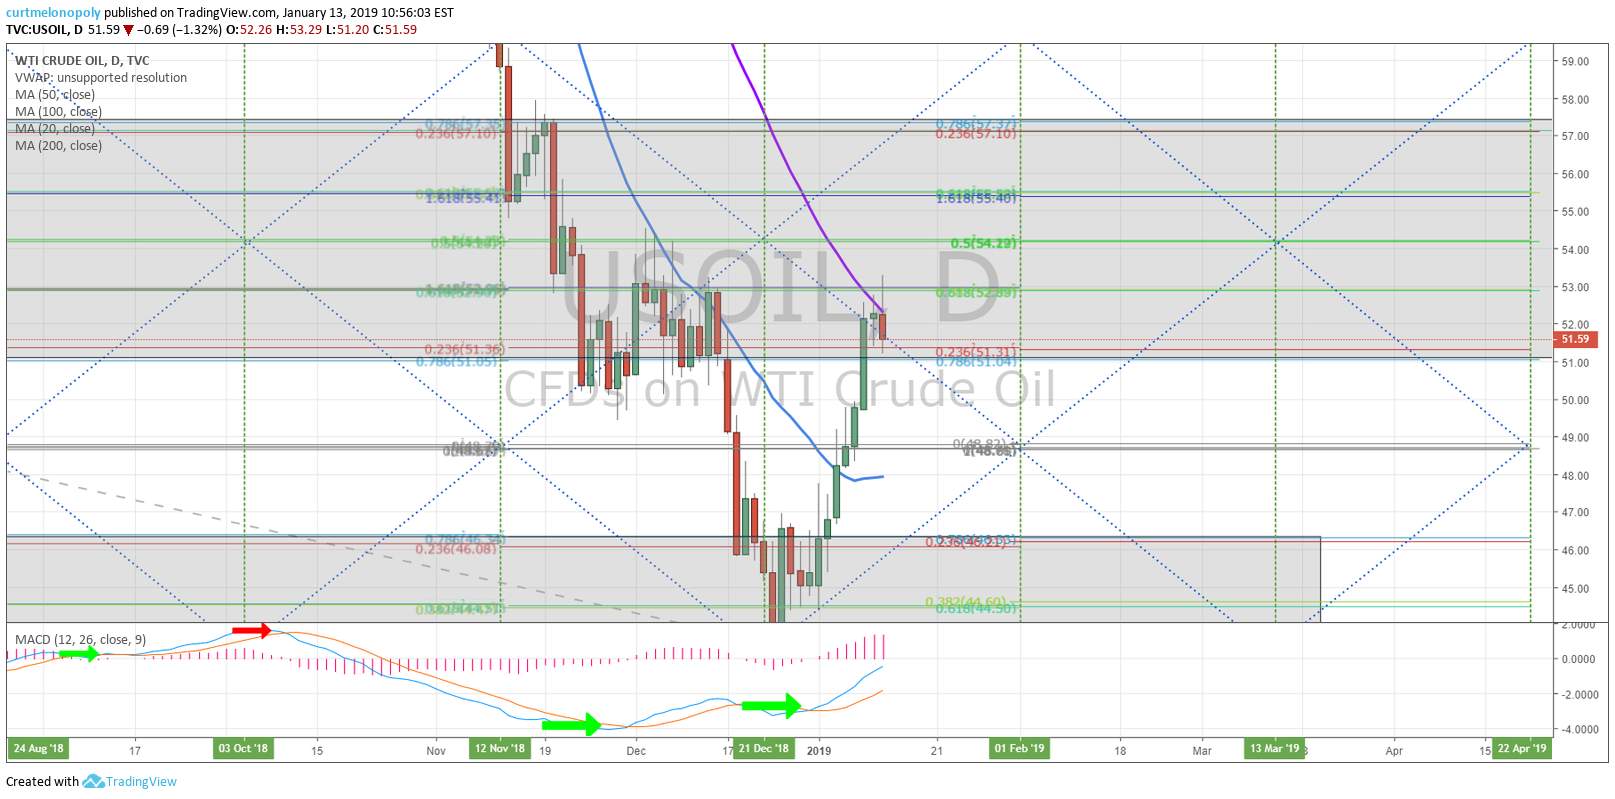
Crude Oil Day Trade Strategies Session With Our Lead Trader Jan 14, 2019 for Intra-Day Trading and Forward Guidance for Week of Jan 13, 2019. Video.
Video starts at 00:45.
1:00 I will look at crude oil trade first and then cover the other algorithm models and equities we follow.
1:38 Time cycles. Last week was first full week post holiday and time cycle completion week. This week we expect oil time cycle to start to form out.
If you consider where oil recently peaked, this could be the short term top per previous guidance (for retrace down).
At 2:30 is a sizing chart we are using for our machine trading software development (a doodle chart).
The downward channel in a reversal explained on this chart and the upward channel in continuation of recent trend from daily chart bottom is explained on this chart.
Support and resistance for uptrend and downtrending trade for daytrading and sizing swing trades is explained here on this chart.
At 5:55 I explain two areas of daytrading crude oil strategeis (setups) that I missed and how. It’s a learning lesson for chart setup strategies in crude oil.
At 7:20 the weekly crude oil trading chart is reviewed. The weekly Fibonacci support and resistance areas are reviewed. This is very important for swing trading range in this area of oil trade. There is resistance at 200 MA, diagonal Fib line and trading box over head resistance. The trading zone is highlighted here for visual understanding.
I am short term bearish now at resistance on this chart and bullish at support on this chart. Very, very important chart if you’re trading crude oil.
At 10:15 the daily chart diagonal Fib decision area is important as outlined as its a time cycle completion (small), 50 MA resistance also. 48.80 is a target and 54.17 up top both for Feb 1 depending on direction here forward.
At 11;15 on weekly Trend Line resistance is a little higher and support makes sense on daily quadrant lower support outlined on vid.
12:28 240 minute chart, 20 MA was touched and price backed off. It didn’t get to its upper price target and that was a signal of a pull back in play.
At 14:30 on the 1 minute daytrading chart the structure, support and resistance, trading box areas are reviewed. Trade intraday has been sloppy. Time frame sizing is the point of this modeling.
Machine trading has been coming back in to market but still quite vacant post holiday and model anomalies.
At 17:10 the algorithm model is reviewed. Resistance and support of the trading channel in an uptrend or downtrend on the weekly time frame is discussed.
There are a number of price targets and trade action guidance for day trading and swing trading the weekly trade in crude oil on this part of this video.
#crudeoil #daytrading #strategy
Further Learning:
If you would like to learn more click here and visit our Crude Oil Trading Academy page for complimentary oil trading knowledge – posts from our lead traders that include learning systems, blog posts and videos.
Welcome to NYMEX WTI Light Sweet Crude Oil Futures.
Subscribe to Our Oil Trading Platform:
Standalone Oil Algorithm Newsletter (member charting sent out weekly).
Real-Time Oil Trading Alerts (Private Twitter feed).
Oil Trading Room / Algorithm Newsletter / Alert Bundle (includes weekly newsletter, trading room, charting and real-time trading alerts on Twitter).
Commercial / Institutional Multi User License (for professional trading groups).
One-on-One Trade Coaching (Via Skype or in person).
Click here to find all information and pricing on Oil Newsletter, Trading Chat Room, Oil Alerts and more.
Curtis Melonopoly (@curtmelonopoly) is rated Top 250 Stock exchanges authority, covering also Mathematical finance and Economy of the United States
Article Topics: Crude, Oil, Day Trading, Guidance, Strategy, USOIL, WTI, CL_F, USO
Follow:
