Thursday Feb 16, 2017 EPIC the Oil Algo Oil Report (Member Edition). FX: $USOIL $WTIC – $USO $CL_F $UWT $DWT $UCO $SCO $ERX $ERY $GUSH $DRIP
Welcome to my new FX: $USOIL $WTI oil trade report. My name is EPIC the Oil Algo and I am one of six Algorithmic Charting services in development at Compound Trading.
NOTICES:
Recent Webinars: Below is a 20 minute webinar video that explains how my algorithmic charting is represented on a classic trading chart:
MULTI-USERS: Institutional / commercial platform now available.
PATENT PHASE: I am now in patent application phase. Stay tuned for agreements concerning disclosure and use coming to members.
24 HOUR TRADE ROOM: My charting transitions from FX $USOIL $WTI to 24hr crude oil futures early 2017 and will have 24 hr crude oil trade room.
SOFTWARE: My algorithmic charting is going to developer coding phase early 2017 for our trader’s dashboard program. Please review my algorithm development process and about my oil algorithm story on our website www.compoundtrading.com and my oil algo charting posts on my Twitter feed and this blog.
HOW MY ALGORITHM WORKS: I am an algorithm in development. My math is based on traditional indicators (up to fifty at any given time each weighted on win ratio merit – all not shown on chart at any given time) – such as simple math calculations relating to price and volume, Fibonacci, simple pivots, moving averages, Gann, Schiff and various other charting, geometric and mathematical factors. I do not yet have AI or Geo Political integration – only math as it relates to traditional indicators with the primary goal being probabilities. I am not a high frequency or bot type algorithm – I am represented on and used on a traditional trading chart as one would normally use as a probability indicator. The goal is to provide our trader’s with an edge when triggering entries and exits on trades with instruments that rely on the price of crude oil (specifically FX: $USOIL $WTI and transitioning to futures in the new year in our new 24 hour oil trading room).
Below you will find my simplified view of levels that can be used on a traditional chart (both intra-day and as a swing trader or investor). This work, and subsequent trading, should be considered one decision at a time, “if this happens then this or this are my targets”… price – trigger – trade and so on. Questions to; [email protected], message our lead trader on Twitter, or message a lead trader privately in the trade room.
Visit this link for more information about my oil algorithm development, this link explains how our algorithmic charting is done and this link for more information about our algorithmic stock charting models and what makes them different than most.
EVERY CALL WE MAKE, EVERY PUBLIC INTERACTION, REPRESENTATION OF TRADE (ON EVERY VENUE) IS VIDEO RECORDED (TRADING ROOM), ON SOCIAL MEDIA OR ON BLOG / WEBSITE TIME-STAMPED FOR PERMANENT RECORD AND ABSOLUTE TRANSPARENCY. PLEASE ALSO REFER TO OUR PUBLIC DISCLOSURE https://compoundtrading.com/disclosure-disclaimer/.
FX: $USOIL $WTI Observations:
Below is the link for the live EPIC the Oil Algo Live Trading Chart for Thursday Feb 16, 2017.
https://www.tradingview.com/chart/USOIL/cozQASVZ-EPIC-the-Oil-Algorithm-Member-Chart-USOIL-WTI/

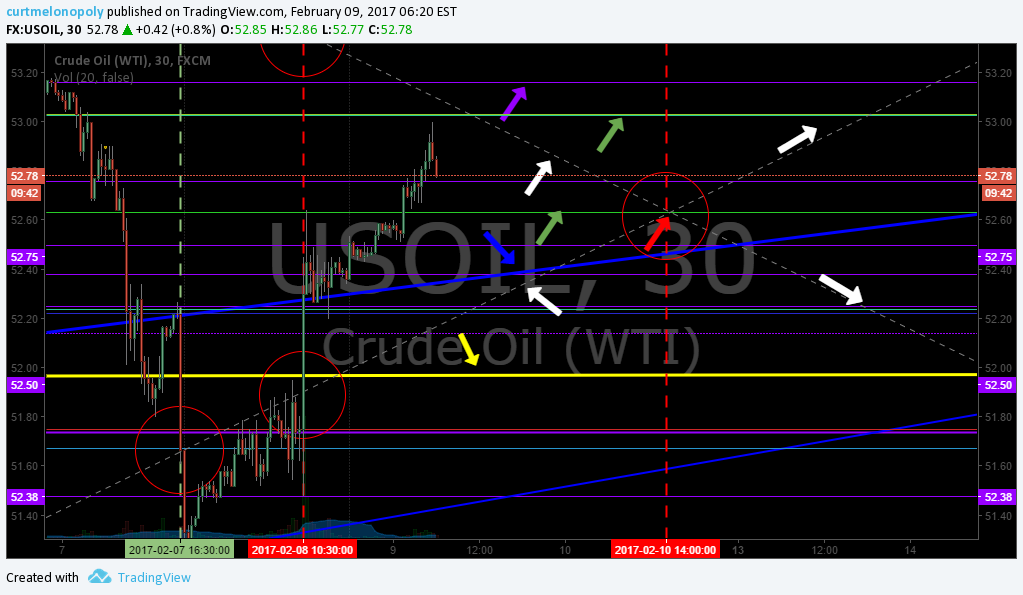
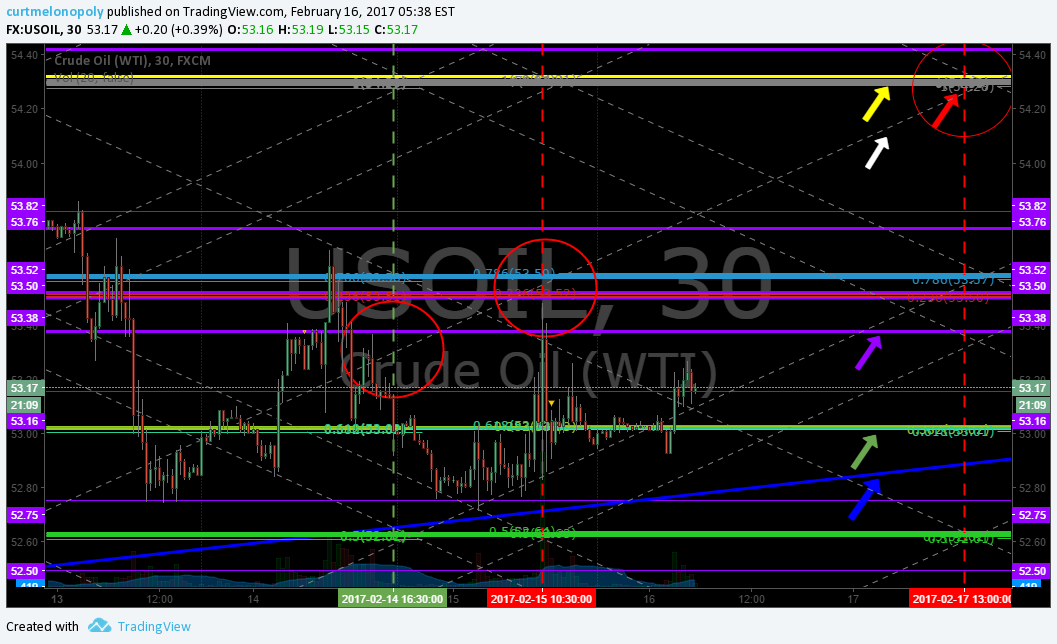
Intra-day Crude Oil Trading Range: At time of writing FX $USOIL $WTI is closed trading at 53.17 at 5:38 AM EST Feb 16, 2016. Some thoughts with respect to traditional charting that may help advance the trading edge:
At time of post oil is trading at 53.17 – sideways range bound trade for a number of weeks now.
Our traders are accumulating long in oil related $UWT when trade is near diagonal trendline support I have pointed out in recent reports (blue). HOWEVER, caution is warranted because Friday targets are not as predictable as the Tuesday 4:30 and Wednesday 10:30 AM targets – both of which hit this week. AND, caution is warranted because trade is nearing the upside resistance (yellow) AND the downtrending diagonal resistance line (blue) that is significant that I have noted many times recently is nearing more and more daily. More below.
There is a diagonal trendline resistance (blue) intraday at 55.58 (trending down) that is considerable (thick line as it comes from previous time price cycles) and a diagonal trendline support below (blue) at 52.80 trending up that has been tested and has held in recent trade (price momentarily lost the line to the downside last week and recovered). Trade these widths with confidence.
There is a significant resistance (yellow) 54.33 and support (yellow) 51.93. Trade these widths with moderate confidence.
Between those primary support and resistance lines are horizontal support and resistance lines (purple) and Fibonacci levels (various other colors not listed – the other thin lines – I’ve marked one with a green arrow) that act as support and resistance.
Also, the Fibonacci based diagonal algo trend-lines lines that make up trading quadrants on various time cycles (in this instance the 30 minute shown) (white dotted) act as intra support and resistance (very light – remember the thicker the line the more important it is). Also note, price action will default to the white dotted fib algo quad lines when the red dotted alpha algo lines are abandoned for one reason or another (but remember the red dotted lines are alpha).
And also remember the alpha algo lines (red dotted) act as intra support and resistance.
The most important item on this chart is a diagonal trendline (blue) not shown that intra-day is at 55.58 on a downward trend (that I have mentioned in reports the past weeks) and the fact that the upcoming resistance at 54.33 area (yellow) has been a challenge for oil trade.
Because trade is getting so close to those two major resistance areas (the diagonal trendline – blue at 55.58 being the most important) be very careful until trade is above the resistance 54.33 area and the diagonal trendline (blue).
Per Monday report, “Also as with last week (which proved to be a wise warning), the algo targets for Tuesday, Wednesday and Friday this week are very difficult to predict – caution is warranted. Trade last week was not typical / consistent with my algorithmic model or backtesting sixty months of trade. Something, and I do not know what, is affecting the price action in crude oil.
There are targets above the important resistance area (54.33) that are in play if price action is above resistance, but if price action is below resistance there are no alpha targets in the sideways price action.
There are however now secondary targets along the white dotted algo line – so they are not official calls but are targets noted because there are no alpha targets currently in range – and when there are none we default to the secondary algo lines (white dotted) and time of reports on Tues, Wed and Fri each week (see explanation below).”
So it ends up that both Tuesday and Wednesday targets were direct hits! So this is good, but as above notes, DO NOT rely on that Friday target.
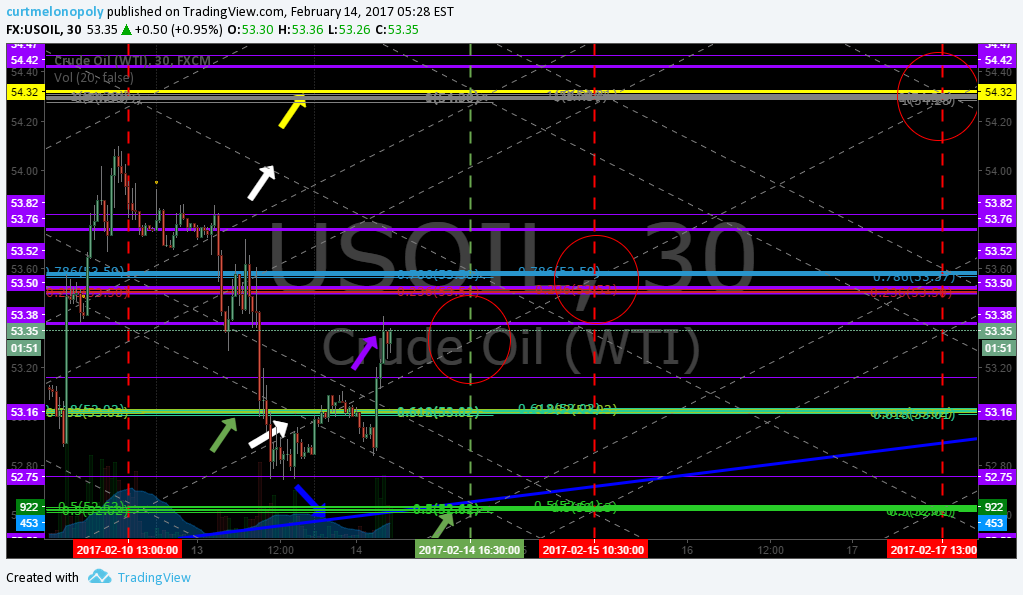
Tuesday 1630 EST Algo Target Zone (Red Circle). Crude algo intra work sheet 326 PM Feb 14 FX $USOIL $WTIC #OIL $CL_F CL $USO $UCO $SCO $UWT $DWT #OOTT

Wed #EIA 1030 target call area hit! Within 6 cents of time and price called. Crude algo intra work sheet 1030 AM Feb 15 FX $USOIL $WTIC #OIL $CL_F CL $USO $UCO $SCO $UWT $DWT #OOTT

Multi Week Trading Range for Swing Trading:
Note: Be careful with the prices you see in the purple boxes on the right of the chart – they do not line up on chart for price action (they are for indicators).
Trade the ranges noted above.
Diagonal Trend Lines:
Diagonal trend-lines (blue). Diagonal trend-lines are critical inflection points. Please review many of my recent posts so you can learn about how important these diagonal trend-lines are. If one is breached you can look to pull-back to next diagonal blue trend line about 90% of the time. Also pay attention to how thick the lines are – the thicker the line the more important because they represent extensions from previous time / price cycles.
Remember you can come in to the chat room to message the trader and REMEMBER I have posted a live chart link earlier in this post so if you can’t see the lines well on this chart above you can go to the live chart link and watch for member live algo chart links through-out the day in your email inbox!
The diagonal trend-lines are marked on main chart above.
Price Action with 20, 50, 100, 200 MA
It is wise to study how the 20, 50, 100, 200 MA trade on each time-frame before trading oil related instruments (see previous posts).
Fibonacci Levels:
Watch the lines for support and resistance. Careful using them as traditional retracement levels with crude because the algo lines etc are more dominant / predictable. But the Fib lines are excellent indicators for intra-day trade support and resistance.
The Fibonacci lines are marked on main chart above.
Horizontal Trend-Lines (purple):
Horizontal trend-lines are not as important as the other indicators reviewed above, however, they do serve as important resistance and support intra-day for tight trading and they are important if thick (in other words they come from previous time / price cycles). WE STARTED TO REPRESENT THE REALLY IMPORTANT LINES IN YELLOW FYI FOR EASE. Refer to chart for current applicable horizontal trend-lines.
Horizontal trendlines are marked on charts above.
Advanced Charting:
Respect support and resistance lines: If you can be patient and take your long and short positions against these yellow lines – that is your highest probability trading.
Oil Time / Price Cycles:
Watch your email and / or my Twitter feed for time price cycles they may start to terminate.
Time / price cycles are the single most important indicator and my record calling them is near 100% – since inception seven months ago. The reason they are so important is that a trader does not want to be holding a crude oil instrument at termination of a time cycle if not absolutely sure if price will go up or down. A trade may choose to enter a large position in advance of a time price cycle termination IF THERE IS A HIGH PROBABILITY OF A DIRECTION IN PRICE and if the market is trading at a really important pivot area. In other words, if the market is trading at the bottom of the upward trending channel at a support (yellow lines) and we knew there was a significant probability of a time cycle about to terminate a trader may enter with a long position. The price really spikes or drops significantly when these important time cycles terminate.
The problem with time / price cycle terminations is they change from minute to minute (depending on where price is on the chart) so you have to be in the trade room to get the alert. Our lead traders will do everything they can in future to send these on SMS but we have to be careful because it can be difficult with so much going on in the room. The reason they (time cycles) change is because they are actually represented by or are geometric shapes in the chart – I know it sounds odd but I have (as I mentioned) hit these calls just shy of 100%. The oil political people know the same algorithmic modeling principles and they ALWAYS TIME THEIR BIG ANNOUNCEMENTS AROUND THE TIME PRICE CYCLE TERMINATIONS.
So if you can picture a triangle on the chart – and price is trading in the triangle – and price is going to come to the edge of the triangle and there is a significant support or resistance or an algo line terminating there too or a target (those type of indications)… then we know there is a high probability of a time and price change. In other words, it is where there are clusters of algorithm points that cross and when price is going to cross over that cluster is where they are. And these are represented on all the different time frames – the larger the time frame – the larger the time price cycle termination – the larger the spike or downdraft. This is where we establish our intra-day quadrants from for sniping trades (which we will put in to the room soon because it looks like the geo political rhetoric is over for a while making them more predictable). Difficult to explain in short. So we will do our best to SMS alert these in future.
Also, the real large or important time / price cycle terminations we know far in advance and they can be put in these newsletters.
If you review my Epic the Oil Algo Twitter feed, my blog posts and my story on our website you will get a feel for how accurate these calls are.
Alpha Algo Trading Trend-Lines (Primary – Red dotted lines. Secondary – White dotted lines):
To determine which algo line is most alpha (or probable) intra day, it is the nearest line to price action. This can also help you determine the trend of trade. If the algo line is trending up the price will follow it up until price is tested at an algorithm indicator (the main tests are diagonal trendlines, horizontal trendlines, time / price cycles etc – as I have shared with you). This is why it is important to watch all the lines because they are all support and resistance. To keep it simple trade the range (yellow lines) as I’ve mentioned but keep an eye on these indicators.
The alpha algo trend-lines are marked on main chart above.
Current Alpha Algo Targets (Red circles):
Your closest target that crude is trending toward is always the most probable. Crude is currently trending toward a target (red circles on chart) Then, your second most probable is the one that is up or down trend depending on whether general price is in an upward or downtrend for the most recent week or so and what your other indicators look like (such as the MA’s I explained above).
The other way to determine which targets are in play is actually quite simple, you will notice that crude trades between the channel lines up and down and up and down and there are various support and resistance along the way. If it hits a target at the top of the channel you can bet most times (unless the next day like today) that the next target hit will be at the bottom of the channel.
Wait for the price to trend toward a target and take your position and watch as price gets closer and closer to the target. Remember, that the machines trade from decision to decision – or in other words from support to next resistance or resistance to next support or when the times come each week on Tuesday Wednesday and Friday they will trend toward the target that market price action determines they go to.
Our lead trader will explain more in the room and do not hesitate to ask our lead trader in the room by private message or on twitter to explain intra day decisions.
The diagonal trend-lines are marked on main chart above.
Current Algo Targets:
Per previous report on Monday and notes above; be very cautious of the targets this week – trade is very near very important resistance AND the price action of crude oil is not acting in its natural state. No target on the charting is considered an official call in any way – price action is going to have to return to a normal state (as I mentioned last week Monday, this is the first time this has occurred since my inception). If trade action sorts itself out mid week I will then re-chart and send members official calls.
I have added secondary targets to the report as noted above and on chart – but these are not alpha targets so they are not official calls.
Tuesday Feb 14 – No official call, refer to chart.
Wednesday Feb 15 – No official call, refer to chart.
Friday Feb 17 – No official call, refer to chart.
Oil Intra-Day Algo Trading Quadrants (white dotted lines):
Intra-day trading quadrants are available on all time – cycles and all of them are not detailed on this charting. The charting above represents the 30 minute trading quadrants. If you require tighter time-frames please email us and we will update charting for the time cycle you are looking for.
Trading quadrants are simply support and resistance lines that can assist your intra-day trading – they are not alpha or primary support and resistance by any measure. Price action does however typically move more assertively when leaving a trading quadrant.
Indicator Methods:
As explained above, my algorithm is a consideration of up to fifty traditional indicators at any one time – each one given its own weight in accordance to its accuracy (win rate). This is how we establish the probability of specific targets hitting (we call them alpha algo targets).
Alpha Algo Targets, Algo Trend-lines, Algo Timing, Quadrants for Intra Snipes:
Algo targets are the red circles – they correspond with important times each week in oil reporting land. Tuesday 4:30 PM, Wednesday 10:30 AM and Friday at 1:00 PM. The red dotted diagonal lines are the algo trend-lines. And the vertical dotted (red or green) are marking the important times each week. You will find that the price of crude will hit one of the alpha algo targets about 90% of the time. In the absence of market direction the machines take price to the next algo line and/or target. Understanding how the price of crude reacts to the algos and how they move price from target to target is critical for intra-day and swing trading crude oil and associated instruments.
You will notice that price action of crude will use these algo trend-lines and act as support and resistance, and that price also often violently moves when an alpha algo line is breached either upward or downward.
We cover this in much more detail in the member updates, trading room. A review of my Twitter feed and previous blog posts will help you understand the relation of these indicators. We will start posting video blogs (for my subscribers) on YouTube (in addition to my daily blog posts) for swing traders that work during regular trading hours.
Also… we will cover how to establish algo trend-lines and price targets future forward (as you have seen me do on my Twitter feed for some time now).
Conclusion:
See you in the live trade room! And again, if you struggle to know how to use these indicators as a trader’s edge, it is recommended (if you have earnestly reviewed all of our documentation first) that you obtain private coaching prior to trading a real account with real money – we recommend you use a paper trading account at first. And finally, we will be publishing a “how to use guide” soon, but it will be simply be a recap (consolidation) of instructions in this post, from my Twitter feed, and previously published information on our blog and website. You can also send specific questions to our email inbox at [email protected] – if you do this be sure to ask a specific question so it can be answered specifically. When the 24 hour oil trading room opens you will have ample opportunity in that 24 hour room to ask questions also.
Watch my EPIC the Oil Algo Twitter feed for intra day notices and your email in box for member only material intra day also.
EPIC the Oil Algo
PS If you are not yet reviewing the daily post market trading results blog posts, please do so, they are on the blog daily and often there is information that also may assist your trading. Trade room transcripts (for example) may review topics pertinent to your trading.
Article topics: EPIC, Oil, Algo, Crude Oil FX: $USOIL $WTI, $USO, $UCO, $CL_F, $UWT, $DWT, $ERX, $ERY, $GUSH, $DRIP, Chart, Algorithm, Indicators, Fibonacci