EPIC V3.1 Crude Oil Machine Trading Software Code Upgrade Details | White Paper Update
April 19, 2020
EPIC crude oil machine trading software is a proprietary software development project with an aim to trade crude oil futures. Historical reference can be found at the linked document below.
Click here for the original white paper drafts for EPIC V3 Crude Oil Machine Trade Software.
This white paper update is specific to the EPIC V3.1 software coding update completed for live trade use commencing April 19, 2020.
Purpose of Software Update
In recent crude oil futures trade, specifically since the COVID-19 black swan event, the trading price range and volatility of oil trade (OVX) has been divergent of historical structure.
See chart below: Crude Oil Volatility Index (OVX) chart showing oil trade volatility spiking from the 20s to 330s during black swan event.

Impact to Software
The volatility in trade and the range of price negatively impacts the smaller range of accounts our software may trade at any given time. More specifically any account trading CL futures less than 10 contracts or approximately 100,000.00 in size is at significant risk. At 10 contract size to 30 contract size the risk is considerably mitigated but still present and at 30 contract size or greater the risk is almost completely eliminated.
While markets are functioning within historical normal trading ranges this is not the case, a 10 contract size account is at very low risk with EPIC V3 software and micro accounts (anything smaller than 10 contracts) there is moderate to considerable risk (the smaller the account the more risk).
Remedy of Risk
Our coding team has performed an update to the EPIC V3 software to trade a base account size of 30 contracts (300,000.00 USD or greater) to allow for greater range of trading price and volatility.
The software instructions for the most part have not changed, the original EPIC V3 protocols remain per previous white paper linked above – at the start of this document.
What is different is simply the size of account as the base case instructional presumption within the code which allows for the software to trigger in smaller “dot plots” within various trading ranges and structure.
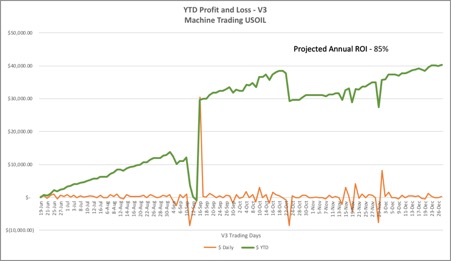
Projected Returns
The projected returns annually are expected to drop to a base case scenario of +-40% in an extremely volatile market as we are witnessing since the on-set of COVID-19, however, in times of less volatility we expect this will significantly advantage the EPIC V3.1 updated software and annual returns are expected to well exceed EPIC V3 software coded for a 10 contract base case scenario.
Put simply, the larger the account the more advantaged (refer to the original white paper for further code instruction detail).
At times when crude oil trading price range and volatility return to “normal” conditions we expect returns to easily exceed 100% per annum, however, all return expectations at this juncture are only predicted results based on in-lab testing and not real-world trade. All return estimations and projections are simply theoretical until proven otherwise.
Our oil trade alert clients can refer to the document below for more detail pertaining to the alerts service;
Business Inquiries.
For information about oil trade alerts, oil trading room and oil trade reporting contact Compound Trading Group at [email protected].
For information about automated machine trading platforms contact our agent representative Richard Regan as follows:
CONTACT
Email [email protected]
Phone 1-849-861-0697
Follow
Others in this document series can be found here:
- December 10, 2023: EPIC Update: v6.1.1 Machine Learning Trade Software – Final Protocol Real World Results
- June 3, 2023: EPIC v4.1.1 Crude Oil Machine Trade Software White Paper | June 3, 2023
- March 28, 2022: EPIC v3.3 Crude Oil Machine Trade Software White Paper | March 28, 2022 Update
- January 7, 2021: EPIC v3.1.5 Crude Oil Machine Trade Software White Paper | Updated January 11, 2022 w/ Trade Execution Data
- June 4, 2020: EPIC V3.1.1 Crude Oil Machine Trade Software Update | June 4, 2020 White Paper #OOTT $CL_F $USO $USOIL
- April 19, 2020: EPIC V3.1 Crude Oil Machine Trade Software Update Details | White Paper #OOTT $CL_F $USO $USOIL
- December 29, 2019: How EPIC v3 Crude Oil Machine Trading Outperforms Conventional Trading
Article Topics; Crude, Oil, Trading, Algorithm, Machine Trading, DayTrading, Futures, EPIC, Trade Alerts, Oil Trading Room, $CL_F, $USO, $USOIL