Compound Trading Swing Trading Stock Report (with Buy Sell Signals on Select Chart Set-Ups) Sunday February 11, 2018. $ARRY, $ARWR, $CDNA, $XXII, $NAK, $SHOP, $SSW, $ITCI, $SENS, $HCN, $GTHX, $EXTR, $EDIT, $IPI, $XOMA, $MBRX, $SOHN, $PDLI, $LPSN, $LTRX
Email us at info@compoundtrading.com anytime with any questions about any of the swing trades listed below. Or, if we get bogged down private message Curtis in trade room or direct message him on Twitter. Market hours are tough but we endeavor to get back to everyone after market each day.
Notices:
This swing trading report is one in five in rotation.
Please note: With the recent pressure and market sell-off I am charting primarily wide-time frame set-ups. When the markets “normalize” I will update the best set-ups with shorter time-frame set-ups for swing trades as applicable.
The reports are in the process of upgrades to include buy and sell triggers identified on charting of select instruments that are nearing trade set-ups. The triggers (price and / or other indicators) will also be programmed in to our charting for attendees to the live trading room and alerts will flash on screen in the trading room. Additionally, the triggers will be buy / sell points for our traders to use as part of the alerts members may receive.
If you need help with a specific trade and the specific trading plan for your swing trade set-up let me know and as I have time I can help you form a swing trade plan that suites your time frame. If you need private coaching use our contact page and send me a note or email info@compoundtrading.com and we’ll contact you (sometimes there is a short waiting list).
When managing your trades with the reports keep in mind that you will have to invest an hour or two a week to check the indicators mentioned for buy and sell triggers.
Swing trading success, even with a service, does require “some” maintenance on the part of the user, although the new live alert service will take much of that burden off the user as we know many of our users have busy lives. It is the indicators lining up (set-up) that signal a trade long entry or an exit. In our case we rely heavily on MACD on daily or weekly (or Stoch RSI and Moving averages) but indicators we are basing our trade entry and exits on are listed with each trade so any user that does even moderate trade management will know when the indicator(s) have turn with or against the trade.
Intra-week you can always DM myself on Twitter or email with specific questions regarding trades you are considering for assistance. But it is critical that you attend to the maintenance of your signals at least once a week if not twice and set stops and preferably alarms so that intra-week you can enter or exit.
IF WE DON’T GET BACK TO YOU RIGHT AWAY it is usually because we are pressured with deadlines or are trading.
Using the real-time charts – as chart links are made available below, click on link and open viewer. To open a real-time chart beyond the basic “viewer” click on the share button at bottom right (near thumbs up) and then click “make it mine”. To remove indicators at bottom of chart (MACD, Stochastic RSI and SQZMOM) double click chart field area and double click again to return the indicators to the chart.
Newer updates below in red for ease.
Recent Compound Trading Videos for Swing Traders / Charting Set-Ups:
See You Tube for other recent video posts.
Swing trading setups Jan 18 $FB, $SPY, $CNTF, $CTIC, $RIOT, $AES ….
Swing trade stock setups Jan 19 $SPY, $GSUM, $DXY, $MIND, $XPO, $ICPT…
Swing trade / daytrade set-ups for wk of Jan 22 $SPY, $FB, $ROKU, $DXY, $JUNO, $BTC.X, $FATE …
CRITICAL time cycle decisions SP500 $SPY, Gold $GLD, Oil $WTI, USD $DXY, Bitcoin $BTC.X and more…
Swing trading ideas & how I am managing $SPY $SPXL trade, structural trading $XNET, $SQ, $GDX …
Technical charting lessons here at market open $HMNY, $XNET, $SPY, $SEII, $INSY, $SLCA
Jan 9 Swing trading set-ups $XNET mid trade technical review, $GSUM, $SLCA, $SPY, $TESS….
Live $XNET trade $4267.00 gain. Swing trade entry and chart set-up at 40:00 – 54:00 min on video.
Jan 8 Swing Trading Set-Ups $AYI, $SPY, $SQ, $VRX, $AXON, $BTC.X….
Market Open Jan 8 Live Chart Model “On the Fly” $VRX, $SPY, $BTC, $LITD, $MYSZ, $INSY
Jan 3 Swing Trading Set Ups $SPY, $SPXL, $LTCUSD, $GLD, $APRI, $MNKD, $INSY, $TEUM, $NTEC, $LEDS …
Jan 2 Swing Trading Set-Ups $BTC.X, $SPY, $GDX, $XOMA, $JP, $INSY, $MNKD, $NTEC, $SKT, $RENN …
Email us at info@compoundtrading.com anytime with any questions about any of the swing trades listed below. Or, if we get bogged down private message Curtis in trade room or direct message him on Twitter. Market hours are tough but we endeavor to get back to everyone after market each day.
Stock Pick Coverage
$ARRY – ARRY Biopharma
Feb 11 – $ARRY did in fact break-out of highs post earnings and with market sell-off and has done relatively well considering. When markets signal “calm” this will be a priority watch for a long.
$ARRY if symmetry holds on weekly chart the most probable target is 18.49 June 2019 but a bullish extension to 29.29 is possible. So I will be watching for either a break above 18.39 for the extension above or retrace to 13.46 region for a bounce. Alarmed and ready. I’m leaning toward a break-out to upside. If so I will model it on a shorter time-frame and publish a specific trading plan with buy and sell triggers.

Dec 31 – $ARRY trading 12.80 at highs – will wait for highs test to play out and then chart the model for a swing. MACD is turned up. This will likely conclude in a clear break-out but yet to be seen.

Dec 3 – Trading 11.15 with indicators indecisive. Watching the price action as SQZMOM may drop in to red here. Trigger alarmed for that area. Still above its 200 MA but struggling with 20 and 50 MA. Very indecisive with a lower high also.

Oct 25 – $ARRY trading 10.45 and we closed the long position near recent highs. All indicator pointing down with earnings in 13 days. Will very likely wait for earnings to consider a position.
Sept 11 – $ARRY Trading 10.90 premarket with all indicators bullish. Long Swing trade Fri.

$ARWR – Arrowhead Pharmaceuticals
Feb 11 – $ARWR weekly chart has price testing 200 MA and gap fill scenario completing. On watch over 200 MA.

Dec 31 – Trading 3.68 status hasn’t changed since Dec 3 chart review – it’s in a long trend coil at top of gap fill range. Will wait for this to conclude before charting a swing trade set-up.
Dec 3 – $ARWR trading 3.65 filled gap Stoch RSI trend down price needs to test MA and bounce for possible long. Indecisive. Alert set for trade set-up review at price meeting 100 MA or over 50 MA.

Oct 25 $ARWR Trading 3.82 with all indicators pointing down, price lost 20 MA on daily and earnings in 49 days. Watching for an indicator rerversal.
Sept 11 – Trading 3.11 and expect pull back for an MA bounce at 20 or otherwise. Watching for that set-up.
Sept 5 – Trading 2.86. Good follow-through since last report. Over 200 MA with all MA’s in bull form, post ER, MACD SQZMOM up against resistance soon at just above 3.00. Will watch how it handles resistance or catch a long on a pull back prior.

Aug 28 – Trading 2.58. $ARWR Over 200 MA watching for follow through. MACD SQZMOM and Stoch RSI trending up. #swingtrading
https://www.tradingview.com/chart/ARWR/7GYmLwsD-ARWR-Over-200-MA-watching-for-follow-through-MACD-SQZMOM-and-S/

$CDNA – Caradex
Feb 11 – $CDNA on weekly suggests a pop if price gets above 20 MA and stoch RSI turns up – but likely not a break-out until MACD crosses. Bottom line is it is on watch and I will alert as it proves out with a set-up for a swing trade.

Dec 31 – $CDNA trading 7.34 with resistance at 8.53 and daily wide range. Over 8.53 I may start long positions but well over 200MA so advantage is to the bears short term. I will chart a swing trade set-up when the resistance test concludes and a direction is chosen.

Dec 3 – $CDNA Trading 7.12 post earnings surprise well above MA’s with Stoch RSI high. Waiting on MA test for possible long. Earnings surprise -.015 vs. -.017.

Oct 25 – Trading 5.69 with earnings in 15 days. Many of our traders contacted me with thanks on this one and I didn’t execute on it. But good our traders got it. For now I am watching consolidation.
Sept 11 – $CDNA 50 MA about to breach 200 MA. Watching for price action confirmation for long.

$NAK – Northern Dynasty Minerals
Feb 11 – $NAK trading 1.05 with recent drop just can’t seem to get the job done. On watch over 20 MA on weekly chart. Will alert set-up if it forms, but for now it is pensive… but is over the 200 MA on weekly. If anything a trade using the 200 MA as support for a long to the 50 MA on weekly is possible – but not an A set-u IMO so I am waiting.

Dec 31 – $NAK trade concluded in a mid quad test 1.88 and between it and 200 MA now. Trade direction toward upper or lower apex.

$NAK chart time cycle peak is on about March 30 with upper apex price target at 3.45 and bottom at .28 – both very unlikely – so if trade is above mid quad 1.88 then your nearest likely sell trigger / test is 2.24 and below is 1.51 price target for swing trade.
$NAK Swing trading chart set-up with buy sell triggers. Advantage bears while trade under 1.88.

Here is the $NAK swing trading chart set-up link you can use for your trade:
https://www.tradingview.com/chart/NAK/WsSH4foF-NAK-Swing-Trade-Buy-Sell-Triggers/
MACD is turned down on the daily also – that is significant advantage to bears.
Dec 3 – $NAK trading 2.08 at diagonal Fibonacci trend line decision on daily chart and indicators are indecisive.
Buy / sell triggers: If it holds 1.87 and breaches diagonal Fib trendline upward then your targets are 2.25, 2.71, 3.49. If not your first target to downside is 1.50.
Alarms set at various triggers to assess for a trade.

Oct 25 – Trading 1.91 and up over all its ma’s except the 20 ma. Watching and studying this one some.
$XXII – 22nd Century Group
Feb 11 – $XXII weekly chart suggests if a bounce at or near 50 MA occurs then symmetry may be in play for an upside swing trade.
If that set-up forms structurally, I will chart the current chart conditions at that time and alert the trade set-up.
I really like the structure of the daily and weekly charting.

Dec 31 – $XXII Three excellent swing trading set-ups stand out on this chart. 200 MA, MACD and 20 MA breach of 50 MA. The green arrow shows when price breach 200 MA and when 20 MA breached 200 MA with price above that was a clear long signal. The orange arrows show when MACD, Stochastic RSI and Squeeze Momentum Indicators all turned up at same time – that is very bullish also. And the third long set-up was a “sidewinder” when price was above MA’s and 20 MA returned bullish to breach 50 MA with price above.

$XXII weekly chart modelled w fibonacci diagonal trendlines (quads), targets, moving averages.

Jan 1 – The primary buy sell triggers for swing trading the specific time-frame of the chart at hand are the mid quad support and resistance and top and bottom quads (shown as green or gray horizontal lines and in this case with white arrows). All the other horizontal fib lines can be used also as entries / exits and /or areas to trim profits as trade proves out.
The November 19 2018 time cycle peak on this weekly chart is 3.53 so any support Fib line (buy sell trigger) is reasonable to hold long as long as the support holds. You can bring the time frame down to daily or hourly and time the trade on when MACD curls up.

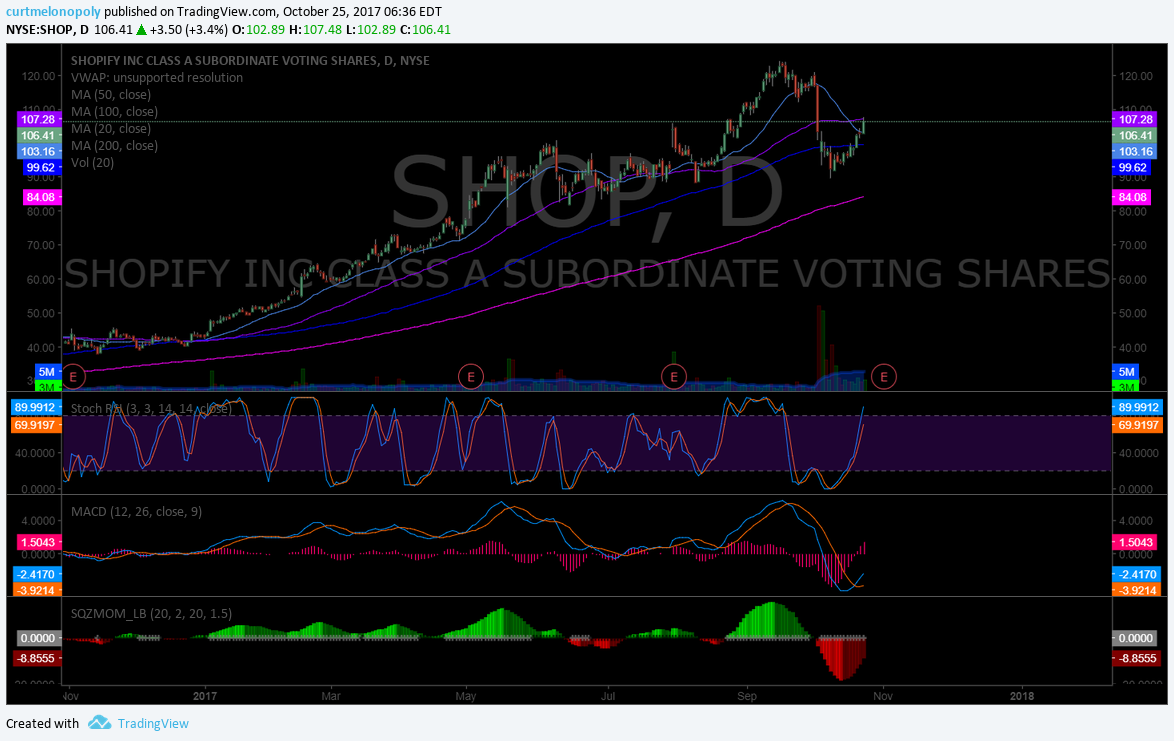
$SHOP – Shopify
Feb 11 – $SHOP with earnings around the corner this is a wait and see trade. Will be watching earnings very close.

Jan 1 – $SHOP The easiest and most predictable way to trade SHOP is with Stoch RSI being used as the buy and sell trigger on the daily chart. Great return on two week simple swing trade durations. Alarm set for when Stoch RSI curls back up (currently trending down).

Dec 3 – We have traded this successfully in the main wash-outs. $SHOP trading 103.27 with price mixed in MA’s. Will chart buy sell swing trade trigger signals when chart sets-up. Wait for a test of MA’s with bounce and MACD and SQZMOM trending up for a long and preferably enter long when Stoch RSI is near bottom and turned up.

$SSW – Seaspan
Feb 11 – The set-up below with $SSW (SeaSpan Corp) is on high alert with earnings right after the peak in the time – cycle. If markets settle here some this may be one of the better set-ups to at least this mid quad area of chart (purple arrow). Alternatively if under pressure it will target the downside target on chart at blue arrow.
$SSW very interesting set-up with Feb 27 time-cycle peak in play with earnings shortly thereafter. https://www.tradingview.com/chart/SSW/5twJVXHN-SSW-very-interesting-set-up-w-Feb-27-time-cycle-peak-earnings/ …

Link to previous chart published with detail on trade set-up / technicals https://www.tradingview.com/chart/SSW/c83a4j0C-SSW-Swing-trade-time-price-targets-buy-sell-triggers-notes/
Jan 1 – $SSW Swing trading chart on daily with time / price targets and buy / sell triggers.
Price trading above 200 day moving average (pink line) is bullish.
Price trending toward upper apex of quad (white arrow – red circle) and trending toward it at the right time in the cycle is more bullish than trade has been in recent time. It didn’t get there – but it was trending toward upper apex resistance and that is advantage bulls.
Price did not get to mid quad support (gray line – green arrow) – that is a bullish signal also.
Feb 22 2018 price time cycle peak bearish target 5.17 (light blue arrow – red circle).
Feb 22 2018 price time cycle peak bullish bias target is 8.54 at mid quad (green horizontal line – purple arrow).
Feb 22 2018 price time cycle peak full bullish extension price target is 11.94 (orange arrow – gray line). Not a likely target, but in the most bullish instance that is the full extension target in that trading quad.
All fib horizontal lines are support / resistance and act as buy/sell triggers. The quad walls (diagonal fib lines – dotted gray in this instance) are also support and resistance.
Trade above 200 MA favors bulls and long positions at support of fib line while price above 200 MA has excellent risk reward.
Caution as trade nears edge of quad wall – watch for scenario that trade trends down toward lower apex target Feb 22. If it doesn’t, this is a long play all the way.
I should note that this chart represents a simplified explanation of how to trade our most basic chart models (for those interested in trading with an assisted edge and where we are taking our #IA coding in new year also) #tradingprocess
https://www.tradingview.com/chart/SSW/c83a4j0C-SSW-Swing-trade-time-price-targets-buy-sell-triggers-notes/

Dec 3 – $SSW Seaspan trading 5.93 daily chart has downside bias Stoch RSI rise post ER and price didn’t follow against 20 MA. Watch near Dec 20 timing cycle.
This could easily go short for another floor down to 5.16 and then even 3.74 area without a lot of effort evern though price action “appears” to be forming a bottom formation. The bullish argument would see 5.16 as an excellent buy trigger – use extreme caution in that scenario (triggering long).
Buy / sell triggers for swing trading signals on $SSW:
8.53
6.76
5.16
3.74

$ITCI – Intra Cellular Therapies
Feb 11 – $ITCI holding up well considering market sell-off. On watch for swing trade with price over 20 MA on daily chart.

Jan 1 – $ITCI Daily stock chart trading 14.48 with indecisive MACD flat about to test 200 MA support with Stoch RSI trend down.
Wait for a bounce above 200 MA and Stoch RSI curl up and MACD turned up for a long. If that occurs I will chart the targets and buy sell triggers.

Dec 3 – Trading 15.35 it does have its 200 MA but indicators are indecisive / weak and 50 MA is overhead. When this changes I will chart the buy / sell signals and distribute.
Oct 25 – Trading 15.77 over 200 ma but under 20 and 50 ma’s. A break to upside of MA’s may be a long. Watching.
Sept 11 – Trading 21.39 against natural resistance with MA’s and indicators in bullish formation. Watching for res break.
Sept 5 – $ITCI Significant upside since last report – trading 18.67 in to gap over 200 MA – wait for intra-day pull back timing for entry long – on high alert and will likely trade early this week.
$SENS – Senseonics Holdings
Feb 11 – $SENS perfect mid quad target hit Feb 9 – will watch for direction and then trade in direction of next target noted for April 16.

Jan 1 – $SENS Daily chart with time price cycle targets, Fib support resistance buy sell triggers and moving averages.
- As we move toward time cycle on daily peak on Feb 7, 2018 watch for price to trend toward apex (green arrow) or inverse apex (red arrow) – that is your primary clue for trade (beyond the simple MACD on daily)
- I have added the Fib support resistance buy sell triggers for range between current trade and Feb 7 peak so that if trade is bullish you have more specific buy sell points you can watch as trade progresses.
- In a moderately bullish scenario 3.08 is very likely Feb 7 and the most upper apex target at 3.69 is not as likely but possible. Same would apply to bearish scenario below.
- How do you play it? Be sure MACD is turned up before a long entry and anything over 2.48 support at mid quad is a long – try and time long so that Stoch RSI is just turning back up and you are above a Fib support you can use as a stop loss (give your stop some room under the fib to avoid the machines hitting your stop).

Dec 3 – $SENS trading 2.85 w Stoch RSI turn down and test of important support 2.50 area near time price cycle termination. Big decision on-deck. #swingtrading https://www.tradingview.com/chart/SENS/G3xY86kE-SENS-trading-2-85-w-Stoch-RSI-turn-down-and-test-of-important-s/ …
$SENS Buy sell signals / triggers:
As Dec 4 time cycle approached price sold off to “hard” support pivot in 2.50 range to bottom of quad (previous quad hit top of range in 3.68 area). If 2.48 range is breached to downside near Dec 4 it is an obvious sell in to at least 2.20. There is however a possible 3.68 target potential nearing Feb 5, 2018 time / price cycle termination. My bias is to down near 2.20 or 200 MA that is just above (pink line).

Oct 25 – Trading 2.76 with earnings in 8 days. Popping off 20 ma support test with 20 and 50 ma’s above. On high watch here.
Sept 11 – Trading 3.18 against natural resistance with MA’s and indicators in bullish formation. Watching for res break.
Sept 5 – $SENS trading 3.11 with continued follow through since last report – above 200 MA w SQZMOM Stoch RSI MACD truned up. On Watch.

$HCN – Welltower
Feb 11 – $HCN did in fact dump and with earnings on deck the chart is nearing historical supports. On watch for earnings play.

Jan 1 – trading 63.77 under 200 MA with down-trending MACD and various indicators either bearish or indecisive. Watching.
Dec 3 – Trading 67.96 under 200 MA with indicators indecisive. I will continue watching for more conclusive signals either way.
Oct 25 – Trading 66.85 with all indicators down and price under all MA’s. May see considerable downside still before a bounce.
Sept 11 – Trading 74.50 against natural resistance with MA’s and indicators in bullish formation. Watching for res break.
Sept 5 – $HCN Trading 73.67 with all indicators trending up. Watching 20 MA possible breach to upside with price above.

Aug 28 – Trading 71.92. Over 200 MA watching for follow through. MACD SQZMOM and Stoch RSI trending up but under 50 and 100 Ma’s – on watch.
$GTHX – GT1 Therapuetics
Feb 11 – $GTHX trading 19.38 with MACD turned down targets 16.50 region Mar 15, 2018. #swingtrading
Jan 18 price target hit perfect – precision swing trade set-up – this chart is dialed in.

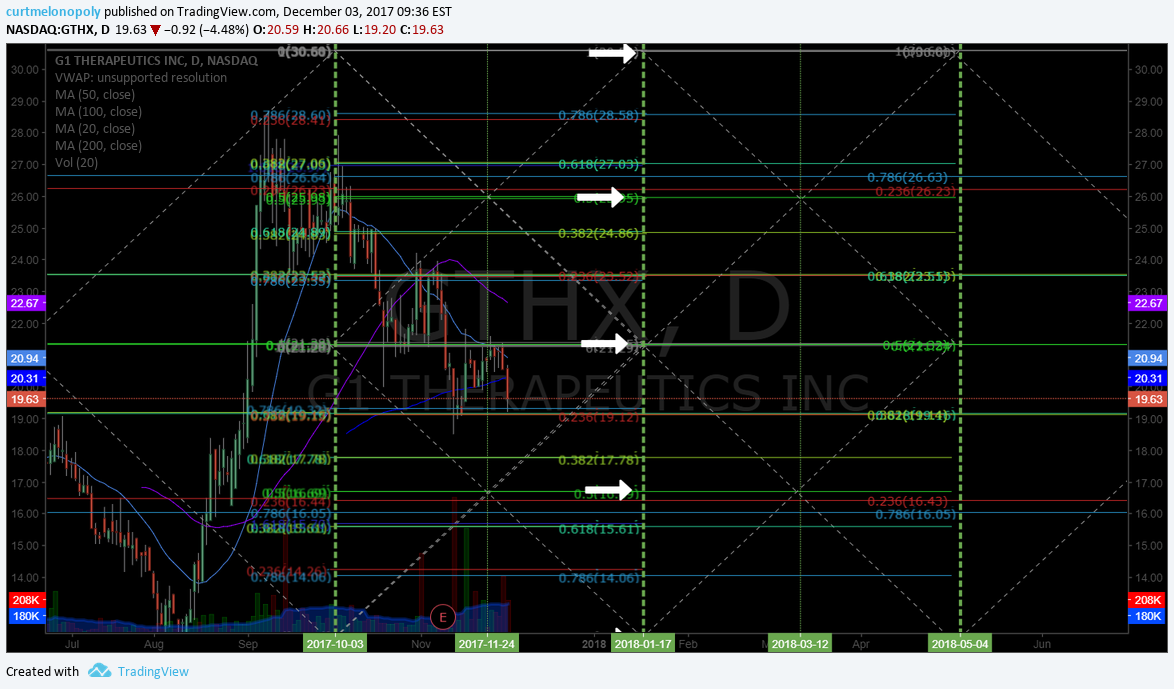
Jan 1 – $GTHX Jan 18 21.32 – 21.37 ish price target is in play considering MACD and Stoch RSI trending up on daily chart. #swingtrading
See Dec 3 charting notes below also.
Jan 1 live chart link here for $GTHX https://www.tradingview.com/chart/GTHX/vnnygP2N-GTHX-Feb-18-21-37-price-target-is-in-play-considering-MACD-and/

Dec 3 – $GTHX leading up to Jan 17, 2018 time cycle should provide decent trading range / volatility… and trend decisions going forward #swingtrading
* There are elements of “black box” charting on these $GTHX charts so be sure to use levels with a degree of caution until they prove out over time.
Important buy sell trigger points on $GTHX chart:
30.65
25.85
21.32
16.67
12.08
Important time price cycle termination dates to watch (price will tend to trend toward important buy sell triggers toward the time cycle expiry dates):
May 4, 2018
Mar 12, 2018
Jan 17, 2018
Nov 24, 2017
Oct 3, 2017


Oct 25 – Trading 21.40 with earnings in 14 days and all indicators bearish. Will wait for earnings.
Sept 11 – Trading 26.51, up considerably since last report and on continued break out. High probability of continued break-out.
Sept 5 – $GTHX A close over 20.63 previous high may get a sustained break out over. On watch.
Aug 28 – Trading Over what would be 200 MA and a relative new issue (IPO) watching for follow through. MACD SQZMOM and Stoch RSI trending up.
$EXTR – Extreme Networks
Feb 11 – $EXTR Chart structure is not easy to trade but model is holding up and trade targets for Aug 30, 2018 in play.
I will be watching for direction and market stability may provide for a really decent trade here.
Why Extreme Networks Inc. Stock Fell 14.2% Today,
Anders Bylund, The Motley Fool
Motley Fool, February 7, 2018
https://finance.yahoo.com/news/why-extreme-networks-inc-stock-155700511.html?.tsrc=rss

Jan 1 – I won’t go in to a lot of detail here about this chart other to say that the geometric shapes on it will provide tight trading support and resistance trading areas for daytrading or tight swing trading.
$EXTR Daytrading chart model on daily provides ranges of trade and bullish bearish price targets.

$EXTR Watch the MACD for a cross up and then long swing trade with resistance at 12.78 and target 13.48.
This is actually a fairly high risk reward swing trading set-up developing on $EXTR – if it tests and plays out it should go.

$EDIT – EDITAS
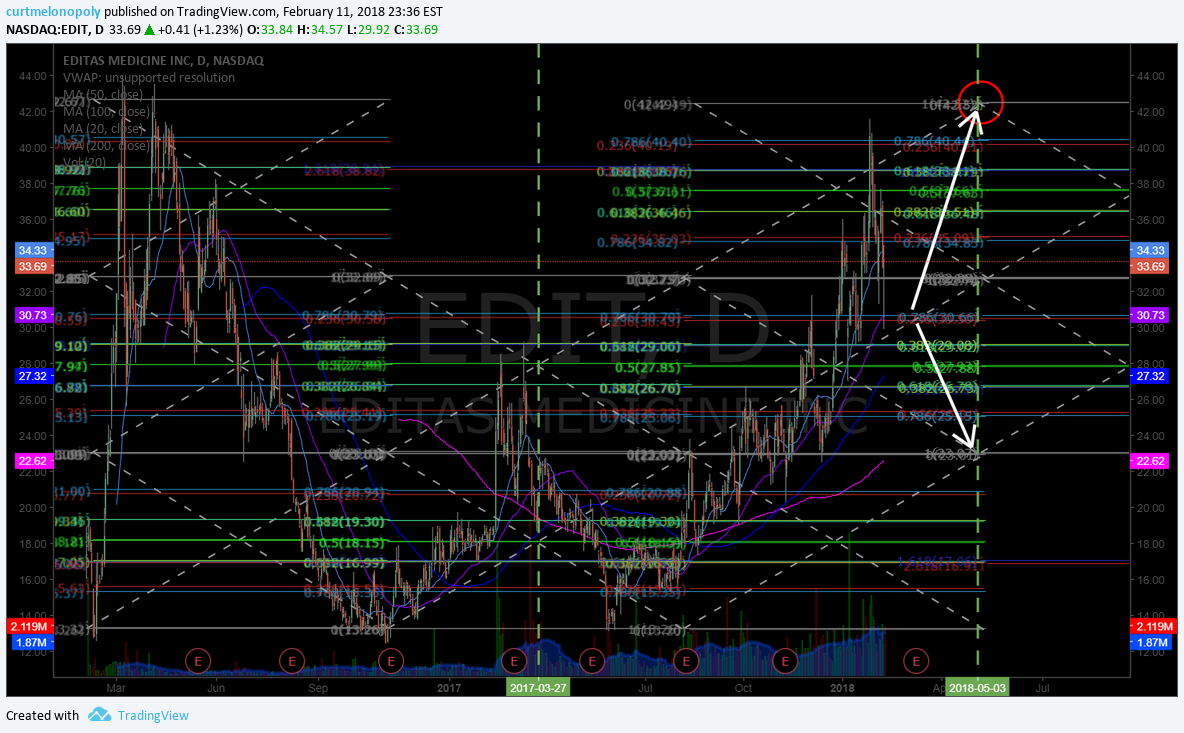
Feb 11 – $EDIT With earnings nearing the May 3 time cycle peak and symmetry on chart suggests a large move. Will wait for earnings to determine if upside or downside targets are in play then chart the swing trading plan in to the time cycle peak on May 3.

Jan 1 – $EDIT continues in bullish formation – safest swing trade wait for return to 20 MA (blue arrow) on weekly with Stoch RSI curl up.

Oct 25 – Trading 23.33 with earnings in 12 days and MA’s and indicators indecisive. Will watch earnings.
Sept 11 – Trading 20.09 – watching price action over 200 MA per below.
Sept 5 – $EDIT Trading 20.59 trading through MA’s on Daily – on watch.

Aug 28 – Trading 19.30 premarket. Waiting for MACD and SQZMOM to turn back up and run.
$IPI – Intrepid Potash
Feb 11 – $IPI on watch with price testing 200 MA and earnings Feb 28.

Jan 1 – $IPI chart is setting up really well for consistent swing trading results. The daily is a buy and the weekly 200 MA is an important resistance.
$IPI is trending bullish on daily with Stoch RSI very high and MACD trending up. Check MA’s on weekly for resistance.

This is an excellent risk reward to upside target. If trade unfolds I will chart further upside targets and model.

$MBRX – Moleculin Biotech
Feb 11 – trading 1.68 under 200 MA on daily. Indicators indecisive. Watching.
Jan 1 – Trading 1.86 with indecisive indicators. Will watch.
Oct 25 – Trading 1.93 and about to test 200 MA support on daily. Will watch 200 MA test.
Sept 11 – Trading 2.68 – same indications as below.
Sept 5 – $MBRX Over 200 MA set up and on pullback watch 100 MA breach for long.

Aug 28 – Trading 2.36. Over 200 MA on pull back waiting for MACD and SQZMOM to turn back up.
$SOHU – SOHU.COM
Feb 11 – $SOHU Trading 33.45 at historical support – needs to bounce here.

Jan 1 – trading 43.35 with poor / indecisive indicators. Will watch.
Sept 11 – Trading 54.22 – same indications as below – watching for MACD.
Sept 5 – Trading 53.93 – pulled back since last report. Watching.
Aug 28 – Trading 54.66. This is a trending stock over 200 MA and on pull back to 20 MA. Watching MACD and SQZMOM to turn back up.
$PDLI – PDL BIO Pharma
Feb 11 – Trading 2.40 with earnings on Feb 28 and all indicators are poor. Will watch.
Jan 1 – trading 2.74 with poor / indecisive indicators. Will watch.
Sept 11 – Trading 3.17 same indications as below. On close watch now.
Sept 5 – Trading 3.07 and against chart resistance. Watching.
Aug 28 – Trading 3.00. Over 200 MA with all indicators trending and filling a gap with natural resistance on deck. Watching for follow through.
$ESPR – Esperion Therapeutics
Feb 11 – $ESPR trading 69.46 with earnings later this month. Looks good for a trade post ER.
Jan 1 – $ESPR continues to trend on daily – watching for Stoch RSI to return to bottom with curl up for possible swing trade.

Sept 11 – Trading 49.46 with same indications as below. On watch.
Sept 5 – Trading 52.80 premarket with all indicators bullish – on high watch here.
Aug 28 – Trading 48.27. Over 200 MA trending and waiting for MACD and SQZMOM to curl up.
$LPSN – LivePerson
Feb 11 – $LPSN trading 11.20 under 200 MA with earnings in 10 days. On watch.
Jan 1 – $LPSN trading 11.50 continues to trend on 200 MA – on watch for set-up to form for swing trade.

Sept 11 – Trading 13.00 with same indications as below. Watching.
Sept 5 – Trading 13.60 premarket and MACD turned down. Watching when MACD turns back up for long.
Aug 28 – Trading 12.65. Over 200 MA trending and on pull back waiting for MACD and SQZMOM to curl up. Recently hit natural resistance so it is on test.
$XOMA – XOMA Corp
Feb 11 – Trading 25.46 with chart structure in challenge. Will advise as it plays out. Watching.
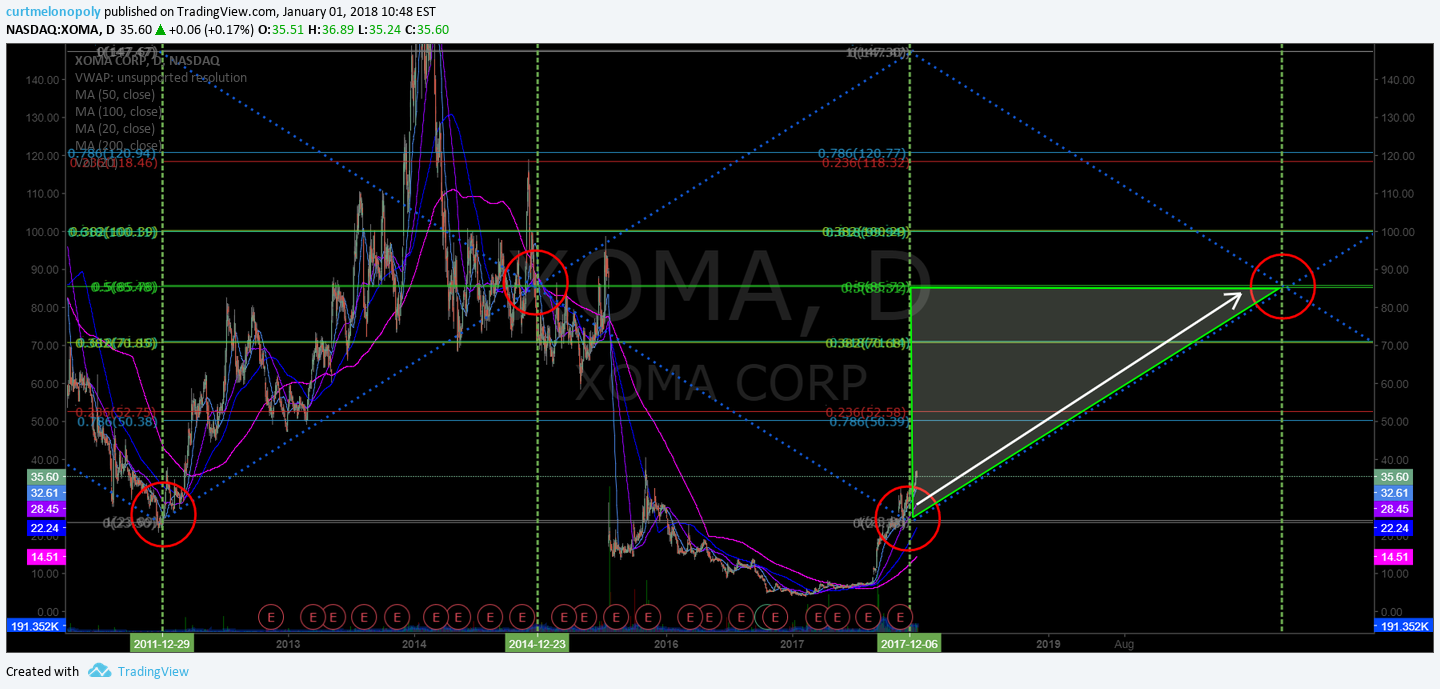
Jan 1 – $XOMA The symmetry in daily chart shows a clean swing trade long here if history holds or repeats.

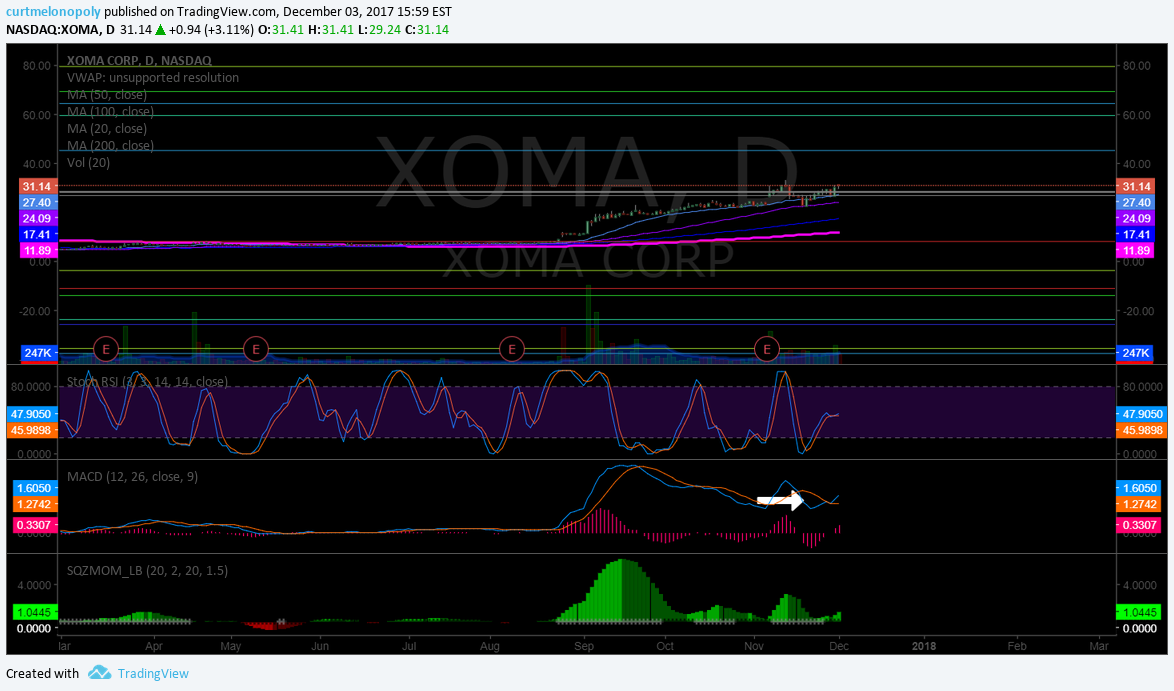
Jan 1 – $XOMA This chart provides a zoom in of all horizontal fib buy sell triggers and a trend line to follow Enter long near trend line use fibs as buy sell triggers and watch your indicators for a successful trade.

Sept 11 – Trading 18.10 with considerable upside since last report. On watch.
Sept 5 – Trading 11.50 premarket with good follow through since last report. Over 11.73 on watch for long.
Aug 28 – Trading 10.71. Had a large pop last week. Over 200 MA watching for follow through. MACD SQZMOM and Stoch RSI trending up. Daily volume is the main issue. Watching.
Email or DM me on Twitter anytime with thoughts or questions!
Cheers!
Curtis
Article Topics; Compound Trading, Swing, Trading, Stock, Picks, Signals, Buy, Sell, Triggers $SNAP, $ARRY, $ARWR, $CDNA, $XXII, $NAK, $SHOP, $SSW, $ITCI, $SENS, $HCN, $GTHX, $EXTR, $EDIT, $IPI, $XOMA, $MBRX, $SOHN, $PDLI, $LPSN
