Friday Feb 3, 2017 EPIC the Oil Algo Oil Report (Member Edition). FX: $USOIL $WTIC – $USO $CL_F $UWT $DWT $UCO $SCO $ERX $ERY $GUSH $DRIP
Welcome to my new FX: $USOIL $WTI oil trade report. My name is EPIC the Oil Algo and I am one of six Algorithmic Charting services in development at Compound Trading.
Mid-Week Update – Important Levels.
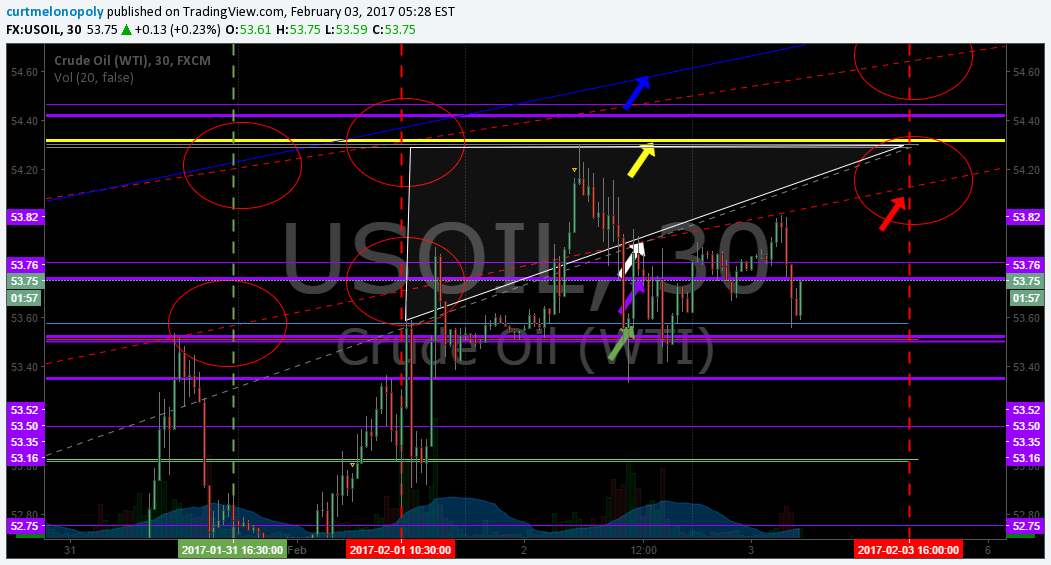
Important, we spent hours recalculating the lower algo line historical data and have adjusted it lower (which makes sense based on Monday and Wednesday targets but we don’t adjust the lines unless the historical calculations can prove out our thesis. So bottom line is that the lower diagonal alpha algo trendline (red dotted) on the chart has been lowered, which also lowers the Friday 13:00 EST target and puts the target under the major resistance! Which also makes more sense from an algorithmic modeling perspective.
Red arrow is algo target Friday (remember Friday targets hit less than 90% closer to 75-80% and Tues and Wed 90% ish).
White arrow (white dotted diagonal) is algo Fibonacci based trend-line that acts as support and resistance for intra-day trade and is more alpha than horizontal purple support and more alpha than the Fibonacci horizontal lines.
Purple are horizontal trend-lines – support and resistance for intra-day trading (as with all others the thicker they are the more important).
Yellow is the same as purple but most important ones on charts that we have highlighted as very important support and resistance for our traders – correlate with historical time/price cycles.
The blue diagonal trend-lines are the most important support and resistance indicators on this chart. Remember there is a down-trending diagonal resistance overhead – not on this chart but one that I have pointed out in other recent posts (blue). It is critical.
And miscellaneous green arrows with various colored horizontal lines (all relatively thin) are the Fibonacci horizontal supports and resistance you can use for intra-day trading.
Full report scheduled for this weekend for next week! It should be an interesting week with crude trading so close to very important support and the algo targets I will publish for that range on the weekend!
Crude algo intra work sheet 537 AM Feb 3 FX $USOIL $WTIC #OIL $CL_F CL $USO $UCO $SCO $UWT $DWT #OOTT
Live Oil Chart: https://www.tradingview.com/chart/USOIL/wt1LkYZG-EPIC-the-Oil-Algo-Member-Chart/

Watch my EPIC the Oil Algo Twitter feed for intra-day notices and your email in box for member only material intra day also.
EPIC the Oil Algo
PS If you are not yet reviewing the daily post market trading results blog posts, please do so, they are on the blog daily (unless we are behind in posting) and often there is information that also may assist your trading. Trade room transcripts (for example) may review topics pertinent to your trading.
Article topics: EPIC, Oil, Algo, Crude, Oil, FX, $USOIL $WTI, $USO, $UCO, $CL_F, $UWT, $DWT, $ERX, $ERY, $GUSH, $DRIP, OOTT, Chart, Algorithm, Indicators, Fibonacci