How to Trade $NFLX Move
Trading the $NFLX Move (Technical Chart Set-up)
Below is part two – a follow-up to our previous alert. *Apologies* We lost this post to an infrastructure bug, hence why it has been sent out again.
Our Trade Alert in Review.
We posted the $NFLX alert in premarket this morning based on news: https://tech.economictimes.indiatimes.com/news/internet/india-is-a-key-part-of-international-subscription-growth-netflix-ceo-reed-hastings/63074364
At time of our alert, NFLX opened at 288.75.
$NFLX closed the regular session at 294.16 for a gain of 1.87% on the day from its opening price.
Your Trade Set-up.
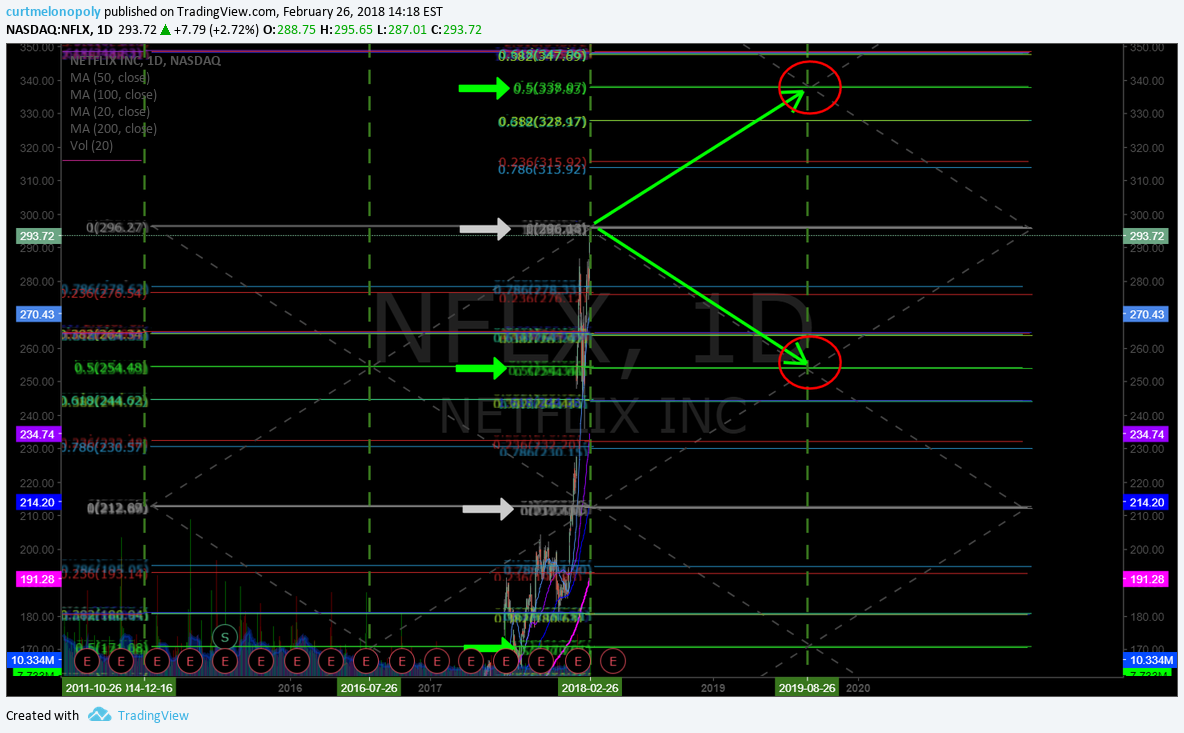
Here is the basic structure of the $NFLX chart set-up for swing trading (or day trading) the move.
Real-time $NFLX chart link: https://www.tradingview.com/chart/NFLX/GRp4Tv9v-NFLX-Netflix-swing-long-above-295-83-targets-337-92-or/https://www.tradingview.com/chart/MOMO/SWdmgJ1n-How-to-trade-MOMO-setup-on-chart-price-targets-swingtrading/

Swing Trading the Move:
Bullish Option: Long to first target at 339-342 if price breaches 293.72
OR if price fails;
Short to price target in the 255-265 range.
Refer to time – price cycle noted on the chart on August 26, 2019.
Part One of Post:
Testing Previous Highs in #Premarket by curtmelonopoly on TradingView.com
—
Did you find value in this setup? Our Swing Trading Newsletter Service is only $1.99 for the first month ($119/mo. thereafter). Click here to learn more

