Welcome to Compound Trading Swing Trading Report Sunday April 29, 2018 Part A; $AMBA, $COTY, $FSLR, $AAOI, $HIIQ, $CELG, $LITE and more …
Email us at info@compoundtrading.com anytime with any questions about any of the swing trades listed below. Or, if we get bogged down private message Curtis in trade room or direct message him on Twitter. Market hours are tough but we endeavor to get back to everyone after market each day.
Notices:
Good day!
This swing trading report is one in five in rotation. This is part A and part B will follow soon.
The reports are in the process of upgrades to included buy and sell triggers identified on charting of select instruments that are nearing trade set-ups. The triggers (price and / or other indicators) will also be programmed in to our charting for attendees to the live trading room and alerts will flash on screen in the trading room. Additionally, the triggers will be buy / sell points for our traders to use as part of the alerts members may receive.
If you need help with a specific trade and the specific trading plan for your swing trade set-up let me know and as I have time I can help you formulate.
When managing your trades with the reports keep in mind that you will have to invest an hour or two a week to check the indicators mentioned for buy and sell triggers.
Swing trading success, even with a service, does require “some” maintenance on the part of the user, although the new live alert service will take much of that burden off the user as we know many of our users have busy lives. It is the indicators lining up that signal a trade long entry or an exit. In our case rely heavily on MACD on daily or weekly (or Stoch RSI and Moving averages) but indicators we are basing our trade entry and exits on are listed with each trade so any user that does even moderate trade management will know when the indicator(s) have turn with or against the trade.
Intra-week you can always DM myself on Twitter or email with specific questions regarding trades you are considering for assistance. But it is critical that you attend to the maintenance of your signals at least once a week if not twice and set stops and preferably alarms so that intra-week you can enter or exit. If nothing else you can always book some coaching time and I’ll assist also (although we are at a point of waiting list for the coaching, at minimum you can get on list or for immediate help as I said please DM or email).
IF WE DON’T GET BACK TO YOU RIGHT AWAY it is usually because we are pressured with deadlines or are trading.
As live charts are made available below, click on link and open viewer. Then to use chart yourself click on share button at bottom right (near thumbs up) and then click “make it mine”.
To remove the indicators (MACD, Stochastic RSI, Squeeze Momentum Indicator represented at bottom of chart) double click on chart body – and same to return the indicators.
If you receive a report and you are not subscribed to the specific service it is a complimentary issue..
Our apologies if you receive more than one copy – it means you are on more than one subscription list. We are working to resolve this issue.
Newer updates below in red for ease.
Recent Compound Trading Videos for Swing Traders / Charting Set-Ups:
See You Tube for other recent video posts.
Do Not Ignore This Trade Set-Up | $AMBA Swing Trade | 40% ROE 3 Mos (Part 1 of 2)
Part 2 – The Battle Plan | How to Trade the $AMBA Move https://compoundtrading.com/do-not-ignore-this-trade-set-up-amba-swing-trade-40-roe-3-mos-part-1-of-2/
Password: ELON Protected: How to Trade the Tesla Move | Price Targets | Buy Sell Triggers | Time Cycles $TSLA #swingtrading #daytrading
Password: LONG Protected: Overnight Oil Trade | Trading Plan in Detail | EPIC Oil Algorithm $USOIL $WTI $CL_F #OIL $USO #Alerts
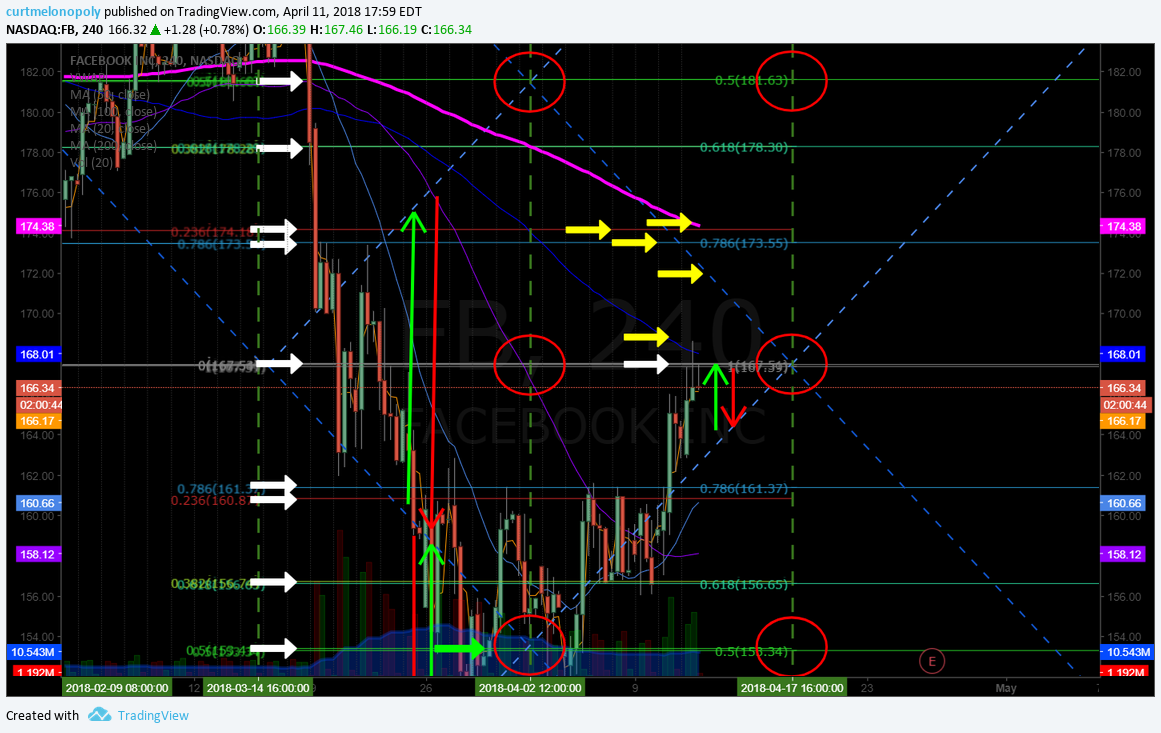
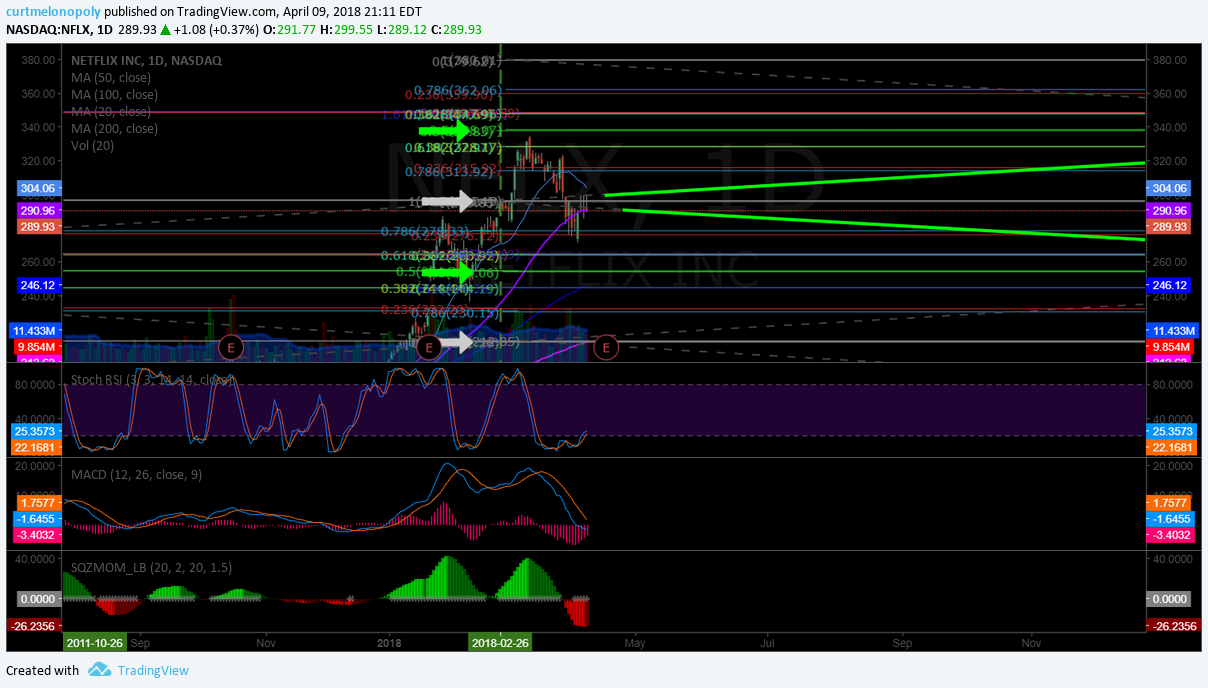
Trade Set-ups $SPY, $NFLX, OIL, $WTI, $ESPR, $GOOGL, Bitcoin, $BTC, $FEYE, $AAPL and more.
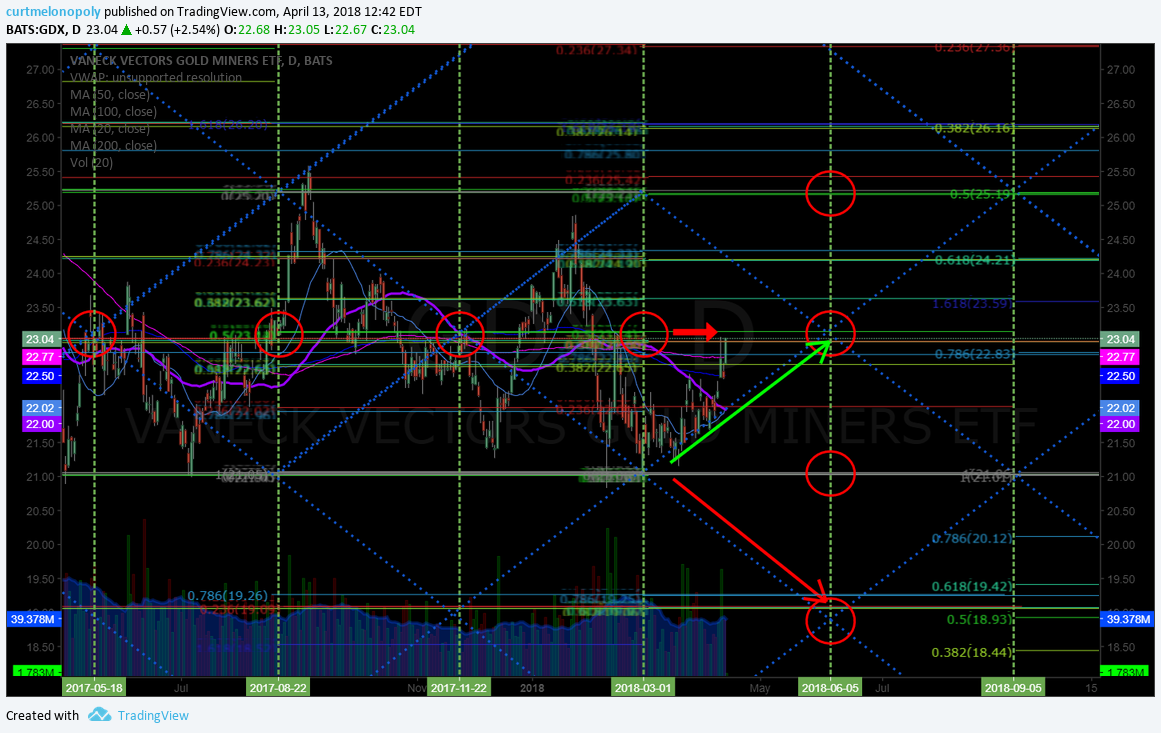
Trading Set-Ups $SPY, Gold, $GC_F, $GDX, Bitcoin, $GOOGL, $EVLV, $HEAR, $CHEK, $MARA, $PRTA, $ZDGE
Trading Set-Ups $NETE, $TSG, $ETH Ethereum, $BTC Bitcoin, $TAN, $HEAR, $AMMJ, $SNAP, $VLRX
Trade Set-Ups OIL, $WTI, $SPY, $GOOGL, $FSLR, $AXP, $GREK, $CELG, $AAOI, $SDRL, $WFT
Email us at info@compoundtrading.com anytime with any questions about any of the swing trades listed below. Or, if we get bogged down private message Curtis in trade room or direct message him on Twitter. Market hours are tough but we endeavor to get back to everyone after market each day.
$AMBA – Ambarella Inc.
April 29 – I published a two part special report on the $AMBA swing trade, you can find them below. As the trade proves out I will post member exclusive set-ups and alerts. Could be a good one here.
Do Not Ignore This Trade Set-Up | $AMBA Swing Trade | 40% ROE 3 Mos (Part 1 of 2)
Part 2 – The Battle Plan | How to Trade the $AMBA Move
Summary of the trade set-up on AMBA:
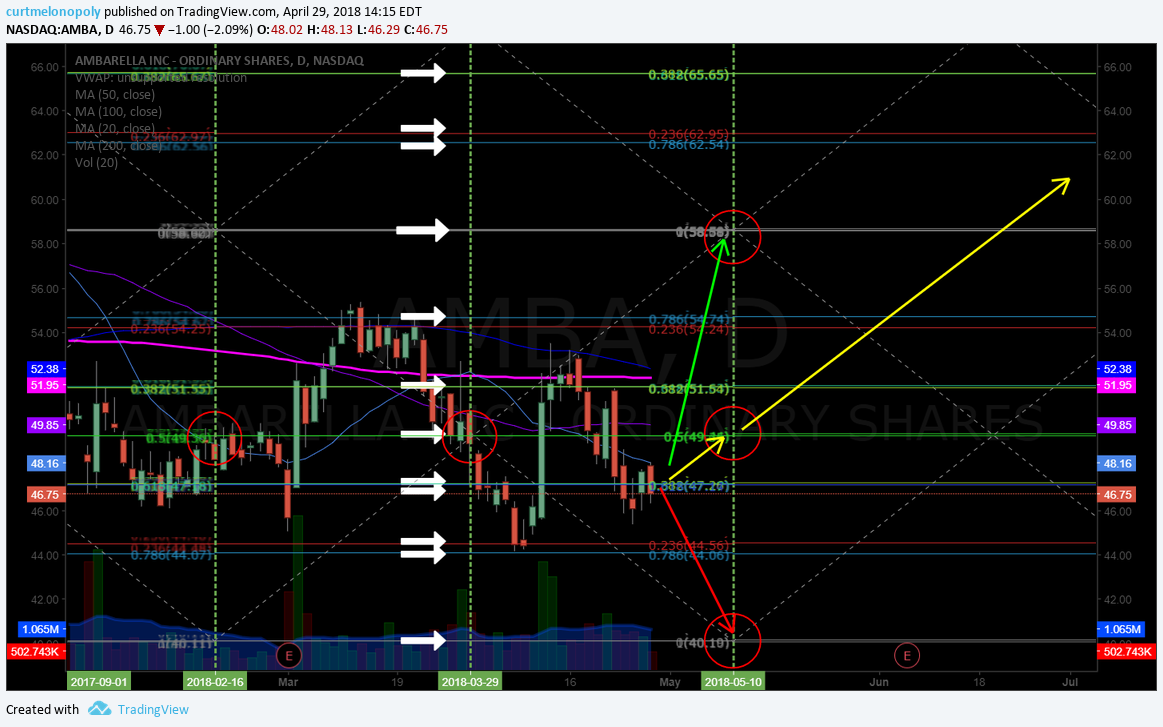
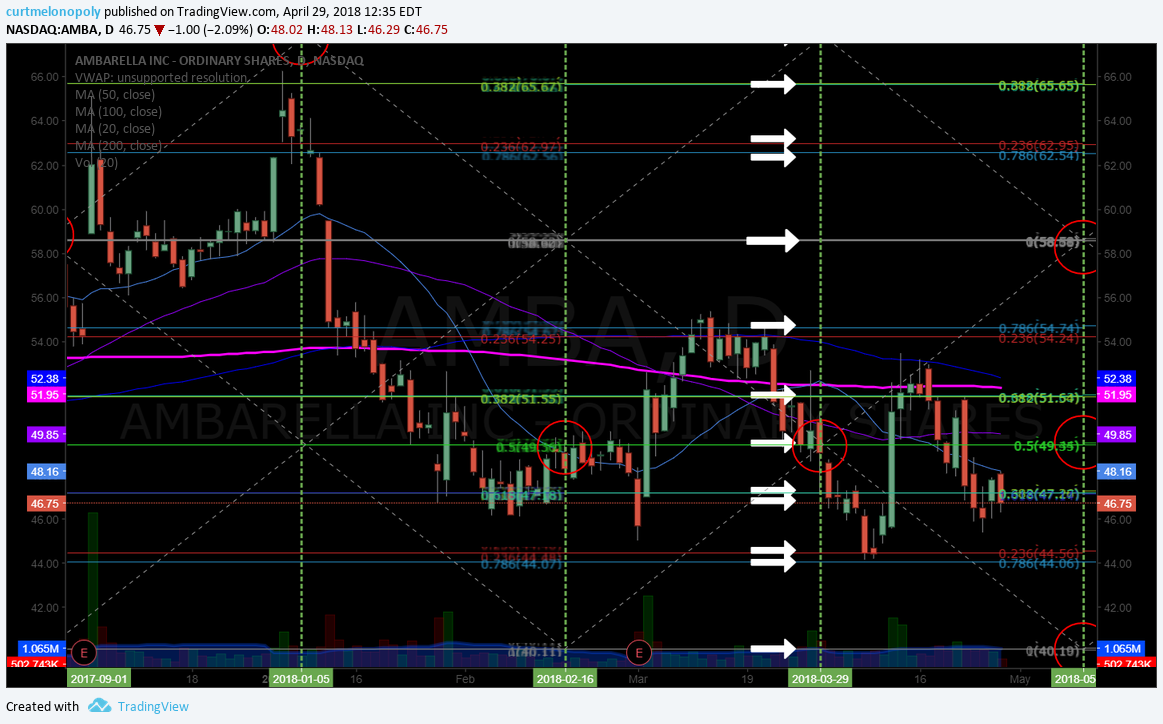
$AMBA closed April 27 at 46.75.
Trend Change: This set-up is a long over 49.50 (if 49.50 area is held) for a major trend change to the upside. Resistance is at 51.50 area in this scenario (trim in advance and add over).
or for Active Trading: This is a long over 47.25 in to resistance near 49.40 (trim in advance and add over).
Be sure to trim longs in advance of that and then if resistance is breached add over that to the next resistance and then rinse and repeat. The horizontal fib lines on the chart show you support and resistance points.
On the short side for a day trade… Friday’s close was 46.75 and the next support is in the 44.55 range… so if there is pressure on the stock in premarket or at open Monday then a short in to the 44.55 support may work out. But be cautious, this thing has science all over it saying that a snap-back is very possible and it should be vicious when it starts.
Support and Resistance Levels – I’ve made the chart easy to manage visually by adding white arrows to each major support and resistance level. The white arrows are your primary buy sell triggers.
Note also the “trading quad walls”. These are Fibonacci based diagonal trend-lines that form a trading structure “quadrants”. They also act as support and resistance.
The red circles are price targets. The price targets for June 10, 2018 time cycle peak are 58.60 (bullish), 49.40 (moderate), 40.13 (bearish). Trade in accordance to price action toward the appropriate target. It is paint by numbers trading – just follow the rules and if your trade fails be sure to cut losses quickly and be ready to turn with price as needed. Trust the plan.
The MOST INTERESTING THING about this set-up is the possibility for a trend reversal based on a simple wash-out down trend with a snap-back that could see a significant three to six month trend to the upside.
In Part 3 (for our Swing Trading Members) I will cover that scenario for significant gains should that transpire.
Also… pay attention to the downside bearish scenario playing out here. If that occurs I will do a Part 3 specific to that and include a detailed trading plan.
My Personal Earnings Rule: 95% of the time I will not hold in to earnings. Trade your plan however you wish.


Mar 21 – $AMBA swing trade technically perfect 54.72 targets 58.66 Mar 30 . Chart Notes.
https://www.tradingview.com/chart/AMBA/rOpynBS5-AMBA-swing-trade-technically-perfect-54-72-targets-58-66-Mar-30/ #swingtrading #pricetargets

Feb 20 – $AMBA over 49.40 is a buy and below a sell – currently testing support resistance area.

Feb 20 – $AMBA Not a great risk reward chart set up here with MACD and SQZMOM up and Stochastic near top. #trading

Jan 7 – $AMBA: path of least resistance here is a pull back to 58.61 but the indecisive target may play out 67.82 per below and I believe the bullish target is a challenge. But trade in direction of target / price trajectory and trend using the triggers on the chart.
$AMBA Just shy Jan 5 bullish target 67.78 trading 63.62. Feb 15 time cycle peak has 77.08 bull, 67.82 indecisive, 58.61 bearish pull back for targets. Buy / sell swing trading triggers between targets at white arrows. Swing in direction of target trajectory #swingtrading
Real time charting link to $AMBA swing trading chart with buy / sell triggers and price targets on time cycles.
https://www.tradingview.com/chart/AMBA/iePm04YG-AMBA-Just-shy-Jan-5-bullish-target-67-78-trading-63-62-Feb-15/

$AMBA Weekly chart provides perspective on clean trade through time price cycle targets at upper lower quads #tradingedge #swingtrading

Dec 6 – $AMBA trading 57.57 after post earning pop – take long at MA bounce or Fib bounce and trim at each extension up. #swingtrading
Buy triggers (wait for a Fib buy trigger support to hold and bounce off one for a long)
49.45
51.70
54.66
57.57 trading at now
58.56 main resistance (you can use this as first sell trigger trim
63.00 sell triggers start (trim longs starting here or at main resistance above)
65.68
67.53
$COTY
April 29 – This $COTY chart is a nightmare, will likely bounce to 200 MA soon. But I may discontinue coverage soon also. Watching.

Mar 21 – $COTY back to 200 MA test – wait for MACD to turn and trade long – very predictable #swingtrade
The trade velocity (ROE) is one of the best we follow, and the MACD turn up and down does it. Good annual performance on this simple indicator trade with MACD turn on the daily chart.

$FSLR – First Solar
April 29 – $FSLR trading closed Friday 77.90 and is in break-out on the daily. We’ll look at the weekly and find resistance to watch for.

April 29 – $FSLR on the weekly chart – between here and 86.00 imo is pensive… however, it seems to have the indications to do it. Over 86 long. If I had to predict what’s next… the pull back is near and at each turn up after a pull-back it’s a long. And then if and when it gets up over 86.00 it’s a structured trade to the upside. At that point (over 86.00 held) I will chart the trade structure with specific lower time frame support and resistance and price targets along with time-cycles etc.

Mar 21 – $FSLR other side of earnings great trade here… and the 20 MA and 50 MA with 20 breaching – really bullish.

Mar 21 – $FSLR 78 should see 88 on weekly chart. #swingtrading https://www.tradingview.com/chart/FSLR/Cp3Ga5Nq-FSLR-78-should-see-88-on-weekly-chart-swingtrading/

$AAOI – Applied Opto Electronics Inc
April 29 – $AAOI closed the session Friday 33.76 above main trading area support around 27.50
This $AAOI chart went out to the private server on April 23, 2018;
$AAOI over 32.90 targets 39.18 then 40.66. Watch for 50 MA overhead. (purple)
$AAOI over 20 50 100 MA, indicators trending (MACD, Stochastic RSI, SQZMOM, above mid quad Fibonacci diagonal support are all bullish. Watch quad Fib downtrending trendline, FIB horizontal resistance lines and especially 200 MA on way to July targets.
I prefer the upper target as long as trade can breach the 200 MA.

$AAOI News: SUGAR LAND, Texas, April 18, 2018 (GLOBE NEWSWIRE) — Applied Optoelectronics, Inc. (AAOI), a leading provider of fiber-optic access network products for the internet datacenter, cable broadband, telecom and fiber-to-the-home (FTTH) markets, today announced that it will release financial results for its first quarter ended March 31, 2018 on Tuesday, May 8, 2018.
$AAOI News: Applied Optoelectronics, Fiber-optic network provider Applied Optoelectronics Inc (NASDAQ: AAOI) has been a regular on the FIS Astec list for months. Utilization jumped 23 percent last week, pushing short interest up to 92 percent of available shares.
Mar 21 – $AAOI Sitting on 200 MA on weekly chart. If it bounces watch for 20 MA upside resistance. #watchlist #swingtrading
This is my nemesis from 2017 and now in to 2018. I am absolutely convinced this will run to at least the mid 45s this year, if not more. Earnings will be the turn imo (at latest) in about 45 days ish.
At least I admit the conviction trade struggles 🙂

$HIIQ – Health Ins Innovations
April 29 – $HIIQ under pressure with ER in 3 days. Bias to a downside dump in to earnings and upside targets 31.15 maybe 35.70 Aug 10 – but post earnings price action will tell the story.

Mar 21 – $HIIQ What a sweet trade for our swing trading members…. hit first and second targets near perfect boom town. #swingtrading #tradingtowin

Mar 21 – The way to trade this now is wait for the MACD to turn back up and long it to the nearest resistance notes in white arrow on chart above. Really bullish and no reason to fight the trend.
$HIIQ swing trading plan levels to watch – swing high with MACD turn to targets until MACD turns down.

Feb 20 – $HIIQ targets 35.70 or 40.10 May 16 as bullish scenario. #stock #chart #swingtrade
The lower of two target scenarios from last report played out (white directional arrows).

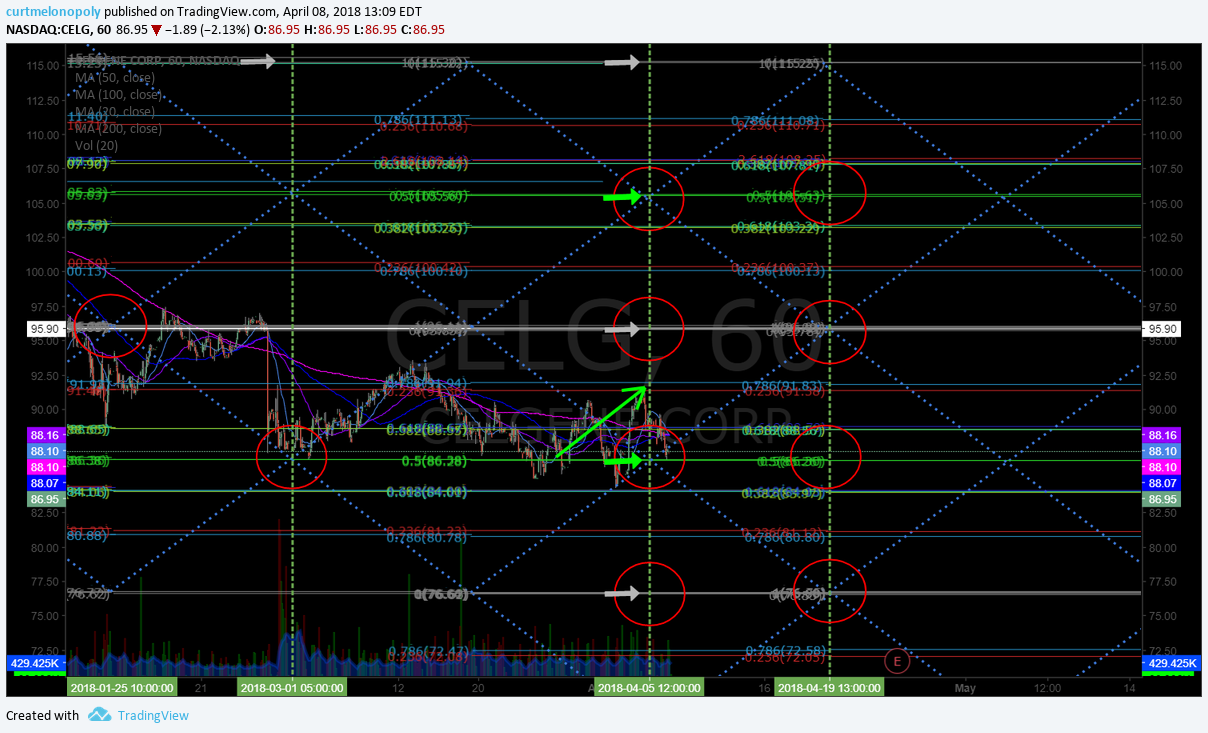
$CELG – Celgene
April 29 – $CELG with earnings in 4 days. Upside bias 105.41 downside 86.09 June 9 time cycle pending earnings price action.
Of special note with this set-up is where trade closed Friday (91.18). This specific area of the chart is a volatile area (see yellow circles to left). There are large gaps between Fib support and resistance areas. Prepare for volatility in to earnings.
I think it’s likely we see lift in to earnings. But as always trade price direction in to most logical target between support and resistance as noted on chart.

April 8 – $CELG 86s to 91s off real-time alert, buy sell trigger now. Looking for next price target in time cycle. #swingtrading
Trade wasn’t bullish enough to get to last price target BUT nonetheless it was a decent buy side trade alert in to the most recent time cycle.
Refer to my last real-time swing trading alert post on $CELG here: https://www.tradingview.com/chart/CELG/RwZItPb8-CELG-hit-last-price-target-targets-95-90-Apr-3-Chart-notes/
Now trade is sitting right on top of a mid quad price support (signalling a decision area). When price exits a time cycle and is at the mid quad this signifies the bull bear fight at the buy sell trigger. If it was trading / trending under I could confidently alert a short side trade in to the next time cycle. The same works above the quad support to the next upside bullish price target in to the next time cycle. In this instance, trade is not signalling yet which way we are going.
I will real-time alert the set-up as it concludes over the coming days.
My personal trader bias is short in to next downside price target in to next time cycle peak (see vertical dotted green lines for time cycle conclusions).

1:21 PM – 8 Apr 2018 $CELG 86s to 91s off alert, buy sell trigger now. Waiting for trade direction triggers. Chart Notes. https://www.tradingview.com/chart/CELG/gdKoFxEq-CELG-86s-to-91s-off-alert-buy-sell-trigger-now-Chart-Notes/ …
https://twitter.com/SwingAlerts_CT/status/983031984753692672
5:56 PM – 26 Mar 2018 $CELG hit last price target – targets 95.90 Apr 3. Chart notes. https://www.tradingview.com/chart/CELG/RwZItPb8-CELG-hit-last-price-target-targets-95-90-Apr-3-Chart-notes/ …
https://twitter.com/SwingAlerts_CT/status/978390139201302529
Mar 26 –
$CELG Celgene 2.58% hit our last price target and now $CELG targets 95.90 April 3 peak time cycle on 60 minute chart as most probable with MACD turned up on daily. Trading 87.03 intra. If it fails trade in direction of the possible targets. #swingtrading
Use the chart model to trim and add at horizontal Fibonacci support and resistance and watch the blue diagonal trend-lines for support and resistance also.
$CELG targets 95.90 April 3 as most probable with MACD turned up on daily. Trading 87.03 intra.

Feb 20 – $CELG under 96.00 resistance is bearish to 86.00 support Feb 28 cycle peak. 60 Min stock chart.

Jan 7 – $CELG So far in this washout very indecisive trade – watching for 60 min time cycle peaks for trade lift to bring time frame out for swing trade.
In other words, as soon as trade gets bullish on the 60 minute time-frame then I can chart the daily time frame for a proper swing trade. So I am watching the mid quad time cycle peaks for possible lift for a clue to begin trading it and move to a daily time-frame chart for a swing trade post wash-out.

$LITE – LUMENTUM
April 29 – Per last report “From here $LITE targets 64.95 April 6 with MACD turned down” and … yes it hit that target near perfect.

$LITE With earnings in 2 days it seems oversold. Expect a bounce at quad wall. Bias to 105.41 June 4. Bearish 86.09.

March 26 – Doesn’t get much better than this. Great trade set-up for our swing trading platform, hit upper target and more (early), was alerted on report Feb 20 for Apr 9 PT. $LITE #swingtrading

From here $LITE targets 64.95 April 6 with MACD turned down, but IMO doesn’t get the whole way.

$CALA
Mar 26 – $CALA trending toward lower target and indecisive, but MACD may turn up here. Needs at least 8.30 for upside.

Feb 20 – $CALA Continues under pressure targeting lower targets on price cycle termination. Buy sell triggers on chart.

Jan 7 – $CALA If this historical support area holds 18.63 is in play for Jul 3 time cycle peak on daily for swing trade. But that is a big if and the peak (apex) of quad may not hit – it could just be indecisive bullish bias to mid horizontal line on quad at 10.70 ish. If it does start to play out I will chart lower time frames for legging in on swing trade.
If it fails all together, the downside is in the 3.00 range at bottom of quad.
The symmetry on this chart suggests bullish action however. But yet to be seen.

$XRT – SPDR S&P Retail ETF
March 26 – $XRT short set up at 44.90 area if price gets there. Under significant structural pressure now. #swingtrading

Jan 7 – $XRT Nice clean mid quad price time target hit on this daily swing trading chart model. #swingtrading

$XRT Symmetry suggests 41.36 ish May 2019 but be sure to trade with price action. As trade leaves this target area I will chart lower time frames as the trade gives indication to up or downside. Chart link below FYI (from previous reports).

Dec 7 – Stoch RSI on $XRT daily has turned down so there is a chance that the lower target for Jan 8 2018 hits at 41.00 FYI on watch

Buy Sell Triggers are as follows for the wide time frame $XRT charts below;
51.19
46.11
41.00
36.00
31.00
$XRT Retail ETF trading 44.11 may hit Jan 8, 2018 46.11 time cycle target and most likely 36.00 May 15, 2019 time cycle target. More notes on chart. #swingtrading

$EXP Building Materials
Mar 26 – $EXP 118.00 or 140.00 Oct 30 2018 with MACD turned up and above 200 MA with volume.

Jan 7 – $EXP at resistance perfectly at mid quad test, over 117.92 targets 140 area late Oct and under targets 96.00 area. trading really clean through the decisions.

Dec 7 – $EXP on daily MACD is turned up but Stoch RSI is high. Trading 111.68 with main upside target 118.00 or downside 95.60 and Fib checkpoints in between to pay note to. The 118.00 price target is very probable in my opinion so this is on high watch for me for continuation.
Main Buy Sell Triggers:
140.00
118.00
95.60
73.37

$FIT
Mar 26 – $FIT near its previous lows, may get a bottom bounce soon. Watching Stoch RSI for a trade.

Jan 7 – $FIT trading 5.90 sitting right on 200 MA under 20 50 100 MA’s – decision time.

Dec 7 – $FIT trading 6.78 with 20 MA about to breach 50 MA but Stoch RSI trend down and MACD may turn down. Indecisive again.

$VFC
Mar 26 – $VFC on weekly looks like it has some chop left. No trade.

Jan 9 – Trading 77.36 the trend continues at 52 week highs. Watching break-out area for possible long.
$VFC The big test. 52 week highs. Weekly chart. #trading

Alphabet (Google) $GOOGL, $GOOG
Mar 26 – $GOOGL interesting how it hit that quad wall support and bounced back over 200 MA. Price targets on chart. #swingtrading
As long as it holds that 200 MA it should be either 1218.00 or 1319.00 for July 11 time price cycle peak on Google chart.

Jan 9 – $GOOGL Trading 1114.98 Trend continues to bulls side with all indicators nearing maximum overdrive. Watching.
Although it looks like this will continue in uptrend for some time, it is irresponsible for me to suggest long entries here as all indicators on weekly chart are very extended. Will watch for structured entry long.

Amazon $AMZN
Mar 26 – $AMZN Keep it easy on this and assess when Stoch RSI on daily turns. Very easy trade for decent RR.

Jan 9 – $AMZN Trading 1248.76 premarket. Same story as with Google, all indicators are very exteded and waiting for pull back.

Juno $JUNO
Mar 26 – Technical glitch in Trading View.
Jan 9 – $JUNO trading 49.35 under 50 MA – if price gets above 50 MA with 20 MA breach to upside it is a long. #swingtrading
This is a possible sidewinder setting up (price above 50 MA with 20 MA breaching from underside of 50 MA would qualify as a structural long). Time with Stoch RSI curl up from bottom on 60 min or greater if possible.
On watch for set-up to play out.

Dec 7 – $JUNO with 50 MA below and 20 MA resistance Stoch RSI may turn up but MACD is not SQZMOM down. Waiting.

Nov 12 – Trading 57.59 and as I said early in 2017 it has rocketed. Way too far above MA’s right now to consider.
Sept 18 – Trading 44.30 in continued break out up against historical resistance. Watching.
Aug 9 – Trading 28.90 watching indicators for conclusive long thesis but we just cannot form one yet. Watching.
July 25 – Trading 30.20. Indicators are indecisive (likely due to ER in 9 day)
OakTree Capital $OAK
Mar 26 – $OAK Risk reward near long side now, watching for Stoch RSI to turn on weekly. #swingtrading

Jan 9 – $OAK daily chart . I actually really like this setup with price on historical support. Swing trade report will outline setup and buy sell triggers. #swingtrading
https://finance.yahoo.com/news/global-distressed-debt-funds-circle-091345516.html?soc_src=social-sh&soc_trk=tw
Disclosure: Compound Trading and or myself has contractual relations with one or more parties included in the article above. I hold no position at this point and may or may not in the near future.

VanEck Vectors Russia ETF $RSX
March 26 – Trading 22.48 with indicators that are very indecisive.
Jan 9 – $RSX Russia ETF – Really interesting weekly chart IMO. #swingtrading

$RSX over 23.00 targets 27.00 and over 27.00 targets 43.00 as most bullish scenario.

BOFI Holdings $BOFI
Mar 26 – $BOFI Great trading set-up from earlier this year. Indicators extended and long side RR is limited. No new trade. Weekly chart shown.

Jan 9 – $BOFI Very near upside break out in to earnings. On high watch now. I will alert and chart if trade starts.

US Silica Holdings $SLCA
Mar 26 – $SLCA trading 25.08 with indecisive indicators on all time-frames.
Jan 9 – $SLCA Will likely start a long position today on this set up. Will alert and chart the trade if so.

$EOG EOG Resources
Mar 26 – $EOG watching resistance on weekly just under 109 for upside or downside trade. #swingtrading Upside targets 134.00 area and downside 83.00 area.

Jan 9 – $EOG Watching weekly chart – but it seems too far extended – will watch in to earnings.

$GREK Global Greece ETF
Mar 26 – $GREK on weekly is a short when Stoch RSI peaks and turns down if price under 200 MA. Watching.

Jan 9 – $GREK Coming up on 200 MA test on weekly chart with MACD and SQZMOM turned up. Could be a fantastic swing trade setting up here.

$TRCH Torchlight Energy
Mar 26 – Trading 1.36 indecisive.
Jan 9 – Trading 1.26 indecisive but that could change soon.
Dec 7 – Trading 1.12 indecisive.
Nov 12 – Trading 1.24 and indecisive.
$NG Nova Gold
March 26 – Trading 4.68 has some bullside indications for follow-through but I’m not convinced at this point. Watching only.
Jan 9 – Trading 3.79 and indecisive indicators.
Dec 7 – Trading 3.50 with all indicators trending down. Waiting.
Email or DM me on Twitter anytime with thoughts or questions!
Cheers!
Curtis
Temporary Promo Discounts (for new members only).
Subscribe to Weekly Swing Trading Newsletter service here Reg 119.00. Promo Price 83.30 (30% off). Promo Code “30P”.
Or Real-Time Swing Trading Alerts Reg 99.00. Promo Price 69.37 (30% off). Promo Code “Deal30”.
I personally guarantee our swing trading service is one of the best in the business and it’s very reasonably priced considering the technical expertise invested in the platform (Lead Trader).
Subscribe to Swing Trading Service:
Swing Trading Bundle (Swing Trading Newsletter and Live Swing Trading Alerts).
Swing Trading Newsletter (Weekly Newsletter Published for Traders).
Real-Time Swing Trading Alerts (Private Member only Twitter Feed).
One-on-One Trade Coaching (Via Skype or In-Person).
Free Mailing List(s):
Join Email List for Free Trade Charting Trade Set-ups, Deals, Podcasts and Public Webinars.
Free Swing Trading Periodical Contact Form (Complimentary Swing Trade Set-Ups to Email)
Public Chat:
Visit our Free Public Chat Room on Discord.
Article Topics; Compound Trading, Swing, Trading, Stock, Picks, $AMBA, $COTY, $FSLR, $AAOI, $HIIQ, $CELG, $LITE