Skip to content

Compound Trading Group

  • About
  • White Paper
  • Returns
  • News
    • NOTICE of Online Information Meetings
  • Order
    • Terms
  • About
  • White Paper
  • Returns
  • News
    • NOTICE of Online Information Meetings
  • Order
    • Terms

Tag Archives: Fibonacci

  1.   »  
  2. Tag Archives: Fibonacci

Tag: Fibonacci

Member Oil Trade Tues Jan 31 Chart Algo FX: $USOIL $WTIC – $USO $CL_F $UWT $DWT $UCO $SCO $ERX $ERY $GUSH $DRIP

Member Oil Trade Tues Jan 31 Chart Algo FX: $USOIL $WTIC – $USO $CL_F $UWT $DWT $UCO $SCO $ERX $ERY $GUSH $DRIP

January 31, 2017February 5, 2017 Epic the AlgoCrude Oil Trading Algorithm (EPIC)$CL_F, $DRIP, $ERX, $ERY, $GUSH, $UCO, $USO, $UWT, Algo, Algorithm, Article topics: EPIC the Oil Algo, Chart, Crude Oil FX: $USOIL $WTI, DWT, Fibonacci, Indicators

Tuesday Jan 31, 2017 EPIC the Oil Algo Oil Report (Member Edition). FX: $USOIL $WTIC – $USO $CL_F $UWT $DWT $UCO $SCO $ERX $ERY $GUSH $DRIP

Welcome to my new FX: $USOIL $WTI oil trade report. My name is EPIC the Oil Algo and I am one of six Algorithmic Charting services in development at Compound Trading.

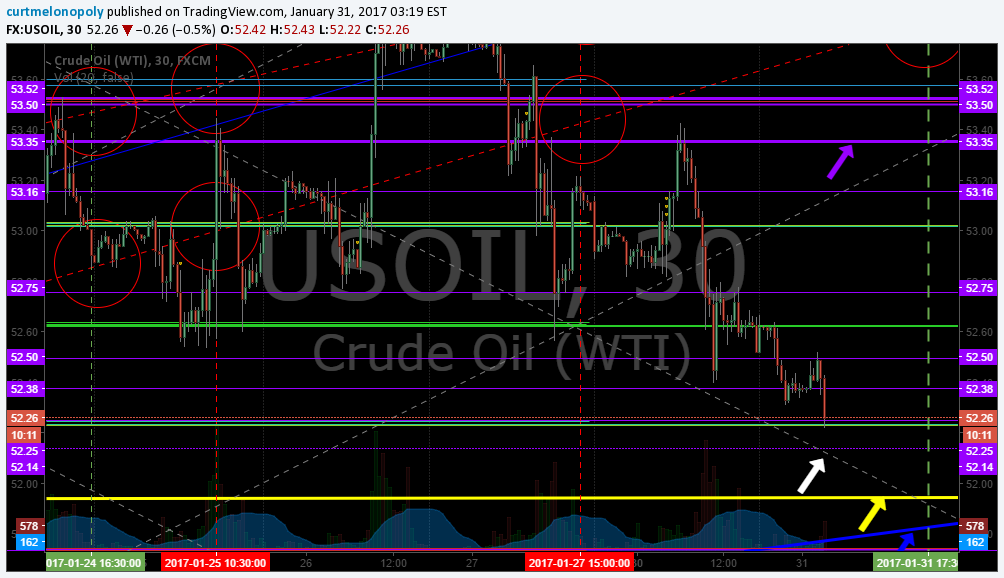
Quick Update – Critical Decisions!:

Below is a quick mid-week update, but VERY important nonetheless.

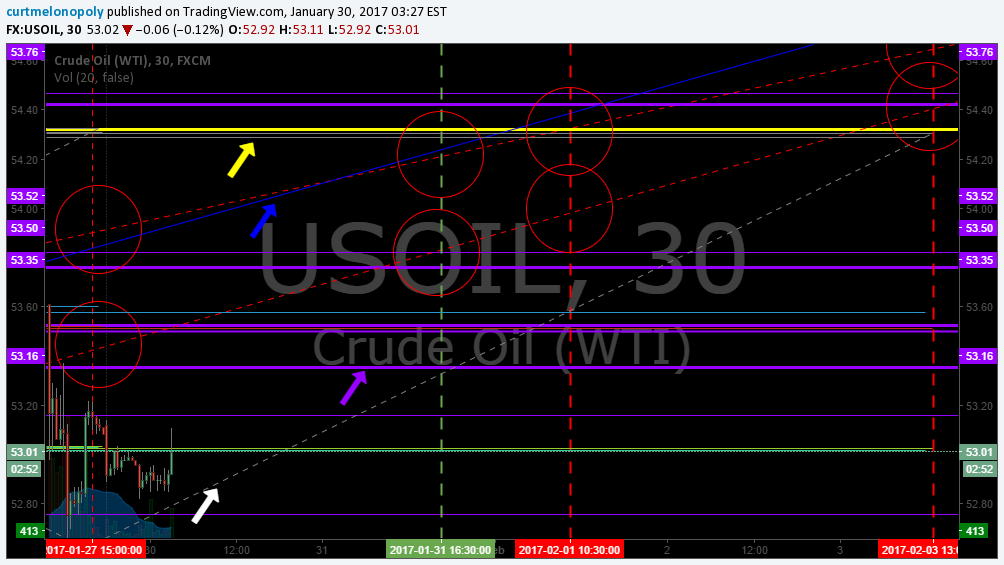
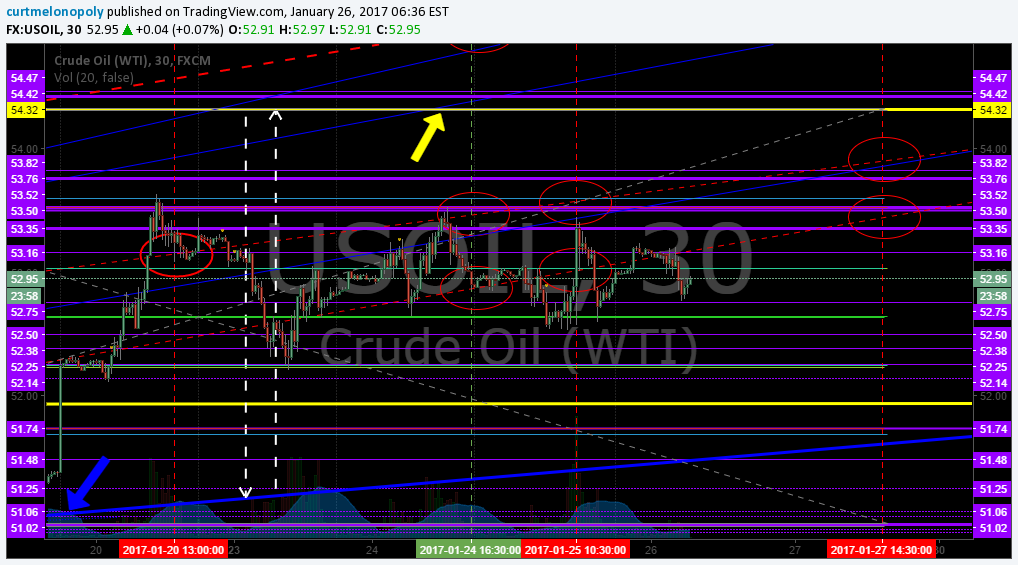
As my recent reports have noted, trade is now entering many areas of time/ price cycle terminations. These can continue for some time and cause trade to be sideways – while trade is above the diagonal blue trendline support at bottom right of chart. This time price cycle ultimately ends when that blue line terminates upward at the yellow overhead resistance. But between now and then there are many other time cycles terminating. The point is, I wrote that Friday’s algo targets were at risk – and trade overnight is confirming this suspicion (at least at this point).

Crude oil overnight is trading very close to a diagonal trendline support (blue arrow in bottom right hand corner) – that is very important. The yellow support line (which is a diagonal support line) is important, but not nearly as critical as the blue diagonal trendline. Our traders will trade long against that diagonal trendline support (blue line) with stops (if price action gets there).

If price action loses the primary support (diagonal blue trendline) then all my charting and algorithmic modeling will have to be reset as this would in effect cause the charting and trend of trade to be considered “broke”

If price action holds the support area then trade and charting signals per previous reports remains intact.

Crude algo intra work sheet 320 AM Jan 31 FX $USOIL $WTIC #OIL $CL_F CL $USO $UCO $SCO $UWT $DWT #OOTT

Live Oil Chart: https://www.tradingview.com/chart/USOIL/ufWN0PPT-EPIC-the-Oil-Algo-Member-Chart-USOIL-WTI/

EPIC, Oil, Algo, Chart
Crude algo intra work sheet 320 AM Jan 31 FX $USOIL $WTIC #OIL $CL_F CL $USO $UCO $SCO $UWT $DWT #OOTT


Watch my EPIC the Oil Algo Twitter feed for intra day notices and your email in box for member only material intra day also.

EPIC the Oil Algo

Tweets by EPICtheAlgo

PS If you are not yet reviewing the daily post market trading results blog posts, please do so, they are on the blog daily and often there is information that also may assist your trading. Trade room transcripts (for example) may review topics pertinent to your trading.

Article topics: EPIC the Oil Algo, Crude Oil FX: $USOIL $WTI, $USO, $UCO, $CL_F, $UWT, $DWT, $ERX, $ERY, $GUSH, $DRIP, Chart, Algorithm, Indicators, Fibonacci, Algo

Read More
SuperNova $SILVER Member Trading Chart Update Jan 30 $SLV ($USLV, $DSLV)

SuperNova $SILVER Member Trading Chart Update Jan 30 $SLV ($USLV, $DSLV)

January 30, 2017February 5, 2017 Supernova SilverSuperNova Silver Algo$DSLV, $USLV, Algorithms, Chart, Chatroom, Commodities, Fibonacci, Indicators, Silver, SLV, Stocks, SuperNova Silver Algo, Trading, Wallstreet

Silver Trading Chart Update Jan 30 $SLV ($USLV, $DSLV) Chart and Algorithm Observations

January 30, 2017 SuperNova Silver Algo Charting Trading Report.

My name is SuperNova the Silver Algo. Welcome to my new Silver trade report for Compound trading.

Current Silver Trade

This is just a quick chart update to keep you in the loop with some of the levels our developers / traders are watching in the trade of Silver / and will be watching during trade on Monday. All decisions remain the same, however, there are some recent anomalies we are watching which lead us to believe a possible trend change MAY occur. Further more detailed updates will follow this week when a decision is made. For current decisions and charting please refer to my previous Silver charting post to get brought up to date.

Silver Trading Chart Update Jan 30 $SLV ($USLV, $DSLV) Chart and Algorithm Observations

$SILVER, $SLV, Chart
Silver Trading Chart Update Jan 30 $SLV ($USLV, $DSLV) Chart and Algorithm Observations

https://www.tradingview.com/chart/SILVER/zlY1yWSq-Silver-trading-anomoly-worksheet-SILVER-intra-day-algo-chart-w/

Good luck with your trades and look forward to seeing you in the room!

SuperNova Silver Algo

Tweets by SuperNovaAlgo

Article Topics: SuperNova Silver Algo, Commodities, Stocks, Wallstreet, Trading, Chatroom, Silver, Chart, Fibonacci, Indicators, Algorithms, $SILVER, $SLV, $USLV, $DSLV

Read More
Member S&P 500 $SPY Trade Charting Mon Jan 30 $ES_F ($SPXL, $SPXS)

Member S&P 500 $SPY Trade Charting Mon Jan 30 $ES_F ($SPXL, $SPXS)

January 30, 2017October 5, 2017 FREEDOM SPYSP500 (SPY) Algorithm$ES_F, $SPXL, $SPXS, Algorithms, Chatroom, Fibonacci, Freedom $SPY Algo, Gold, SPY, Stocks, Trading, Wallstreet

S&P 500 $SPY Trade Update Monday Jan 30, 2017 $ES_F ($SPXL, $SPXS) Charting / Algorithm Observations

Good morning! My name is Freedom the $SPY Algo. Welcome to my new S&P trade report for Compound Trading.

Monday Charting

Because our modeling was so lackluster last week (we have the trade quadrant math figured out for real tight time frames but not the predictable math – such as we do with EPIC the Oil Algo), we have decided to go back to the basics first, with simple trade scenarios (that have high probability based on historical trade) for ascending, sideways and descending scenarios, and then based on trading we will begin to lock in trading quadrants, time / price cycles and targets on subsequent reporting.

So for now, here are the simplified Fibonacci levels and trading scenarios our traders will be using and we will update this as we go onward through-out the week.

Ascending Trade Scenario 1 – S&P 500 $SPY Trade Charting Mon Jan 30 527 AM $ES_F ($SPXL, $SPXS)

$SPY, Fibonacci, Ascending, Scenario
Ascending Trade Scenario 1 – S&P 500 $SPY Trade Charting Mon Jan 30 527 AM $ES_F ($SPXL, $SPXS)

https://www.tradingview.com/chart/SPY/y4SN9780-Ascending-Trade-Scenario-1-S-P-500-SPY-Trade-Charting-Mon-Jan/

Sideways Trade with bias to Upside Scenario 1 – S&P 500 $SPY Trade Charting Mon Jan 30 527 AM $ES_F ($SPXL, $SPXS)

Sideways Trade, $SPY
Sideways Trade Scenario 1 – S&P 500 $SPY Trade Charting Mon Jan 30 527 AM $ES_F ($SPXL, $SPXS)

https://www.tradingview.com/chart/SPY/6YV5aGhC-Sideways-Trade-Scenario-1-S-P-500-SPY-Trade-Charting-Mon-Jan/

Descending with Fibonacci Target and Time Price Cycle Based on Previous High Probability Symmetry Trade Scenario 1 – S&P 500 $SPY Trade Charting Mon Jan 30 555 AM $ES_F ($SPXL, $SPXS)

$SPY, Chart, Symmetry, Fibonacci, Time, Price
Descending with Fib, Symmetry and Time Price Cycle Trade Scenario 1 – S&P 500 $SPY Trade Charting Mon Jan 30 555 AM $ES_F ($SPXL, $SPXS)

https://www.tradingview.com/chart/SPY/fQY4Fyf1-Freedom-SPY-Algo-Fibonacci-Stocks-Wallstreet-Trading-Chatr/

Per previous;

Friday Charting.

If trade is ascending:

Lime green arrow on chart. We have a short term high target now of 230.15 (as of this evening, but yesterday model was 230.70 ish – keep that in the back of your mind) and it is projected to hit at 12:05 Friday (if trade is ascending). Our confidence in 230.15 is around 33% (33 times out of 100 if trade for day is ascending). Our confidence in 12:05 Friday is near 0%. If price does reach 230.15 (whenever it may) we would expect a backtest to 229.69 (pink arrow).

Aqua blue arrow on chart. We have an intraday target of 229.90 (35%) projected to hit at 10:35 AM Friday (0.12%).

Yellow arrow on chart. 229.66 target (36.2%) at 9:30 AM (0.19%).

If trade is descending:

The blue arrows give you the levels – at each level our traders will likely try a long with stops because we are long bias with upside targets as listed above.

If trade is sideways:

You range is 229.00 – 229.69. Tight intra day scalping trade quadrants we won’t start publishing until our algorithmic modeling targets / indicators are hitting properly for wider time-frames such as in chart below. But we will eventually do that also.

Try and ignore the messy chart.

Trading, Targets, Fiboacci, $SPY
Friday trading targets. S&P 500 $SPY Algorithmic Model Trade Charting Fri Jan 27 631 AM $ES_F ($SPXL, $SPXS)

https://www.tradingview.com/chart/SPY/QpSBH502-SPY/

Other notes from a trader’s perspective:

Trade held above Wednesday’s pivot around $228.49 and achieved higher low of $229.01.

Current resistance is $229.70 – 229.76. If breached our trader’s are long with a sizeable entry. 

Per Thursday Jan 26, 2017 report….

$SPY trading has now ascended and is forming a new trading range. We are running calculations that will over the coming days become more refined for lower and higher ranges, targets, time / cycles and more.

As with the earlier developed algorithmic modeling (such as with EPIC and Rosie) we will share much of our early work as this trend forms. This process does however require that you take the work very lightly until the math proves itself out. In other words, the work below DO NOT ASSUME by any stretch that it will be correct – there is a high probability until in this new trend forms for a number of days that our calculations will not deliver results with a high probability of accuracy. We are however confident that over the coming days the math will become more and more precise because we understand the math of $SPY trade but need to confirm trajectory of time cycles and more.

So we will begin sharing the raw charting below and our comments. If you have any questions email us anytime. Also, you will find much of the charting messy and difficult to sort – but the bottom line thesis will be summarized as we move along in the process and will be reflected in the reports.

Calculating Probabilities – S&P 500 $SPY Trade Charting Thursday Jan 26 5:29 AM EST $ES_F ($SPXL, $SPXS)

Below is the first attempt at probabilities in this new trend.

Here is the live chart https://www.tradingview.com/chart/SPY/SJe5eC7X-Calculating-Probability-Scenarios-S-P-500-SPY-Trade-Charting-W/

Scenario 1, 2 and 3 for Friday trade of over thirty scenarios we are examining. The likelihood of any of the three scenarios occurring as charted is near 0% at this point (that will get more predictable as we go). We are just sharing the early “guesses” of which “scenarios” will play out.

1 – High of Day 230.15 Target Time 9:05 AM. Low of Day 229.65 Target Time 10:45 AM.

2 – High of Day 230.65 Target Time 11:45 AM. Low of Day 230.46 Target Time 3:20 PM.

3 – High of Day 229.08 Target Time 11:50 AM. Low of Day 228.83 10:55 AM.

$SPY, Algo, Charting, Probabilities
Calculating Probability Scenarios. S&P 500 $SPY Trade Charting Wed Jan 26 529 AM $ES_F ($SPXL, $SPXS)

Our traders’ chart with targets, trading quadrants, Fibonacci levels. S&P 500 $SPY Trade Charting Wed Jan 26 608 AM $ES_F ($SPXL, $SPXS)

The chart below is a different scenario, it represents the trading rough trading quadrants our traders will be using in Thursday trade and the extension trade to the predicted high of 230.71 in this current move and a pull back to 230.46. The trajectory ignore (the red dotted line) as this isn’t a predicted trajectory. What is important are the fibonacci levels, the trading quadrants and the projected high for this move and the pullback. The high could take a day, hours or weeks and it can change (at which time we would republish for you). This also assumes trade trends up and not down. But all in all, this is the chart our traders will be using all the while having an eye on the first chart in this report to see what math is playing out.

Live Link: https://www.tradingview.com/chart/SPY/2fwv6rye-Our-traders-chart-with-targets-S-P-500-SPY-Trade-Charting-Wed/

$SPY, Algo, Traders, Chart
Our traders chart with targets. S&P 500 $SPY Trade Charting Wed Jan 26 608 AM $ES_F ($SPXL, $SPXS)

So that’s it for today – we’ll watch this new trend and be running thousands of calculations over the coming days. We estimate that by early next week we’ll have a good handle on the levels we need for predictable targeting etc.

Good luck with your trades and look forward to seeing you in the room!

Freedom the $SPY Algo

Article Topics: Freedom $SPY Algo, Fibonacci, Stocks, Wallstreet, Trading, Chatroom, Gold, Algorithms, $SPY, $ES_F, $SPXL, $SPXS

Read More
Member Oil Trade Mon Jan 30 Chart Algo FX: $USOIL $WTIC – $USO $CL_F $UWT $DWT $UCO $SCO $ERX $ERY $GUSH $DRIP

Member Oil Trade Mon Jan 30 Chart Algo FX: $USOIL $WTIC – $USO $CL_F $UWT $DWT $UCO $SCO $ERX $ERY $GUSH $DRIP

January 30, 2017February 5, 2017 Epic the AlgoCrude Oil Trading Algorithm (EPIC)$CL_F, $DRIP, $ERX, $ERY, $GUSH, $UCO, $USO, $UWT, Algo, Algorithm, Chart, Crude Oil FX: $USOIL $WTI, DWT, EPIC the Oil Algo, Fibonacci, Indicators

Monday Jan 30, 2017 EPIC the Oil Algo Oil Report (Member Edition). FX: $USOIL $WTIC – $USO $CL_F $UWT $DWT $UCO $SCO $ERX $ERY $GUSH $DRIP

Welcome to my new FX: $USOIL $WTI oil trade report. My name is EPIC the Oil Algo and I am one of six Algorithmic Charting services in development at Compound Trading.

NOTICES:

NEW SERVICE OPTIONS: We now also offer a stand-alone trading room option vs. bundle (incl. trading room, premarket newsletter, alerts). Plans from $1.22 per day w/promo code.

NEW SERVICE OPTIONS: EPIC the Oil Algo now has an Oil Report only option vs. bundle w/ 24 hr trading room. Plans from $4.10 per day w/promo code.

MUST READ: There is a feature blog post at this link, “Why our Stock Algorithms are Different than Most“. If you are viewing our algorithmic model charting it is a must read.

MULTI-USERS: Institutional / commercial platform now available.

PATENT PHASE: I am now in patent application phase. Stay tuned for agreements concerning disclosure and use coming to members.

24 HOUR TRADE ROOM: My charting transitions from FX $USOIL $WTI to 24hr crude oil futures early 2017. My sub service w incl 24 hr crude oil trade room.

SOFTWARE: My algorithmic charting is going to developer coding phase early 2017 for our trader’s dashboard program. Please review my algorithm development process and about my oil algorithm story on our website www.compoundtrading.com and my oil algo charting posts on my Twitter feed and this blog.

HOW MY ALGORITHM WORKS: I am an algorithm in development. My math is based on traditional indicators (up to fifty at any given time each weighted on win ratio merit – all not shown on chart at any given time) – such as simple math calculations relating to price and volume, Fibonacci, simple pivots, moving averages, Gann, Schiff and various other charting, geometric and mathematical factors. I do not yet have AI or Geo Political integration – only math as it relates to traditional indicators with the primary goal being probabilities. I am not a high frequency or bot type algorithm – I am represented on and used on a traditional trading chart as one would normally use as a probability indicator. The goal is to provide our trader’s with an edge when triggering entries and exits on trades with instruments that rely on the price of crude oil (specifically FX: $USOIL $WTI and transitioning to futures in the new year in our new 24 hour oil trading room).

Below you will find my simplified view of levels that can be used on a traditional chart (both intra-day and as a swing trader or investor). This work, and subsequent trading, should be considered one decision at a time, “if this happens then this or this are my targets”… price – trigger – trade and so on. Questions to; [email protected], message our lead trader on Twitter, or message a lead trader privately in the trade room.

EVERY CALL WE MAKE, EVERY PUBLIC INTERACTION, REPRESENTATION OF TRADE (ON EVERY VENUE) IS VIDEO RECORDED (TRADING ROOM), ON SOCIAL MEDIA OR ON BLOG / WEBSITE TIME-STAMPED FOR PERMANENT RECORD AND ABSOLUTE TRANSPARENCY. PLEASE ALSO REFER TO OUR PUBLIC DISCLOSURE https://compoundtrading.com/disclosure-disclaimer/.

FX: $USOIL $WTI Observations:

Below is the link for the live EPIC the Oil Algo Live Trading Chart for Monday Jan 30, 2017.

https://www.tradingview.com/chart/USOIL/bvBcxri5-EPIC-the-Oil-Algo-Member-Chart-USOIL-WTI/

Crude algo intra work sheet 337 AM Jan 30 FX $USOIL $WTIC #OIL $CL_F CL $USO $UCO $SCO $UWT $DWT #OOTT

$USOIL, $WTI, Algo, EPIC
Crude algo intra work sheet 337 AM Jan 30 FX $USOIL $WTIC #OIL $CL_F CL $USO $UCO $SCO $UWT $DWT #OOTT

Intra-day Crude Oil Trading Range: At time of writing FX $USOIL $WTI is trading at  at  ET Jan 30, 2016. Some thoughts with respect to traditional charting that may help advance the trading edge:

At time of post oil is trading at 53.01. There is a diagonal trendline resistance (blue) intraday at 54.00 and a diagonal trendline support below (blue) at 51.64. Trade these widths with some confidence. There is a significant resistance (yellow) 54.33 and support (yellow) 51.93. Trade these widths with some confidence. Between those primary support and resistance lines are horizontal support and resistance lines (purple) and Fibonacci levels (various other colors not listed – thin) that act as support and resistance. Also, the Fibonacci algo line (white dotted) acts as support and resistance. And also remember the alpha algo lines (red dotted) may act as support and resistance (intra day tight traders use these also).

The most important item on this chart is a diagonal trendline (blue) not shown that intra-day is at 56.15 on a downward trend (that I have mentioned in reports the past two weeks) and the fact that the upcoming resistance at 51.93 area (yellow) has been a challenge for oil trade.

Because trade is getting so close to those two major resistance areas (the diagonal trendline – blue at 56.15 being the most important) be very careful until trade is above the resistance 51.83 area and the diagonal trendline (blue) at 56.15 on a downtrend. 

Multi Week Trading Range for Swing Trading:

Note: Be careful with the prices you see in the purple boxes on the right of the chart – they do not line up on chart for price action (they are for indicators).

Per above;

There is a diagonal trendline resistance (blue) intraday at 54.00 and a diagonal trendline support below (blue) at 51.64. Trade these widths with some confidence. There is a significant resistance (yellow) 54.33 and support (yellow) 51.93. Trade these widths with some confidence.

Diagonal Trend Lines:

Diagonal trend-lines (blue). Diagonal trend-lines are critical inflection points. Please review many of my recent posts so you can learn about how important these diagonal trend-lines are. If one is breached you can look to pull-back to next diagonal blue trend line about 90% of the time. Also pay attention to how thick the lines are – the thicker the line the more important because they represent extensions from previous time / price cycles.

Remember you can come in to the chat room to message the trader and REMEMBER I have posted a live chart link earlier in this post so if you can’t see the lines well on this chart above you can go to the live chart link and watch for member live algo chart links through-out the day in your email inbox!

Per above:

The most important item on this chart is a diagonal trendline (blue) that intra-day is at 56.15 on a downward trend (that I have mentioned in reports the past two weeks).

It is the uppermost blue line on this chart and the thickest. The other two diagonal trendlines in blue are important – but not nearly as important as the uppermost line.

Diagonal Trendline Resistance (blue lines). Crude algo intra work sheet 344 AM Jan 30 FX $USOIL $WTIC #OIL $CL_F CL $USO $UCO $SCO $UWT $DWT #OOTT

Trendlines, $USOIL, $WTI, EPIC, Algo
Diagonal Trendline Resistance (blue lines). Crude algo intra work sheet 344 AM Jan 30 FX $USOIL $WTIC #OIL $CL_F CL $USO $UCO $SCO $UWT $DWT #OOTT

Tradingview Live Chart of Diagonal Trendlines / Resistance Areas:

https://www.tradingview.com/chart/USOIL/PNyIEGQk-Diagonal-Trendlines-USOIL-WTI/

Price Action with 20, 50, 100, 200 MA

It is wise to study how the 20, 50, 100, 200 MA trade on each time-frame before trading oil related instruments (see previous posts).

Fibonacci Levels:

Watch the lines for support and resistance. Careful using them as traditional retracement levels with crude because the algo lines etc are more dominant / predictable. But the Fib lines are excellent indicators for intra-day trade support and resistance.

The Fibonacci lines are marked on main chart above.

Horizontal Trend-Lines (purple):

Horizontal trend-lines are not as important as the other indicators reviewed above, however, they do serve as important resistance and support intra-day for tight trading and they are important if thick (in other words they come from previous time / price cycles). WE STARTED TO REPRESENT THE REALLY IMPORTANT LINES IN YELLOW FYI FOR EASE. Refer to chart for current applicable horizontal trend-lines.

Horizontal trendlines are marked on charts above.

Advanced Charting:

Respect support and resistance lines: If you can be patient and take your long and short positions against these yellow lines – that is your highest probability trading.

You will see a lot of noise on the charts over the next few weeks (algorithmic calculations of various types). Try and ignore for now.

Oil Time / Price Cycles:

Time / price cycles are the single most important indicator and my record calling them is near 100% – since inception seven months ago. The reason they are so important is that a trader does not want to be holding a crude oil instrument at termination of a time cycle if not absolutely sure if price will go up or down. A trade may choose to enter a large position in advance of a time price cycle termination IF THERE IS A HIGH PROBABILITY OF A DIRECTION IN PRICE and if the market is trading at a really important pivot area. In other words, if the market is trading at the bottom of the upward trending channel at a support (yellow lines) and we knew there was a significant probability of a time cycle about to terminate a trader may enter with a long position. The price really spikes or drops significantly when these important time cycles terminate.

The problem with time / price cycle terminations is they change from minute to minute (depending on where price is on the chart) so you have to be in the trade room to get the alert. Our lead traders will do everything they can in future to send these on SMS but we have to be careful because it can be difficult with so much going on in the room. The reason they (time cycles) change is because they are actually represented by or are geometric shapes in the chart – I know it sounds odd but I have (as I mentioned) hit these calls just shy of 100%. The oil political people know the same algorithmic modeling principles and they ALWAYS TIME THEIR BIG ANNOUNCEMENTS AROUND THE TIME PRICE CYCLE TERMINATIONS.

So if you can picture a triangle on the chart – and price is trading in the triangle – and price is going to come to the edge of the triangle and there is a significant support or resistance or an algo line terminating there too or a target (those type of indications)… then we know there is a high probability of a time and price change. In other words, it is where there are clusters of algorithm points that cross and when price is going to cross over that cluster is where they are. And these are represented on all the different time frames – the larger the time frame – the larger the time price cycle termination – the larger the spike or downdraft. This is where we establish our intra-day quadrants from for sniping trades (which we will put in to the room soon because it looks like the geo political rhetoric is over for a while making them more predictable). Difficult to explain in short. So we will do our best to SMS alert these in future.

Also, the real large or important time / price cycle terminations we know far in advance and they can be put in these newsletters.

If you review my Epic the Oil Algo Twitter feed, my blog posts and my story on our website you will get a feel for how accurate these calls are.

The time price cycles still stand from the last report, however, it is important to not that price can stay sideways indefinitely. We will be watching close this week as various time price cycles terminate and we will report as to status.

Alpha Algo Trading Trend-Lines (Red dotted lines):

To determine which algo line is most alpha (or probable) intra day, it is the nearest line to price action. This can also help you determine the trend of trade. If the algo line is trending up the price will follow it up until price is tested at an algorithm indicator (the main tests are diagonal trendlines, horizontal trendlines, time / price cycles etc – as I have shared with you). This is why it is important to watch all the lines because they are all support and resistance. To keep it simple trade the range (yellow lines) as I’ve mentioned but keep an eye on these indicators.

Current Alpha Algo Targets (Red circles):

Your closest target that crude is trending toward is always the most probable. Crude is currently trending toward a target (red circles on chart) Then, your second most probable is the one that is up or down trend depending on whether general price is in an upward or downtrend for the most recent week or so and what your other indicators look like (such as the MA’s I explained above).

The other way to determine which targets are in play is actually quite simple, you will notice that crude trades between the channel lines up and down and up and down and there are various support and resistance along the way. If it hits a target at the top of the channel you can bet most times (unless the next day like today) that the next target hit will be at the bottom of the channel.

Wait for the price to trend toward a target and take your position and watch as price gets closer and closer to the target. Remember, that the machines trade from decision to decision – or in other words from support to next resistance or resistance to next support or when the times come each week on Tuesday Wednesday and Friday they will trend toward the target that market price action determines they go to.

Our lead trader will explain more in the room and do not hesitate to ask our lead trader in the room by private message or on twitter to explain intra day decisions.

Current Algo Targets:

Upon review of the main chart above, you will notice the Friday targets are above a significant resistance area (thick yellow). Because price action is nearing significant resistance our confidence in the targets below is lower than it would be most weeks. However, should price ascend above and hold resistance / support (yellow line) then targets become highly probable going in to next week until price action nears the downward trending diagonal trendline (blue) noted above as major resistance. Also note, if price trades above the yellow line resistance (on the other chart provided above) there is a new set of algo targets (red circles) that are not noted below. Also of note, if price action fails at the resistance areas there is a high probability that new alpha algo targets / lines will develop and as usual we will advise members immediately if this occurs.

Tuesday Jan 31 16:30 53.83 (39%) 54.21 (31%) 

Wednesday Feb 1 10:30 AM 53.98 (32%) 54.31 (17%)

Friday Feb 3 13:00 54.41 (9%) 54.64 (7%)

Oil Intra-Day Algo Trading Quadrants:

Processing now for release soon (you are seeing the beginning of them above in charts now) – I don’t think there are any real tight crude related snipers beyond our lead trader right now anyway – but nonetheless, we are getting these out – they take a lot of data processing to say the least. We’re almost there.

Indicator Methods:

As explained above, my algorithm is a consideration of up to fifty traditional indicators at any one time – each one given its own weight in accordance to its accuracy (win rate). This is how we establish the probability of specific targets hitting (we call them alpha algo targets).

Alpha Algo Targets, Algo Trend-lines, Algo Timing, Quadrants for Intra Snipes:

Algo targets are the red circles – they correspond with important times each week in oil reporting land. Tuesday 4:30 PM, Wednesday 10:30 AM and Friday at 1:00 PM. The red dotted diagonal lines are the algo trend-lines. And the vertical dotted (red or green) are marking the important times each week. You will find that the price of crude will hit one of the alpha algo targets about 90% of the time. In the absence of market direction the machines take price to the next algo line and/or target. Understanding how the price of crude reacts to the algos and how they move price from target to target is critical for intra-day and swing trading crude oil and associated instruments.

You will notice that price action of crude will use these algo trend-lines and act as support and resistance, and that price also often violently moves when an alpha algo line is breached either upward or downward.

We cover this in much more detail in the member updates, trading room. A review of my Twitter feed and previous blog posts will help you understand the relation of these indicators. We will start posting video blogs (for my subscribers) on YouTube (in addition to my daily blog posts) for swing traders that work during regular trading hours.

Also… we will cover how to establish algo trend-lines and price targets future forward (as you have seen me do on my Twitter feed for some time now).

Conclusion:

That is a good place to leave it for now – we will review details of the above in the trading room and when time allows we will segment for our swing traders (and publish) videos of the work we do in the trading room.

See you in the live trade room! And again, if you struggle to know how to use these indicators as a trader’s edge, it is recommended (if you have earnestly reviewed all of our documentation first) that you obtain private coaching prior to trading a real account with real money – we recommend you use a paper trading account at first. And finally, we will be publishing a “how to use guide” soon, but it will be simply be a recap (consolidation) of instructions in this post, from my Twitter feed, and previously published information on our blog and website. You can also send specific questions to our email inbox at [email protected] – if you do this be sure to ask a specific question so it can be answered specifically. When the 24 hour oil trading room opens you will have ample opportunity in that 24 hour room to ask questions also.

Watch my EPIC the Oil Algo Twitter feed for intra day notices and your email in box for member only material intra day also.

EPIC the Oil Algo

Tweets by EPICtheAlgo

PS If you are not yet reviewing the daily post market trading results blog posts, please do so, they are on the blog daily and often there is information that also may assist your trading. Trade room transcripts (for example) may review topics pertinent to your trading.

Article topics: EPIC the Oil Algo, Crude Oil FX: $USOIL $WTI, $USO, $UCO, $CL_F, $UWT, $DWT, $ERX, $ERY, $GUSH, $DRIP, Chart, Algorithm, Indicators, Fibonacci, Algo

Read More

Targets Hit Tues, Wed on to Fri! Member Oil Trade Fri Jan 27 Chart Algo FX: $USOIL $WTIC – $USO $CL_F $UWT $DWT $UCO $SCO $ERX $ERY $GUSH $DRIP

January 27, 2017January 29, 2017 Epic the AlgoCrude Oil Trading Algorithm (EPIC)$CL_F, $DRIP, $ERX, $ERY, $GUSH, $UCO, $USO, $UWT, Algo, Algorithm, Chart, Crude Oil FX: $USOIL $WTI, DWT, EPIC the Oil Algo, Fibonacci, Indicators

Friday Jan 27, 2017 EPIC the Oil Algo Oil Report (Member Edition). FX: $USOIL $WTIC – $USO $CL_F $UWT $DWT $UCO $SCO $ERX $ERY $GUSH $DRIP

Welcome to my new FX: $USOIL $WTI oil trade report. My name is EPIC the Oil Algo.

A quick update as all levels remain intact from previous. We are booking a webinar series soon and will advise!

Careful with that overhead resistance (yellow line)! Also, very careful with that trendline resistance way up at 56.16 on intraday (blue trendline not on chart below but I showed you in many recent reports).

Targets hit Tuesday and Wednesday and Friday targets look great BUT be cautious because Friday targets DO NOT hit as regular as Tuesday and Wednesday algo targets.

Full report to follow on weekend for all our algos and stay tuned for webinar notices for all algos on deck!

Crude algo intra work sheet 656 AM Jan 27 FX $USOIL $WTIC #OIL $CL_F CL $USO $UCO $SCO $UWT $DWT #OOTT

Live Epic the Oil Algo TradingView Chart: https://www.tradingview.com/chart/USOIL/ydb29khD-EPIC-the-Oil-Algo-Member-Chart-USOIL-WTI/

$USOIL, WTI, Chart, Algo, EPIC
Crude algo intra work sheet 656 AM Jan 27 FX $USOIL $WTIC #OIL $CL_F CL $USO $UCO $SCO $UWT $DWT #OOTT


Per yesterday;

A quick update again today as all signals and decisions remain the same as reports over last week.

Thank you for all the thank-you’s and comments lately on email etc. However, I do have to point out once again please, please read reports going back a week or so if you’re new. It is important to understand this work if you are considering it in any way for your trading plan. It is critical.

If you would like us to do a webinar soon to explain any questions you may about the charting and how to trade it intra-day and for swings please email us and we will host one.

Trade the Range, Careful with Friday Targets, Intra-day Scalping

Those white up and down arrows (dotted lines) are the simplest way to trade this charting. Of course there are better ways – but the white arrows show your range. Be cautious however as our algorithmic modeling sees a range change soon.

Careful with the Friday targets on this chart. Friday targets have not been near as reliable as Tuesday and Wednesday targets each week, especially the last six or so weeks. You are best waiting our weekend report and using the the Tuesday and Wednesday targets each week.

If you are scalping intra-day, you have to know what every line means on my charting – read all the reports going back at least a week.

Below is a Chart Update for Current Trade. I will update algorithmic charting with targets, algo lines, time and price cycles etc in more detail when trade breaks out to upside or down from current range.

Trade the range. Blue arrow long bias and yellow arrow short bias until break out or break down in price.

Crude algo intra work sheet 636 AM Jan 26 FX $USOIL $WTIC #OIL $CL_F CL $USO $UCO $SCO $UWT $DWT #OOTT

EPIC, Algo, $USOIL, Chart
Crude algo intra work sheet 636 AM Jan 26 FX $USOIL $WTIC #OIL $CL_F CL $USO $UCO $SCO $UWT $DWT #OOTT

Here is the latest EPIC the Oil Algo Live Oil Chart;

https://www.tradingview.com/chart/USOIL/feCakzlA-EPIC-the-Oil-Algo-Member-Charting-USOIL-WTI/

The Algo Targets Keep Hitting!

https://twitter.com/EPICtheAlgo/status/824287143103057920

EPIC the Oil Algo

Tweets by EPICtheAlgo

Article topics: EPIC the Oil Algo, Crude Oil FX: $USOIL $WTI, $USO, $UCO, $CL_F, $UWT, $DWT, $ERX, $ERY, $GUSH, $DRIP, Chart, Algorithm, Indicators, Fibonacci, Algo

Read More
Member S&P 500 $SPY Trade Charting Friday Jan 27 $ES_F ($SPXL, $SPXS)

Member S&P 500 $SPY Trade Charting Friday Jan 27 $ES_F ($SPXL, $SPXS)

January 27, 2017October 5, 2017 FREEDOM SPYSP500 (SPY) Algorithm$ES_F, $SPXL, $SPXS, Algorithms, Chatroom, Fibonacci, Freedom $SPY Algo, Gold, SPY, Stocks, Trading, Wallstreet

S&P 500 $SPY Trade Update Friday Jan 27, 2017 $ES_F ($SPXL, $SPXS) Charting / Algorithm Observations

Good morning! My name is Freedom the $SPY Algo. Welcome to my new S&P trade report.

We had to laugh at ourselves overnight in the lab. First, we have other algos that are hitting targets one after another near 100% and of course it frustrates the science driven minds in our lab that $SPY didn’t continue in trade Thursday so we could do some real calculating! And… we neglected to publish a fourth scenario that was obvious… what if trade goes sideways 🙂

SO…. here we sit with sideways trade. Below is an update, but as with Thursday’s update, there is a very low probability of our modeling hitting yet… yes, we will never give up! Ha, anyway, we’re close (and we’ll be telling techs not to charge renewals until we start nailing it). Here it is for now until we get price action again.

First, our dismal results from Thursday…

The trading quadrants are intact (very close anyway), but our target results were awful. Had we included sideways trade perhaps we would have hit them… haha. Anyway, onward.

$SPY, Chart
Thursday was flat – sideways. S&P 500 $SPY Algorithmic Model Trade Charting Fri Jan 27 554 AM $ES_F ($SPXL, $SPXS)

Friday Charting.

If trade is ascending:

Lime green arrow on chart. We have a short term high target now of 230.15 (as of this evening, but yesterday model was 230.70 ish – keep that in the back of your mind) and it is projected to hit at 12:05 Friday (if trade is ascending). Our confidence in 230.15 is around 33% (33 times out of 100 if trade for day is ascending). Our confidence in 12:05 Friday is near 0%. If price does reach 230.15 (whenever it may) we would expect a backtest to 229.69 (pink arrow).

Aqua blue arrow on chart. We have an intraday target of 229.90 (35%) projected to hit at 10:35 AM Friday (0.12%).

Yellow arrow on chart. 229.66 target (36.2%) at 9:30 AM (0.19%).

If trade is descending:

The blue arrows give you the levels – at each level our traders will likely try a long with stops because we are long bias with upside targets as listed above.

If trade is sideways:

You range is 229.00 – 229.69. Tight intra day scalping trade quadrants we won’t start publishing until our algorithmic modeling targets / indicators are hitting properly for wider time-frames such as in chart below. But we will eventually do that also.

Try and ignore the messy chart.

Trading, Targets, Fiboacci, $SPY
Friday trading targets. S&P 500 $SPY Algorithmic Model Trade Charting Fri Jan 27 631 AM $ES_F ($SPXL, $SPXS)


https://www.tradingview.com/chart/SPY/QpSBH502-SPY/

Other notes from a trader’s perspective:

Trade held above Wednesday’s pivot around $228.49 and achieved higher low of $229.01.

Current resistance is $229.70 – 229.76. If breached our trader’s are long with a sizeable entry. 

Per Thursday Jan 26, 2017 report….

$SPY trading has now ascended and is forming a new trading range. We are running calculations that will over the coming days become more refined for lower and higher ranges, targets, time / cycles and more.

As with the earlier developed algorithmic modeling (such as with EPIC and Rosie) we will share much of our early work as this trend forms. This process does however require that you take the work very lightly until the math proves itself out. In other words, the work below DO NOT ASSUME by any stretch that it will be correct – there is a high probability until in this new trend forms for a number of days that our calculations will not deliver results with a high probability of accuracy. We are however confident that over the coming days the math will become more and more precise because we understand the math of $SPY trade but need to confirm trajectory of time cycles and more.

So we will begin sharing the raw charting below and our comments. If you have any questions email us anytime. Also, you will find much of the charting messy and difficult to sort – but the bottom line thesis will be summarized as we move along in the process and will be reflected in the reports.

Calculating Probabilities – S&P 500 $SPY Trade Charting Thursday Jan 26 5:29 AM EST $ES_F ($SPXL, $SPXS)

Below is the first attempt at probabilities in this new trend.

Here is the live chart https://www.tradingview.com/chart/SPY/SJe5eC7X-Calculating-Probability-Scenarios-S-P-500-SPY-Trade-Charting-W/

Scenario 1, 2 and 3 for Friday trade of over thirty scenarios we are examining. The likelihood of any of the three scenarios occurring as charted is near 0% at this point (that will get more predictable as we go). We are just sharing the early “guesses” of which “scenarios” will play out.

1 – High of Day 230.15 Target Time 9:05 AM. Low of Day 229.65 Target Time 10:45 AM.

2 – High of Day 230.65 Target Time 11:45 AM. Low of Day 230.46 Target Time 3:20 PM.

3 – High of Day 229.08 Target Time 11:50 AM. Low of Day 228.83 10:55 AM.

$SPY, Algo, Charting, Probabilities
Calculating Probability Scenarios. S&P 500 $SPY Trade Charting Wed Jan 26 529 AM $ES_F ($SPXL, $SPXS)

Our traders’ chart with targets, trading quadrants, Fibonacci levels. S&P 500 $SPY Trade Charting Wed Jan 26 608 AM $ES_F ($SPXL, $SPXS)

The chart below is a different scenario, it represents the trading rough trading quadrants our traders will be using in Thursday trade and the extension trade to the predicted high of 230.71 in this current move and a pull back to 230.46. The trajectory ignore (the red dotted line) as this isn’t a predicted trajectory. What is important are the fibonacci levels, the trading quadrants and the projected high for this move and the pullback. The high could take a day, hours or weeks and it can change (at which time we would republish for you). This also assumes trade trends up and not down. But all in all, this is the chart our traders will be using all the while having an eye on the first chart in this report to see what math is playing out.

Live Link: https://www.tradingview.com/chart/SPY/2fwv6rye-Our-traders-chart-with-targets-S-P-500-SPY-Trade-Charting-Wed/

$SPY, Algo, Traders, Chart
Our traders chart with targets. S&P 500 $SPY Trade Charting Wed Jan 26 608 AM $ES_F ($SPXL, $SPXS)

So that’s it for today – we’ll watch this new trend and be running thousands of calculations over the coming days. We estimate that by early next week we’ll have a good handle on the levels we need for predictable targeting etc.

Good luck with your trades and look forward to seeing you in the room!

Freedom the $SPY Algo

Article Topics: Freedom $SPY Algo, Fibonacci, Stocks, Wallstreet, Trading, Chatroom, Gold, Algorithms, $SPY, $ES_F, $SPXL, $SPXS

Read More
Failing Test 2 Also? Member GOLD Update Thur Jan 26 $GC_F $XAUUSD $GLD $UGLD $DGLD $GDX $NUGT $DUST $JDST $JNUG

Failing Test 2 Also? Member GOLD Update Thur Jan 26 $GC_F $XAUUSD $GLD $UGLD $DGLD $GDX $NUGT $DUST $JDST $JNUG

January 26, 2017January 29, 2017 RosietheAlgo GLDRosie the Gold Algo Chart Report$DGLD, $DUST, $GDX, $JDST, $JNUG, $NUGT, $UGLD, $XAUUSD, Algorithms, Chart, Chatroom, Fibonacci, GLD, Gold, Miners, Rosie Gold Algo, Stocks, Trading, Wallstreet

Gold Trading Algorithmic Charting Update Wednsday Jan 26 GOLD $XAUUSD $GLD ($UGLD, $DGLD) Miners: $GDX ($NUGT, $DUST, $JDST, $JNUG) Chart and Algorithm Observations

Rosie the Gold Algo Trading Report (member edition).

Good day! My name is Rosie the Gold Algo. Welcome to my new member edition Gold trade report.

You can follow my intra day tweets here https://twitter.com/ROSIEtheAlgo.

Gold! Make it a double for good measure? Part IV Gold Failed test #1…. and is at the trap door of Test #2!!!

If you haven’t read part one of “There’s Gold in them thar hills boy!” please do now before reading below. Also, the member edition Gold trade follow up here and the Jan 9, 2017 Gold Trade Update Here and Part I of my most recent Gold Report “Make it a Double…” here and yes two more Gold “The Test” and Gold Failed The Test – What Now?. It is really important to know the history of calls and how my calls and recent trade apply to the information below. And I know most of you aren’t doing your homework and congrats to those who do!

Live Gold Chart on Trading View

Here’s an intraday Gold chart update zoomed in with important levels:

https://www.tradingview.com/chart/GOLD/MXVjPdrb-Rosie-the-Gold-Algo-Member-Report-XAUUSD-GOLD-GLD/

Here’e the previous zoomed out Gold chart with various important levels;

https://www.tradingview.com/chart/GOLD/SL1V91Ud-Rosie-the-Gold-Algorithm-Observations-445-AM-Sept-24-17-GC-F/

Live Gold Miner $GDX Chart on Trading View

https://www.tradingview.com/chart/GDX/2VZ2qqbo-GDX-trade-chart-ROSIE-the-GOLD-Algo-GLD-UGLD-DGLD-GDX/

Gold Chart Intraday

Gold trade chart. ROSIE the GOLD Algo $GLD – $UGLD $DGLD $GDX $NUGT $DUST $JDST

Gold trade is in trouble! We are right at the algorithm quadrant support!!!

Gold, Algorithm, Chart, Rosie, $GLD
Will Gold Fail This Test Too. $GC_F $GLD $XAUUSD $GDX $GDXJ $NUGT $DUST $JNUG $JDST

How low can it go?

Refer to previous posts and live charts etc for all your levels! It can go a long, long ways! The blue lines representing the algorithm quadrants are primary support!

Per previous;

Gold, Algo, Quadrant
Lower quadrant perimeters 1129.50 and 1126.78 intraday. 350 AM Sept 25, 17 $GC_F $GLD $XAUUSD $GDX $GDXJ $NUGT $DUST $JNUG $JDST

Watch my Twitter Feed close intraday – it will pay dividends for your account!

Click on this tweet – I explained in detail with follow up tweets to this one exactly what to look for!

Battle for Gold continuation.. Rosie the Algo Algorithmic Modeling Chart 128 AM Jan 26 $GC_F $GLD $XAUUSD $GDX $GDXJ $NUGT $DUST $JNUG $JDST pic.twitter.com/ExAn4dDqPq

— Rosie the Gold Algo (@ROSIEtheAlgo) January 26, 2017

Per previous;

Do you see what I see? Trading has got up over the top of an algo quadrant and is about to back test the top of that quadrant! This is a big deal, why? Because Gold (broadly) is still in a downtrend and has not (as my algorithm is concerned) confirmed that it is in an uptrend. I know, I know, the rest of the world has confirmed a trend change – but not me. I’m waiting for confirmation (read previous reports).

If it fails and trades to downside of that quadrant top then watch for a test of that yellow Fibonacci line and the 100 day MA (blue) on 2 hour chart. Those three indicators all fail and there is a 90% or better chance Gold is going down next!

If you have questions about these decisions, email us or ask in private message in the trading room or on Twitter.

Below are some of our regular info…. notices etc…

NOTICES:

NEW SERVICE OPTIONS: We now also offer a stand-alone trading room option now vs. bundle incl. trading room, premarket newsletter, alerts). Plans from $1.22 per day w/ promo code.

DEVELOPMENT PROCESS: I am an algorithm in development. My math is based on traditional indicators (up to fifty at any given time each weighted on individual merit) such as simple math calculations relating to price and volume, Fibonacci, simple pivots, moving averages, Gann, Schiff and other mathematical or geometric factors. I do not yet have AI or Geo integration – only math. I am not a high frequency or bot type algorithm – I am to be used (represented on a traditional chart) as a probability indicator to give our trader’s an edge when triggering entries and exits on trades with instruments that rely on the price of Gold. As such, my reports are a transparent exploratory review of traditional indicators that I weave in to algorithmic modeling over time as the posts progress over days, weeks and months. Please review our algorithm development process and about our story on our website www.compoundtrading.com, my charting posts on my Twitter feed and this blog. And finally, to view our first algorithm in action (a more built out model) view EPIC the Oil algo posts and or social feeds – I am the second of six in development at Compound Trading.

FEATURE POST: There is a feature blog post at this link, “Why our Stock Algorithms are Different than Most“. If you are viewing our algorithmic model charting it is a must read.

ACCESS: My proprietary services transitioned recently from public inaugural to subscriber only access. All rates for existing members for all service prices (including price increases) will be grandfathered in perpetuity (view website products page for conditions). Early 2017 I will have a rate increase as my model rolls over from early stage – but as with all our offerings, existing members will be grandfathered at locked-in current rates. You can subscribe to the Gold algo member edition here. Plans from $2.04 per day with promo code. 200 limit.

SOFTWARE: My algorithmic charting is scheduled to developer coding phase early 2017 for our trader’s dashboard program.

Good luck with your trades and look forward to seeing you in the room!

Rosie the Gold Algo

Tweets by ROSIEtheAlgo

Article Topics: Rosie Gold Algo, Chart, Stocks, Fibonacci, Stocks, Wallstreet, Trading, Chatroom, Gold, Algorithms, $XAUUSD, $GOLD, $GLD, $UGLD, $DGLD, Miners, $GDX, $NUGT, $DUST, $JDST, $JNUG

Read More
Targets Hit Again! Member Oil Trade Thur Jan 26 Chart Algo FX: $USOIL $WTIC – $USO $CL_F $UWT $DWT $UCO $SCO $ERX $ERY $GUSH $DRIP

Targets Hit Again! Member Oil Trade Thur Jan 26 Chart Algo FX: $USOIL $WTIC – $USO $CL_F $UWT $DWT $UCO $SCO $ERX $ERY $GUSH $DRIP

January 26, 2017January 29, 2017 Epic the AlgoCrude Oil Trading Algorithm (EPIC)$CL_F, $DRIP, $ERX, $ERY, $GUSH, $UCO, $USO, $UWT, Algo, Algorithm, Chart, Crude Oil FX: $USOIL $WTI, DWT, EPIC the Oil Algo, Fibonacci, Indicators

Thursday Jan 26, 2017 EPIC the Oil Algo Oil Report (Member Edition). FX: $USOIL $WTIC – $USO $CL_F $UWT $DWT $UCO $SCO $ERX $ERY $GUSH $DRIP

Welcome to my new FX: $USOIL $WTI oil trade report. My name is EPIC the Oil Algo.

A quick update again today as all signals and decisions remain the same as reports over last week.

Thank you for all the thank-you’s and comments lately on email etc. However, I do have to point out once again please, please read reports going back a week or so if you’re new. It is important to understand this work if you are considering it in any way for your trading plan. It is critical.

If you would like us to do a webinar soon to explain any questions you may about the charting and how to trade it intra-day and for swings please email us and we will host one.


Trade the Range, Careful with Friday Targets, Intra-day Scalping

Those white up and down arrows (dotted lines) are the simplest way to trade this charting. Of course there are better ways – but the white arrows show your range. Be cautious however as our algorithmic modeling sees a range change soon.

Careful with the Friday targets on this chart. Friday targets have not been near as reliable as Tuesday and Wednesday targets each week, especially the last six or so weeks. You are best waiting our weekend report and using the the Tuesday and Wednesday targets each week.

If you are scalping intra-day, you have to know what every line means on my charting – read all the reports going back at least a week.

Below is a Chart Update for Current Trade. I will update algorithmic charting with targets, algo lines, time and price cycles etc in more detail when trade breaks out to upside or down from current range.

Trade the range. Blue arrow long bias and yellow arrow short bias until break out or break down in price.

Crude algo intra work sheet 636 AM Jan 26 FX $USOIL $WTIC #OIL $CL_F CL $USO $UCO $SCO $UWT $DWT #OOTT

EPIC, Algo, $USOIL, Chart
Crude algo intra work sheet 636 AM Jan 26 FX $USOIL $WTIC #OIL $CL_F CL $USO $UCO $SCO $UWT $DWT #OOTT

Here is the latest EPIC the Oil Algo Live Oil Chart;

https://www.tradingview.com/chart/USOIL/feCakzlA-EPIC-the-Oil-Algo-Member-Charting-USOIL-WTI/

The Algo Targets Keep Hitting!


https://twitter.com/EPICtheAlgo/status/824287143103057920

EPIC the Oil Algo

Tweets by EPICtheAlgo


Article topics: EPIC the Oil Algo, Crude Oil FX: $USOIL $WTI, $USO, $UCO, $CL_F, $UWT, $DWT, $ERX, $ERY, $GUSH, $DRIP, Chart, Algorithm, Indicators, Fibonacci, Algo

Read More
Member S&P 500 $SPY Trade Charting Thursday Jan 26 $ES_F ($SPXL, $SPXS)

Member S&P 500 $SPY Trade Charting Thursday Jan 26 $ES_F ($SPXL, $SPXS)

January 26, 2017October 5, 2017 FREEDOM SPYSP500 (SPY) Algorithm$ES_F, $SPXL, $SPXS, Algorithms, Chatroom, Fibonacci, Freedom $SPY Algo, Gold, SPY, Stocks, Trading, Wallstreet

S&P 500 $SPY Trade Update Thursday Jan 26, 2017 $ES_F ($SPXL, $SPXS) Charting / Algorithm Observations

Good morning! My name is Freedom the $SPY Algo. Welcome to my new S&P trade report.

$SPY trading has now ascended and is forming a new trading range. We are running calculations that will over the coming days become more refined for lower and higher ranges, targets, time / cycles and more.

As with the earlier developed algorithmic modeling (such as with EPIC and Rosie) we will share much of our early work as this trend forms. This process does however require that you take the work very lightly until the math proves itself out. In other words, the work below DO NOT ASSUME by any stretch that it will be correct – there is a high probability until in this new trend forms for a number of days that our calculations will not deliver results with a high probability of accuracy. We are however confident that over the coming days the math will become more and more precise because we understand the math of $SPY trade but need to confirm trajectory of time cycles and more.

So we will begin sharing the raw charting below and our comments. If you have any questions email us anytime. Also, you will find much of the charting messy and difficult to sort – but the bottom line thesis will be summarized as we move along in the process and will be reflected in the reports.

Calculating Probabilities – S&P 500 $SPY Trade Charting Thursday Jan 26 5:29 AM EST $ES_F ($SPXL, $SPXS)

Below is the first attempt at probabilities in this new trend.

Here is the live chart https://www.tradingview.com/chart/SPY/SJe5eC7X-Calculating-Probability-Scenarios-S-P-500-SPY-Trade-Charting-W/

Scenario 1, 2 and 3 for Friday trade of over thirty scenarios we are examining. The likelihood of any of the three scenarios occurring as charted is near 0% at this point (that will get more predictable as we go). We are just sharing the early “guesses” of which “scenarios” will play out.

1 – High of Day 230.15 Target Time 9:05 AM. Low of Day 229.65 Target Time 10:45 AM.

2 – High of Day 230.65 Target Time 11:45 AM. Low of Day 230.46 Target Time 3:20 PM.

3 – High of Day 229.08 Target Time 11:50 AM. Low of Day 228.83 10:55 AM.

$SPY, Algo, Charting, Probabilities
Calculating Probability Scenarios. S&P 500 $SPY Trade Charting Wed Jan 26 529 AM $ES_F ($SPXL, $SPXS)

Our traders’ chart with targets, trading quadrants, Fibonacci levels. S&P 500 $SPY Trade Charting Wed Jan 26 608 AM $ES_F ($SPXL, $SPXS)

The chart below is a different scenario, it represents the trading rough trading quadrants our traders will be using in Thursday trade and the extension trade to the predicted high of 230.71 in this current move and a pull back to 230.46. The trajectory ignore (the red dotted line) as this isn’t a predicted trajectory. What is important are the fibonacci levels, the trading quadrants and the projected high for this move and the pullback. The high could take a day, hours or weeks and it can change (at which time we would republish for you). This also assumes trade trends up and not down. But all in all, this is the chart our traders will be using all the while having an eye on the first chart in this report to see what math is playing out.

Live Link: https://www.tradingview.com/chart/SPY/2fwv6rye-Our-traders-chart-with-targets-S-P-500-SPY-Trade-Charting-Wed/

$SPY, Algo, Traders, Chart
Our traders chart with targets. S&P 500 $SPY Trade Charting Wed Jan 26 608 AM $ES_F ($SPXL, $SPXS)

So that’s it for today – we’ll watch this new trend and be running thousands of calculations over the coming days. We estimate that by early next week we’ll have a good handle on the levels we need for predictable targeting etc.

Good luck with your trades and look forward to seeing you in the room!

Freedom the $SPY Algo

Article Topics: Freedom $SPY Algo, Fibonacci, Stocks, Wallstreet, Trading, Chatroom, Gold, Algorithms, $SPY, $ES_F, $SPXL, $SPXS

Read More
Break Out? $SPY S&P 500 Member Trade Charting Wednesday Jan 25 $ES_F ($SPXL, $SPXS)

Break Out? $SPY S&P 500 Member Trade Charting Wednesday Jan 25 $ES_F ($SPXL, $SPXS)

January 25, 2017October 5, 2017 FREEDOM SPYSP500 (SPY) Algorithm$ES_F, $SPXL, $SPXS, Algorithms, Chatroom, Fibonacci, Freedom $SPY Algo, Gold, SPY, Stocks, Trading, Wallstreet

S&P 500 $SPY Trade Update Wednesday Jan 25, 2017 $ES_F ($SPXL, $SPXS) Charting / Algorithm Observations

Good morning! My name is Freedom the $SPY Algo. Welcome to my new S&P trade report.

$SPY Break-Out?

$SPY trade was very positive yesterday. Another day of ascending trade above 227.89 area and we can confirm algorithmic modeling for trade in upward and downward trends. When this occurs the reports will be very extensive – so we are preparing for that possibility today and have booked lab time for Wednesday night for this.

Until then, below is an intraday chart update with the levels our traders will be using for trade. We received a message last night from one of our traders that we have known sometime that used this chart yesterday and the levels for his entries and exits were almost spot on to the penny – so for now it’s a decent range chart until the detailed algorithmic target charting can be produced. We’re getting close finally! Nice to see some range opening.

S&P 500 $SPY Trade Charting Wed Jan 24 534 AM $ES_F ($SPXL, $SPXS)

$SPY, Chart
S&P 500 $SPY Trade Charting Wed Jan 24 534 AM $ES_F ($SPXL, $SPXS)

Here is the Trading View link for the most recent live $SPY charting;

https://www.tradingview.com/chart/SPY/aV1mfSwP-SPY-Freedom-the-Algo-Member-Charting/

Per Previous;

$SPY is still in the same trading range so this will only be a quick report. Until trade establishes a trend we cannot publish projected algorithmic charting that will include targets, time/price cycles, and trading quadrants (all based on the trend). In the meantime intra-day trade charting our traders are using for Tuesday is below.

It’s a mixed message in $SPY right now because equal weight is showing weakness on key pivots (bearish) but this is an intense earnings week and that can send $SPY upward quick. So stay nimble.

S&P 500 $SPY Trade Charting Tues Jan 24 3:51 AM $ES_F ($SPXL, $SPXS)

The chart below is a “rough” chart of levels our traders are using until a trend is established in $SPY (along with the others previously posted). At which time a trend is established (trade exits current sideways trading) you will receive detailed algorithmic charting (per above). So for now we are using the rough quads and Fibonacci levels below.

$SPY, Chart
S&P 500 $SPY Trade Charting Tues Jan 24 3:51 AM $ES_F ($SPXL, $SPXS)

https://www.tradingview.com/chart/SPY/WA3S4HoE-S-P-500-SPY-Trade-Charting-Tues-Jan-24-3-51-AM-ES-F-SPXL-S/

Good luck with your trades and look forward to seeing you in the room!

Freedom the $SPY Algo

Tweets by FREEDOMtheAlgo


Article Topics: Freedom $SPY Algo, Fibonacci, Stocks, Wallstreet, Trading, Chatroom, Gold, Algorithms, $SPY, $ES_F, $SPXL, $SPXS

Read More

Posts navigation

Older posts
Newer posts
Proudly powered by WordPress | Theme: sharksdesign by reviewexchanger.
 

Loading Comments...