Skip to content

Compound Trading Group

  • About
  • White Paper
  • Returns
  • News
    • NOTICE of Online Information Meetings
  • Order
    • Terms
  • About
  • White Paper
  • Returns
  • News
    • NOTICE of Online Information Meetings
  • Order
    • Terms

Tag Archives: Fibonacci

  1.   »  
  2. Tag Archives: Fibonacci

Tag: Fibonacci

Targets Hit! Member Oil Trade Wed Jan 25 Chart Algo FX: $USOIL $WTIC – $USO $CL_F $UWT $DWT $UCO $SCO $ERX $ERY $GUSH $DRIP

Targets Hit! Member Oil Trade Wed Jan 25 Chart Algo FX: $USOIL $WTIC – $USO $CL_F $UWT $DWT $UCO $SCO $ERX $ERY $GUSH $DRIP

January 25, 2017January 29, 2017 Epic the AlgoCrude Oil Trading Algorithm (EPIC)$CL_F, $DRIP, $ERX, $ERY, $GUSH, $UCO, $USO, $UWT, Algo, Algorithm, Chart, Crude Oil FX: $USOIL $WTI, DWT, EPIC the Oil Algo, Fibonacci, Indicators

Wednesday Jan 25, 2017 EPIC the Oil Algo Oil Report (Member Edition). FX: $USOIL $WTIC – $USO $CL_F $UWT $DWT $UCO $SCO $ERX $ERY $GUSH $DRIP

Welcome to my new FX: $USOIL $WTI oil trade report. My name is EPIC the Oil Algo.

A quick update as all signals and decisions remain the same as reports over last week.

NEW MEMBERS be sure to read reports going back at least five days so you know what to watch for. We are getting emails and DM’s with many questions that are answered in the reports! Do not trade if you do not know the support, resistance and signals I have provided for you in this trading range. To be in a trade and then ask, especially asking questions when the reports are provided for you specific to what has been hammered numerous time in reports is simply irresponsible trading and not fair to other members because our time should be used for questions and helping members with forward thinking decisions not what is already clearly laid out in reports. We know if you are reviewing the reports so if you ask questions that are already in the report and we know you haven’t reviewed the reports (internet is smart) and we know you have not looked at the algo charting provided (internet is smart) then we are going to have to start declining help to those that won’t do their homework first. Read the reports please. And for those that are doing their Study congratulations!

The Machines are Back!

How do we know? There are at least fifty indicators that we use and the consistency of those signals hitting are how we know. They are back. Why is this important? Because this enables my algorithmic charting to be precise and it also means there is a big move looking upside or down. Be ready.

Trade the Range

We get endless questions about whether you should go long or short. We can’t tell you. We can provide algorithmic charting that will increase your edge however. The recent reports tell you exactly where your trading range is – read them. If you’re trading mid range / halfway between range edges – then prepare for being chopped up or you better be an expert trader.

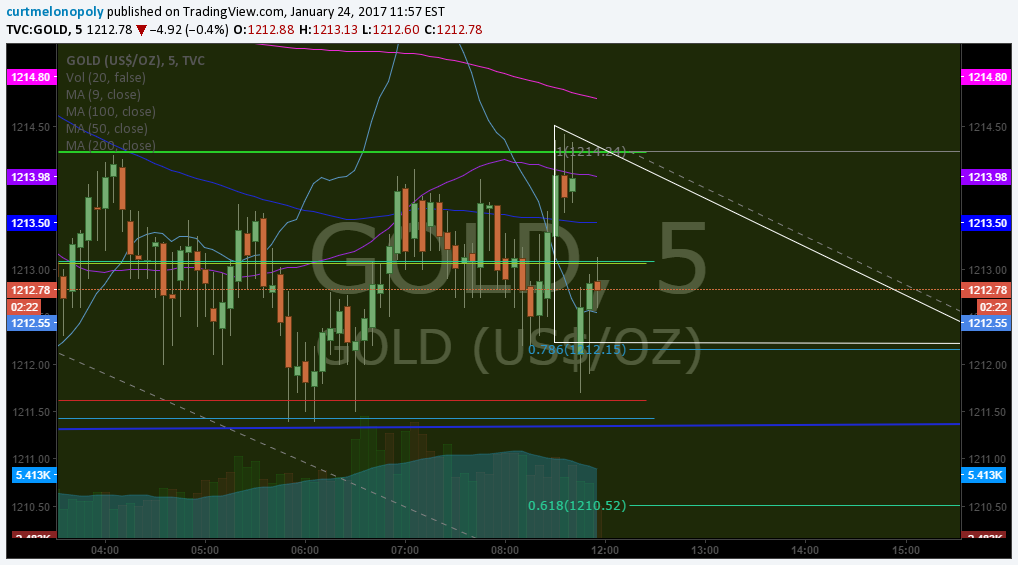
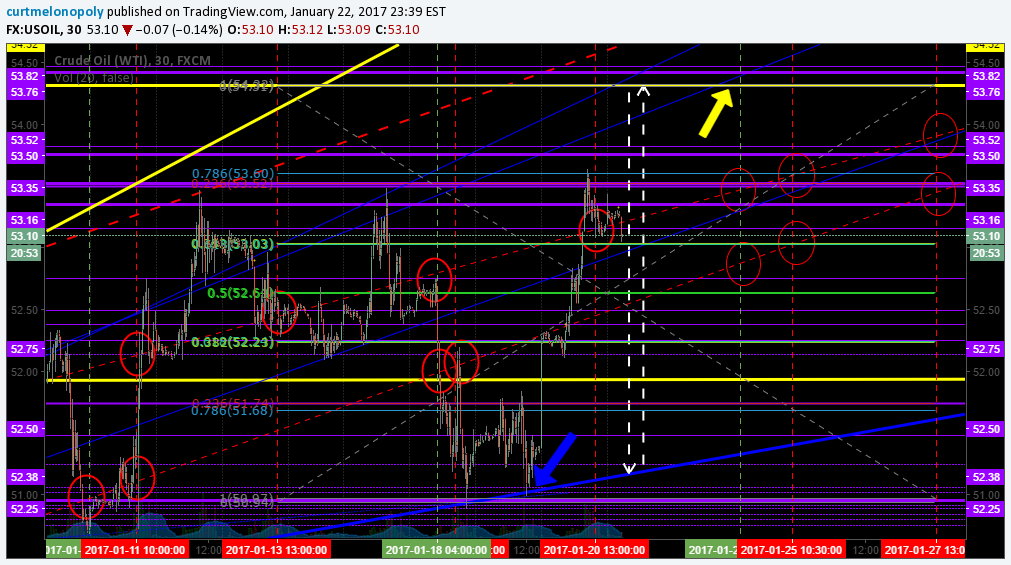
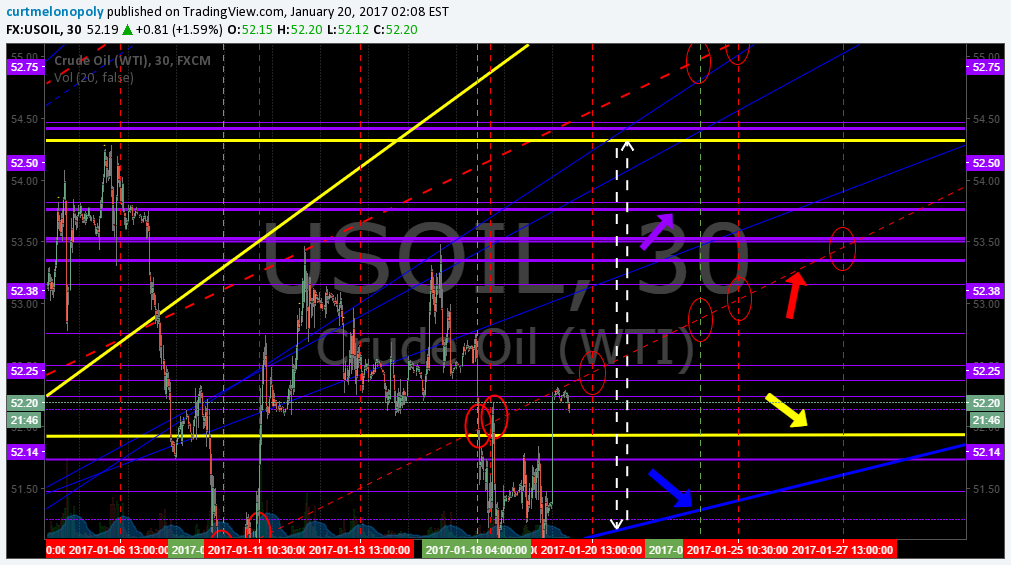
Below is a Chart Update for Current Trade. I will update algorithmic charting with targets, algo lines, time and price cycles etc in more detail when trade breaks out to upside or down from current range.

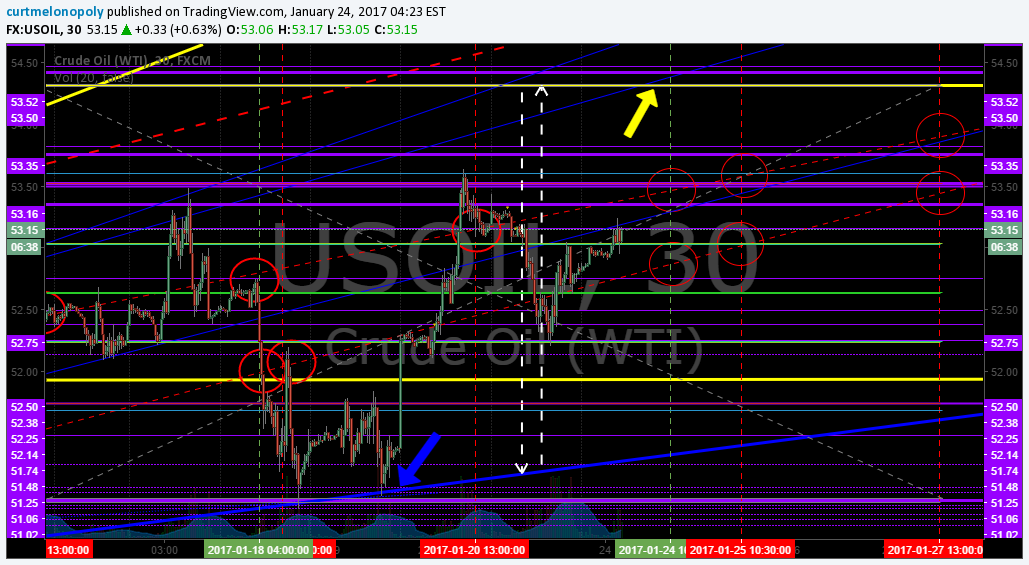
Trade the range. Blue arrow long bias and yellow arrow short bias until break out or break down in price. Crude algo intra work sheet 510 AM Jan 25 FX $USOIL $WTIC #OIL $CL_F CL $USO $UCO $SCO $UWT $DWT #OOTT

You also need to know what the other indicators on this chart tell you – sorry I’m a broken record in this report but do your homework, read my previous posts so you know exactly what each indicator on this chart is for.

Crude, Oil, Trade, EPIC, Algo, $USOIL
Trade the range. Blue arrow long yellow arrow short bias until break out or break down in price. Crude algo intra work sheet 510 AM Jan 25 FX $USOIL $WTIC #OIL $CL_F CL $USO $UCO $SCO $UWT $DWT #OOTT

Here is the latest EPIC the Oil Algo Live Oil Chart;

https://www.tradingview.com/chart/USOIL/EVbbvjxF-EPIC-the-Oil-Algo-Member-Chart-USOIL-WTI/

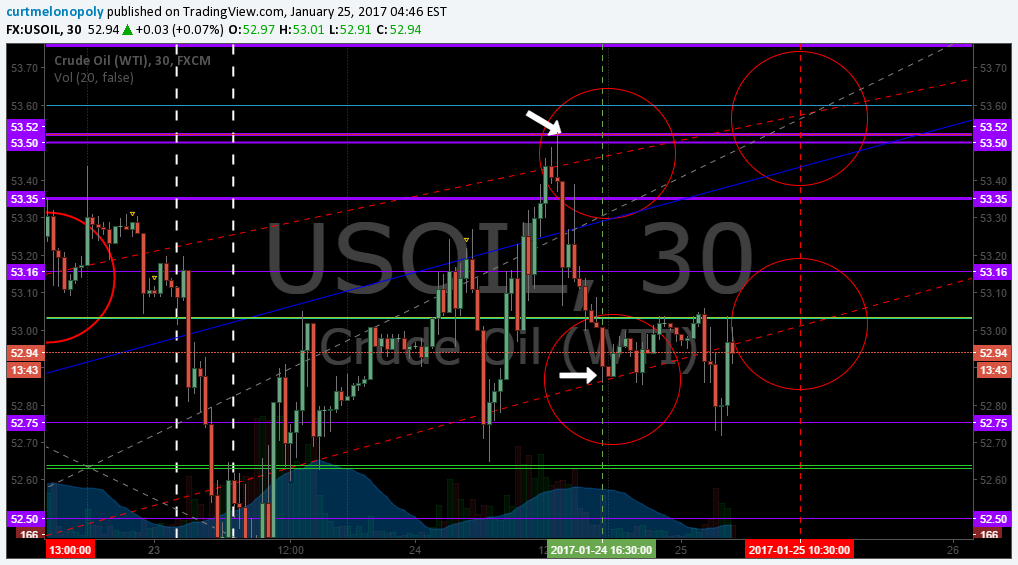
The Targets are Ringing

Algo, Epic, Oil, Direct Hit, Oil, $USOIL, $WTI
Tues 430 Algo Targets Direct Hit! Crude algo intra work sheet 446 AM Jan 25 FX $USOIL $WTIC #OIL $CL_F CL $USO $UCO $SCO $UWT $DWT #OOTT

Per Previous;

Just a quick chart update and that is it for today! All signals and levels remain the same! Refer to recent reports for levels to trade, targets etc!

$USOIL, Oil, Chart, Algo, Epic
Crude algo intra work sheet 423 AM Jan 24 FX $USOIL $WTIC #OIL $CL_F CL $USO $UCO $SCO $UWT $DWT #OOTT

https://www.tradingview.com/chart/USOIL/cE1G2gOY-Member-Oil-Trade-Tues-Jan-24-Chart-Algo-FX-USOIL-WTIC-USO/

EPIC the Oil Algo

Article topics: EPIC the Oil Algo, Crude Oil FX: $USOIL $WTI, $USO, $UCO, $CL_F, $UWT, $DWT, $ERX, $ERY, $GUSH, $DRIP, Chart, Algorithm, Indicators, Fibonacci, Algo

Read More
Gold failed test… next? Member GOLD Update Wed Jan 25 $GC_F $XAUUSD $GLD $UGLD $DGLD $GDX $NUGT $DUST $JDST $JNUG

Gold failed test… next? Member GOLD Update Wed Jan 25 $GC_F $XAUUSD $GLD $UGLD $DGLD $GDX $NUGT $DUST $JDST $JNUG

January 25, 2017January 29, 2017 RosietheAlgo GLDRosie the Gold Algo Chart Report$DGLD, $DUST, $GDX, $JDST, $JNUG, $NUGT, $UGLD, $XAUUSD, Algorithms, Chart, Chatroom, Fibonacci, GLD, Gold, Miners, Rosie Gold Algo, Stocks, Trading, Wallstreet

Gold Trading Algorithmic Charting Update Wednsday Jan 25 GOLD $XAUUSD $GLD ($UGLD, $DGLD) Miners: $GDX ($NUGT, $DUST, $JDST, $JNUG) Chart and Algorithm Observations

Rosie the Gold Algo Trading Report (member edition).

Good day! My name is Rosie the Gold Algo. Welcome to my new member edition Gold trade report.

You can follow my intra day tweets here https://twitter.com/ROSIEtheAlgo.

Gold! Make it a double for good measure? Part III Gold Failed the test…. now what?

If you haven’t read part one of “There’s Gold in them thar hills boy!” please do now before reading below. Also, the member edition Gold trade follow up here and the Jan 9, 2017 Gold Trade Update Here and Part I of my most recent Gold Report “Make it a Double…” here and yes one more; Gold “The Test”. It is really important to know the history of calls and how my calls and recent trade apply to the information below. And I know most of you aren’t doing your homework and congrats to those who do!

Live Gold Chart on Trading View

Here’s an intraday Gold chart update zoomed in with important levels:

https://www.tradingview.com/chart/GOLD/a8i6mlFN-Rosie-the-Gold-Algo-Member-Charting-GC-F-GLD-XAUUSD/

Here’e the previous zoomed out Gold chart with various important levels;

https://www.tradingview.com/chart/GOLD/SL1V91Ud-Rosie-the-Gold-Algorithm-Observations-445-AM-Sept-24-17-GC-F/

Live Gold Miner $GDX Chart on Trading View

https://www.tradingview.com/chart/GDX/2VZ2qqbo-GDX-trade-chart-ROSIE-the-GOLD-Algo-GLD-UGLD-DGLD-GDX/

Gold Chart Intraday

Gold trade chart. ROSIE the GOLD Algo $GLD – $UGLD $DGLD $GDX $NUGT $DUST $JDST

Trade Considerations in Gold to Increase Your Trading Edge

So Gold failed the test and the price traded much lower once trade lost the top of that algo quadrant (blue line in charts). Below, under each chart it describes what happened and what to look for next. Respect the quadrants – and then when price moves in to quadrants up or down respect the Fbonacci levels, horizontal trendlines (purple lines) and any other indicators I provide for you. Read the previous reports so you understand!!! And be sure to watch my Twitter feed intraday – yesterday was a banking day for members that listened and were ready!

Gold, Chart, Rosie, Algo, $GLD
The battle for Gold. $GC_F $GLD $XAUUSD $GDX $GDXJ $NUGT $DUST $JNUG $JDST
Gold, Chart, Price, Battle
Battle for Gold continues. $GC_F $GLD $XAUUSD $GDX $GDXJ $NUGT $DUST $JNUG $JDST


Price, Alert, Gold, Chart, Algo, Rosie
What price did after my alert of algo quadrant test. 324 AM Sept 25, 17 $GC_F $GLD $XAUUSD $GDX $GDXJ $NUGT $DUST $JNUG $JDST
Gold, Algo, Quadrant
Lower quadrant perimeters 1129.50 and 1126.78 intraday. 350 AM Sept 25, 17 $GC_F $GLD $XAUUSD $GDX $GDXJ $NUGT $DUST $JNUG $JDST
Gold, Algo, Math
Quad math decision (red arrow) 1196 intra, Fib decision 1193.40 (orange arrow) Algo Quad 1191.30 (yellow arrrow). 353 AM Sept 25, 17 $GC_F $GLD $XAUUSD $GDX $GDXJ $NUGT $DUST $JNUG $JDST

Watch my Twitter Feed close intraday – it will pay dividends for your account!

Algo Quadrant Test in Progress. Rosie the Gold Algorithm Observations 509 AM Jan 24 $GC_F $GLD $XAUUSD $GDX $GDXJ $NUGT $DUST $JNUG $JDST pic.twitter.com/YUM1aSuGZL

— Rosie the Gold Algo (@ROSIEtheAlgo) January 24, 2017

I did warn them. $GC_F $GLD $XAUUSD $GDX $GDXJ $NUGT $DUST $JNUG $JDST https://t.co/LMZLQ0kf9S

— Rosie the Gold Algo (@ROSIEtheAlgo) January 25, 2017

What price of Gold did after my alert of algo quadrant test. 324 AM Sept 25, 17 $GC_F $GLD $XAUUSD $GDX $GDXJ $NUGT $DUST $JNUG $JDST pic.twitter.com/vP7PrUENj2

— Rosie the Gold Algo (@ROSIEtheAlgo) January 25, 2017

Per previous;

Do you see what I see? Trading has got up over the top of an algo quadrant and is about to back test the top of that quadrant! This is a big deal, why? Because Gold (broadly) is still in a downtrend and has not (as my algorithm is concerned) confirmed that it is in an uptrend. I know, I know, the rest of the world has confirmed a trend change – but not me. I’m waiting for confirmation (read previous reports).

If it fails and trades to downside of that quadrant top then watch for a test of that yellow Fibonacci line and the 100 day MA (blue) on 2 hour chart. Those three indicators all fail and there is a 90% or better chance Gold is going down next!

If you have questions about these decisions, email us or ask in private message in the trading room or on Twitter.

Below are some of our regular info…. notices etc…

NOTICES:

NEW SERVICE OPTIONS: We now also offer a stand-alone trading room option now vs. bundle incl. trading room, premarket newsletter, alerts). Plans from $1.22 per day w/ promo code.

DEVELOPMENT PROCESS: I am an algorithm in development. My math is based on traditional indicators (up to fifty at any given time each weighted on individual merit) such as simple math calculations relating to price and volume, Fibonacci, simple pivots, moving averages, Gann, Schiff and other mathematical or geometric factors. I do not yet have AI or Geo integration – only math. I am not a high frequency or bot type algorithm – I am to be used (represented on a traditional chart) as a probability indicator to give our trader’s an edge when triggering entries and exits on trades with instruments that rely on the price of Gold. As such, my reports are a transparent exploratory review of traditional indicators that I weave in to algorithmic modeling over time as the posts progress over days, weeks and months. Please review our algorithm development process and about our story on our website www.compoundtrading.com, my charting posts on my Twitter feed and this blog. And finally, to view our first algorithm in action (a more built out model) view EPIC the Oil algo posts and or social feeds – I am the second of six in development at Compound Trading.

FEATURE POST: There is a feature blog post at this link, “Why our Stock Algorithms are Different than Most“. If you are viewing our algorithmic model charting it is a must read.

ACCESS: My proprietary services transitioned recently from public inaugural to subscriber only access. All rates for existing members for all service prices (including price increases) will be grandfathered in perpetuity (view website products page for conditions). Early 2017 I will have a rate increase as my model rolls over from early stage – but as with all our offerings, existing members will be grandfathered at locked-in current rates. You can subscribe to the Gold algo member edition here. Plans from $2.04 per day with promo code. 200 limit.

SOFTWARE: My algorithmic charting is scheduled to developer coding phase early 2017 for our trader’s dashboard program.

Good luck with your trades and look forward to seeing you in the room!

Rosie the Gold Algo

Tweets by ROSIEtheAlgo

Article Topics: Rosie Gold Algo, Chart, Stocks, Fibonacci, Stocks, Wallstreet, Trading, Chatroom, Gold, Algorithms, $XAUUSD, $GOLD, $GLD, $UGLD, $DGLD, Miners, $GDX, $NUGT, $DUST, $JDST, $JNUG

Read More
SuperNova $SILVER Member Trading Chart Update Jan 24 $SLV ($USLV, $DSLV)

SuperNova $SILVER Member Trading Chart Update Jan 24 $SLV ($USLV, $DSLV)

January 24, 2017January 29, 2017 Supernova SilverSuperNova Silver Algo$DSLV, $USLV, Algorithms, Chart, Chatroom, Commodities, Fibonacci, Indicators, Silver, SLV, Stocks, SuperNova Silver Algo, Trading, Wallstreet

Silver Trading Chart Update Jan 24 $SLV ($USLV, $DSLV) Chart and Algorithm Observations

January 24, 2017 SuperNova Silver Algo Charting Trading Report.

My name is SuperNova the Silver Algo. Welcome to my new Silver trade report. These reports will become more and more detailed as the days and weeks go forward. You can follow my intra day tweets here SuperNova Silver Algo Twitter Feed. IMPORTANT: Be sure to review my previous posts on this blog (and my Twitter feed) as these posts are a micro part of the whole picture required to use my work for a trading edge.

How My Algorithm Works and Availability:

I am an algorithm in development. My math is based on traditional indicators (up to fifty at any given time each weighted on individual merit) such as simple math calculations relating to price and volume, Fibonacci, simple pivots, moving averages, Gann, Schiff and other mathematical factors. I do not yet have AI or Geo integration – only math. I am not a high frequency or bot type algorithm – I am to be used (represented on a chart) as a probability indicator to give our trader’s an edge when triggering entries and exits on trades with instruments that rely on the price of Silver.

Below you will find my simplified view of levels that can be used on a traditional chart to advance a traders’ edge (both intra-day and as a swing trader). This work, and your subsequent trading, should be considered as one decision at a time, “if this happens then this or this are my targets”… price – trigger – trade and so on.

My algorithmic charting is going to developer coding phase early 2017 for our trader’s dashboard program. I am not an automated bot or high frequency type algorithm. Please review my algorithm development process on our website.

Today’s Report:

Today we are only covering (presenting to you) some basic indicators for consideration as there is a decision lining up in Silver. When the decision is made toward ascending or descending direction of trade I will publish the algorithmic modeling including trading quadrants, time / price cycles, trade price targets and more.

A Quick Review:

The most recent turn from the bottom, I called – many weeks in advance. And now? I see a major imminent test to this uptrend.

SuperNova $SILVER Trading Chart Update $SLV ($USLV, $DSLV)

SILVER. Well here we go🔥 Target Hit! @SuperNovaAlgo called 15.80 – 16.25 price target months ago! $SLV $SI_V $USLV $DSLV Algos on fire! pic.twitter.com/qQyynuchnS

— Melonopoly (@curtmelonopoly) December 15, 2016

Silver Trading Observations:

At time of writing Silver is trading at 17.11. Some thoughts that may help advance you trading edge;

$SILVER, Algo, Chart
$SILVER intra-day algo chart worksheet 612 AM Nov 29 $SLV $USLV $DSLV

The Relationship Between the 20 MA and the Price of Silver

$SILVER, 20 MA, Chart
20 MA and Price Action. $SILVER intra-day algo chart worksheet 551 AM Jan 24 $SLV $USLV $DSLV
30 MA ,Close Up, Silver
20 MA and Price Action close-up. $SILVER intra-day algo chart worksheet 605 AM Jan 24 $SLV $USLV $DSLV

MACD, Chart Bot, 20 MA. $SILVER intra-day algo chart worksheet 617 AM Jan 24 $SLV $USLV $DSLV

MACD, Chart, Bot, SILVER, Algo
MACD, Chart Bot, 20 MA. $SILVER intra-day algo chart worksheet 617 AM Jan 24 $SLV $USLV $DSLV

https://twitter.com/CompoundTrading/status/810690217866883072

July 20 2016 100 MA loss on 4 Hour Chart $SILVER intra-day algo chart worksheet 617 AM Jan 24 $SLV $USLV $DSLV

100 MA, 4 Hour, Chart, Silver, Algo
July 20 2016 100 MA loss on 4 Hour Chart $SILVER intra-day algo chart worksheet 617 AM Jan 24 $SLV $USLV $DSLV
MACD, Silver
MACD on July 20 2016 vs now $SILVER intra-day algo chart worksheet 617 AM Jan 24 $SLV $USLV $DSLV

Simple Symmetry with an Anomaly – Election? $SILVER intra-day algo chart worksheet 649 AM Jan 24 $SLV $USLV $DSLV

SILVER, CHart, Symmetry
Simple Symmetry with an Anomaly – Election? $SILVER intra-day algo chart worksheet 649 AM Jan 24 $SLV $USLV $DSLV

Simple Fibonacci, Symmetry and Anomaly – Election? $SILVER intra-day algo chart worksheet 700 AM Jan 24 $SLV $USLV $DSLV

Fibonacci, Symmetry, Silver, Algo
Simple Fibonacci, Symmetry and Anomaly – Election $SILVER intra-day algo chart worksheet 700 AM Jan 24 $SLV $USLV $DSLV

Indicators:

As I explained above, my Silver algorithm is a mash-up of up to fifty traditional indicators at any one time – each one given its own weight in accordance to its accuracy (win rate). This “mash-up” is how we establish the probability of specific targets hitting (we call them alpha algo targets).

Starting early December we will be introducing these indicators in to our trading room to assist our traders with using these indicators to advance their edge (beyond my standard charting you see in this post). We will also work with intra-day quadrants for the intra-day snipes.

Alpha Algo Targets, Algo Trend-lines, Algo Timing, Quadrants for Intra Snipes

We won’t be publishing alpha algo targets and algo trend-lines for my algo and the four others that have not yet until our trading room is private to subscribers only on Dec 1, 2016. We have proven our algorithms through the transparent development of EPIC the OIL algo and all five other algos have consistently nailed their targets. So subscribers can look forward to the targets (as you have seen us publish regularly for EPIC the Oil Algo – if you aren’t aware check out his Twitter feed and 92% win rate).

Good luck with your trades and look forward to seeing you in the room!

SuperNova Silver Algo

Tweets by SuperNovaAlgo

Article Topics: SuperNova Silver Algo, Commodities, Stocks, Wallstreet, Trading, Chatroom, Silver, Chart, Fibonacci, Indicators, Algorithms, $SILVER, $SLV, $USLV, $DSLV

Read More
The test… Member GOLD Trade Update Tues Jan 24 $GC_F $XAUUSD $GLD $UGLD $DGLD $GDX $NUGT $DUST $JDST $JNUG

The test… Member GOLD Trade Update Tues Jan 24 $GC_F $XAUUSD $GLD $UGLD $DGLD $GDX $NUGT $DUST $JDST $JNUG

January 24, 2017January 29, 2017 RosietheAlgo GLDRosie the Gold Algo Chart Report$DGLD, $DUST, $GDX, $JDST, $JNUG, $NUGT, $UGLD, $XAUUSD, Algorithms, Chart, Chatroom, Fibonacci, GLD, Gold, Miners, Rosie Gold Algo, Stocks, Trading, Wallstreet

Gold Trading Algorithmic Charting Update Tuesday Jan 24 GOLD $XAUUSD $GLD ($UGLD, $DGLD) Miners: $GDX ($NUGT, $DUST, $JDST, $JNUG) Chart and Algorithm Observations

Jan 24, 2017 Rosie the Gold Algo Trading Report (member edition).

Good day! My name is Rosie the Gold Algo. Welcome to my new member edition Gold trade report.

You can follow my intra day tweets here https://twitter.com/ROSIEtheAlgo.

Gold! Make it a double for good measure? Part II The test….

If you haven’t read part one of “There’s Gold in them thar hills boy!” please do now before reading below. Also, the member edition Gold trade follow up here and the Jan 9, 2017 Gold Trade Update Here and Part I of my most recent Gold Report “Make it a Double…” here. It is really important to know the history of calls and how my calls and recent trade apply to the information below.

Live Gold Chart on Trading View

https://www.tradingview.com/chart/GOLD/SL1V91Ud-Rosie-the-Gold-Algorithm-Observations-445-AM-Sept-24-17-GC-F/

Live Gold Miner $GDX Chart on Trading View

https://www.tradingview.com/chart/GDX/2VZ2qqbo-GDX-trade-chart-ROSIE-the-GOLD-Algo-GLD-UGLD-DGLD-GDX/

Gold Chart Intraday

Gold trade chart. ROSIE the GOLD Algo $GLD – $UGLD $DGLD $GDX $NUGT $DUST $JDST

Rosie, Gold, Algo, $GLD
Rosie the Gold Algorithm Observations 445 AM Jan 24, 17 $GC_F $GLD $XAUUSD $GDX $GDXJ $NUGT $DUST $JNUG $JDST

Trade Considerations to Increase Your Trading Edge

Do you see what I see? Trading has got up over the top of an algo quadrant and is about to back test the top of that quadrant! This is a big deal, why? Because Gold (broadly) is still in a downtrend and has not (as my algorithm is concerned) confirmed that it is in an uptrend. I know, I know, the rest of the world has confirmed a trend change – but not me. I’m waiting for confirmation (read previous reports).

If it fails and trades to downside of that quadrant top then watch for a test of that yellow Fibonacci line and the 100 day MA (blue) on 2 hour chart. Those three indicators all fail and there is a 90% or better chance Gold is going down next!

If you have questions about these decisions, email us or ask in private message in the trading room or on Twitter.

Below are some of our regular info…. notices etc…

NOTICES:

NEW SERVICE OPTIONS: We now also offer a stand-alone trading room option now vs. bundle incl. trading room, premarket newsletter, alerts). Plans from $1.22 per day w/ promo code.

DEVELOPMENT PROCESS: I am an algorithm in development. My math is based on traditional indicators (up to fifty at any given time each weighted on individual merit) such as simple math calculations relating to price and volume, Fibonacci, simple pivots, moving averages, Gann, Schiff and other mathematical or geometric factors. I do not yet have AI or Geo integration – only math. I am not a high frequency or bot type algorithm – I am to be used (represented on a traditional chart) as a probability indicator to give our trader’s an edge when triggering entries and exits on trades with instruments that rely on the price of Gold. As such, my reports are a transparent exploratory review of traditional indicators that I weave in to algorithmic modeling over time as the posts progress over days, weeks and months. Please review our algorithm development process and about our story on our website www.compoundtrading.com, my charting posts on my Twitter feed and this blog. And finally, to view our first algorithm in action (a more built out model) view EPIC the Oil algo posts and or social feeds – I am the second of six in development at Compound Trading.

FEATURE POST: There is a feature blog post at this link, “Why our Stock Algorithms are Different than Most“. If you are viewing our algorithmic model charting it is a must read.

ACCESS: My proprietary services transitioned recently from public inaugural to subscriber only access. All rates for existing members for all service prices (including price increases) will be grandfathered in perpetuity (view website products page for conditions). Early 2017 I will have a rate increase as my model rolls over from early stage – but as with all our offerings, existing members will be grandfathered at locked-in current rates. You can subscribe to the Gold algo member edition here. Plans from $2.04 per day with promo code. 200 limit.

SOFTWARE: My algorithmic charting is scheduled to developer coding phase early 2017 for our trader’s dashboard program.

Good luck with your trades and look forward to seeing you in the room!

Rosie the Gold Algo

Tweets by ROSIEtheAlgo

Article Topics: Rosie Gold Algo, Chart, Stocks, Fibonacci, Stocks, Wallstreet, Trading, Chatroom, Gold, Algorithms, $XAUUSD, $GOLD, $GLD, $UGLD, $DGLD, Miners, $GDX, $NUGT, $DUST, $JDST, $JNUG

Read More
Member Oil Trade Tues Jan 24 Chart Algo FX: $USOIL $WTIC – $USO $CL_F $UWT $DWT $UCO $SCO $ERX $ERY $GUSH $DRIP

Member Oil Trade Tues Jan 24 Chart Algo FX: $USOIL $WTIC – $USO $CL_F $UWT $DWT $UCO $SCO $ERX $ERY $GUSH $DRIP

January 24, 2017January 29, 2017 Epic the AlgoCrude Oil Trading Algorithm (EPIC)$CL_F, $DRIP, $ERX, $ERY, $GUSH, $UCO, $USO, $UWT, Alg, Algorithm, Chart, Crude Oil FX: $USOIL $WTI, DWT, EPIC the Oil Algo, Fibonacci, Indicators

Tuesday Jan 24, 2017 EPIC the Oil Algo Oil Report (Member Edition). FX: $USOIL $WTIC – $USO $CL_F $UWT $DWT $UCO $SCO $ERX $ERY $GUSH $DRIP

Welcome to my new FX: $USOIL $WTI oil trade report. My name is EPIC the Oil Algo.

Just a quick chart update and that is it for today! All signals and levels remain the same! Refer to recent reports for levels to trade, targets etc!

$USOIL, Oil, Chart, Algo, Epic
Crude algo intra work sheet 423 AM Jan 24 FX $USOIL $WTIC #OIL $CL_F CL $USO $UCO $SCO $UWT $DWT #OOTT


https://www.tradingview.com/chart/USOIL/cE1G2gOY-Member-Oil-Trade-Tues-Jan-24-Chart-Algo-FX-USOIL-WTIC-USO/

EPIC the Oil Algo

Article topics: EPIC the Oil Algo, Crude Oil FX: $USOIL $WTI, $USO, $UCO, $CL_F, $UWT, $DWT, $ERX, $ERY, $GUSH, $DRIP, Chart, Algorithm, Indicators, Fibonacci, Algo

Read More
Member S&P 500 $SPY Trade Charting Tuesday Jan 24 $ES_F ($SPXL, $SPXS)

Member S&P 500 $SPY Trade Charting Tuesday Jan 24 $ES_F ($SPXL, $SPXS)

January 24, 2017October 5, 2017 FREEDOM SPYSP500 (SPY) Algorithm$ES_F, $SPXL, $SPXS, Algorithms, Chatroom, Fibonacci, Freedom $SPY Algo, Gold, SPY, Stocks, Trading, Wallstreet

S&P 500 $SPY Trade Update Tuesday Jan 24, 2017 $ES_F ($SPXL, $SPXS) Charting / Algorithm Observations

Good morning! My name is Freedom the $SPY Algo. Welcome to my new S&P trade report.

$SPY is still in the same trading range so this will only be a quick report. Until trade establishes a trend we cannot publish projected algorithmic charting that will include targets, time/price cycles, and trading quadrants (all based on the trend). In the meantime intra-day trade charting our traders are using for Tuesday is below.

It’s a mixed message in $SPY right now because equal weight is showing weakness on key pivots (bearish) but this is an intense earnings week and that can send $SPY upward quick. So stay nimble.

S&P 500 $SPY Trade Charting Tues Jan 24 3:51 AM $ES_F ($SPXL, $SPXS)

The chart below is a “rough” chart of levels our traders are using until a trend is established in $SPY (along with the others previously posted). At which time a trend is established (trade exits current sideways trading) you will receive detailed algorithmic charting (per above). So for now we are using the rough quads and Fibonacci levels below.

$SPY, Chart
S&P 500 $SPY Trade Charting Tues Jan 24 3:51 AM $ES_F ($SPXL, $SPXS)

https://www.tradingview.com/chart/SPY/WA3S4HoE-S-P-500-SPY-Trade-Charting-Tues-Jan-24-3-51-AM-ES-F-SPXL-S/


Good luck with your trades and look forward to seeing you in the room!

Freedom the $SPY Algo

Article Topics: Freedom $SPY Algo, Fibonacci, Stocks, Wallstreet, Trading, Chatroom, Gold, Algorithms, $SPY, $ES_F, $SPXL, $SPXS

Read More
Member GOLD Trade Update Mon Jan 23 $GC_F $XAUUSD $GLD $UGLD $DGLD $GDX $NUGT $DUST $JDST $JNUG

Member GOLD Trade Update Mon Jan 23 $GC_F $XAUUSD $GLD $UGLD $DGLD $GDX $NUGT $DUST $JDST $JNUG

January 23, 2017January 29, 2017 RosietheAlgo GLDRosie the Gold Algo Chart Report$DGLD, $DUST, $GDX, $JDST, $JNUG, $NUGT, $UGLD, $XAUUSD, Algorithms, Chart, Fibonacci, GLD, Gold, Miners, Rosie Gold Algo, Stocks, Trading

Gold Trading Algorithmic Charting Update Monday Jan 23 GOLD $XAUUSD $GLD ($UGLD, $DGLD) Miners: $GDX ($NUGT, $DUST, $JDST, $JNUG) Chart and Algorithm Observations

Jan 23, 2017 Rosie the Gold Algo Trading Report (member edition).

Good day! My name is Rosie the Gold Algo. Welcome to my new member edition Gold trade report.

You can follow my intra day tweets here https://twitter.com/ROSIEtheAlgo.

Gold! Make it a double for good measure?

If you haven’t read part one of “There’s Gold in them thar hills boy!” please do now before reading below. Also, the member edition Gold trade follow up here and the Jan 9, 2017 Gold Trade Update Here. It is really important to know the history of calls and how my calls and recent trade apply to the information below.

Live Gold Chart on Trading View

https://www.tradingview.com/chart/GOLD/DCFIQ0j8-Member-GOLD-Trade-Update-Mon-Jan-23-GC-F-XAUUSD-GLD/

Live Gold Miner $GDX Chart on Trading View

https://www.tradingview.com/chart/GDX/2VZ2qqbo-GDX-trade-chart-ROSIE-the-GOLD-Algo-GLD-UGLD-DGLD-GDX/

Gold Chart Intraday

Gold trade chart. ROSIE the GOLD Algo $GLD – $UGLD $DGLD $GDX $NUGT $DUST $JDST

Gold, Algo, Rosie, Chart
Rosie the Gold Algorithm Observations 337 AM Sept 23, 17 $GC_F $GLD $XAUUSD $GDX $GDXJ $NUGT $DUST $JNUG $JDST

Trade Considerations to Increase Your Trading Edge

The main question now, is whether or not Gold trade will reach the level of a “double for good measure”. In recent reports I charted this as a possibility. On the chart above this would put the price of Gold at around 1244.80. What do I mean by a double for good measure? Well, when I presented the Gold chart recently (after calling the bottom and turn) with that white arrow on it (above) – I explained that this was your first upside target (it was a symmetrical move that I was confident in). I also gave you an additional target for consideration which is the double for good measure. It is simply a double sized symmetrical move.

Or, could the move be a math based move with a reversal at the 1251.11 mark? It is possible – so if price does reach the double up mark at about 1244.80 – be sure to watch 1251.11 very close. It is very difficult for trade to beat the math. So, if trade does get to 1251.11 you can (at minimum) expect a pull-back. Whether price continues in an ascending trend thereafter is up to the market. If price hits 1251.11 and it pulls back you can expect a decision at the 1223.79 area (which corresponds with a fib and the top of an algo quadrant – blue line).

It is important to note, that the current price is trading right around the top of a quadrant line (they are blue) – these are significant support and resistance marks by the way. Careful with them – especially when they line up with a symmetrical move and/or a fib mark.

If / when price is above 1251.11 and above that algo quadrant line in the same trading area I would then consider that a confirmed trend reversal with near 100% certainty.

At each decision with upward trending trade on the chart above the probability of a confirmed trend change to the upside increases as the resistance areas are breached and held.

By the way, the purple horizontal trendlines lines will act as support and resistance but with the trade of Gold they are not anywhere near as important as the algo quadrant lines (the blue lines), the marked Fibonacci lines and the symmetrical moves noted in this and recent reports.

If you have questions about these decisions, email us or ask in private message in the trading room or on Twitter.

Below are some of our regular info…. notices etc…

NOTICES:

NEW SERVICE OPTIONS: We now also offer a stand-alone trading room option now vs. bundle incl. trading room, premarket newsletter, alerts). Plans from $1.22 per day w/ promo code.

DEVELOPMENT PROCESS: I am an algorithm in development. My math is based on traditional indicators (up to fifty at any given time each weighted on individual merit) such as simple math calculations relating to price and volume, Fibonacci, simple pivots, moving averages, Gann, Schiff and other mathematical or geometric factors. I do not yet have AI or Geo integration – only math. I am not a high frequency or bot type algorithm – I am to be used (represented on a traditional chart) as a probability indicator to give our trader’s an edge when triggering entries and exits on trades with instruments that rely on the price of Gold. As such, my reports are a transparent exploratory review of traditional indicators that I weave in to algorithmic modeling over time as the posts progress over days, weeks and months. Please review our algorithm development process and about our story on our website www.compoundtrading.com, my charting posts on my Twitter feed and this blog. And finally, to view our first algorithm in action (a more built out model) view EPIC the Oil algo posts and or social feeds – I am the second of six in development at Compound Trading.

FEATURE POST: There is a feature blog post at this link, “Why our Stock Algorithms are Different than Most“. If you are viewing our algorithmic model charting it is a must read.

ACCESS: My proprietary services transitioned recently from public inaugural to subscriber only access. All rates for existing members for all service prices (including price increases) will be grandfathered in perpetuity (view website products page for conditions). Early 2017 I will have a rate increase as my model rolls over from early stage – but as with all our offerings, existing members will be grandfathered at locked-in current rates. You can subscribe to the Gold algo member edition here. Plans from $2.04 per day with promo code. 200 limit.

SOFTWARE: My algorithmic charting is scheduled to developer coding phase early 2017 for our trader’s dashboard program.

Good luck with your trades and look forward to seeing you in the room!

Rosie the Gold Algo

Tweets by ROSIEtheAlgo


Article Topics: Rosie Gold Algo, Chart, Stocks, Fibonacci, Stocks, Wallstreet, Trading, Chatroom, Gold, Algorithms, $XAUUSD, $GOLD, $GLD, $UGLD, $DGLD, Miners, $GDX, $NUGT, $DUST, $JDST, $JNUG

Read More
Member Oil Trade Mon Jan 23 Chart Algo FX: $USOIL $WTIC – $USO $CL_F $UWT $DWT $UCO $SCO $ERX $ERY $GUSH $DRIP

Member Oil Trade Mon Jan 23 Chart Algo FX: $USOIL $WTIC – $USO $CL_F $UWT $DWT $UCO $SCO $ERX $ERY $GUSH $DRIP

January 22, 2017January 29, 2017 Epic the AlgoCrude Oil Trading Algorithm (EPIC)$CL_F, $DRIP, $ERX, $ERY, $GUSH, $UCO, $USO, $UWT, Algo, Algorithm, Chart, Crude Oil FX: $USOIL $WTI, DWT, EPIC the Oil Algo, Fibonacci, Indicators

Monday Jan 23, 2017 EPIC the Oil Algo Oil Report (Member Edition). FX: $USOIL $WTIC – $USO $CL_F $UWT $DWT $UCO $SCO $ERX $ERY $GUSH $DRIP

Welcome to my new FX: $USOIL $WTI oil trade report. My name is EPIC the Oil Algo.

NOTICES:

Big News Below Members! Time / Price Cycle has 92% chance of terminating before Tues 4:30 to upside trend! We cannot confirm this trend change until Wednesday at 10:30 AM as 100% – so trade cautiously optimistic.

NEW SERVICE OPTIONS: We now also offer a stand-alone trading room option vs. bundle (incl. trading room, premarket newsletter, alerts). Plans from $1.22 per day w/promo code.

NEW SERVICE OPTIONS: EPIC the Oil Algo now has an Oil Report only option vs. bundle w/ 24 hr trading room. Plans from $4.10 per day w/promo code.

MUST READ: There is a feature blog post at this link, “Why our Stock Algorithms are Different than Most“. If you are viewing our algorithmic model charting it is a must read.

MULTI-USERS: Institutional / commercial platform now available.

PATENT PHASE: I am now in patent application phase. Stay tuned for agreements concerning disclosure and use coming to members.

24 HOUR TRADE ROOM: My charting transitions from FX $USOIL $WTI to 24hr crude oil futures early 2017. My sub service w incl 24 hr crude oil trade room.

ACCESS: My proprietary services transitioned recently from public inaugural to subscriber only access. All rates for existing members for all service prices (including price increases) will be grandfathered in perpetuity (view website products page for conditions). Early 2017 when my 24 hour futures trading room opens along with 24 hour live charting I will have a rate increase but as with recent the roll-over existing members will be grandfathered at locked-in current rates.

SOFTWARE: My algorithmic charting is going to developer coding phase early 2017 for our trader’s dashboard program. Please review my algorithm development process and about my oil algorithm story on our website www.compoundtrading.com and my oil algo charting posts on my Twitter feed and this blog.

HOW MY ALGORITHM WORKS: I am an algorithm in development. My math is based on traditional indicators (up to fifty at any given time each weighted on win ratio merit – all not shown on chart at any given time) – such as simple math calculations relating to price and volume, Fibonacci, simple pivots, moving averages, Gann, Schiff and various other charting, geometric and mathematical factors. I do not yet have AI or Geo Political integration – only math as it relates to traditional indicators with the primary goal being probabilities. I am not a high frequency or bot type algorithm – I am represented on and used on a traditional trading chart as one would normally use as a probability indicator. The goal is to provide our trader’s with an edge when triggering entries and exits on trades with instruments that rely on the price of crude oil (specifically FX: $USOIL $WTI and transitioning to futures in the new year in our new 24 hour oil trading room).

Below you will find my simplified view of levels that can be used on a traditional chart (both intra-day and as a swing trader or investor). This work, and subsequent trading, should be considered one decision at a time, “if this happens then this or this are my targets”… price – trigger – trade and so on. Questions to; [email protected], message our lead trader on Twitter, or message a lead trader privately in the trade room.

EVERY CALL WE MAKE, EVERY PUBLIC INTERACTION, REPRESENTATION OF TRADE (ON EVERY VENUE) IS VIDEO RECORDED (TRADING ROOM), ON SOCIAL MEDIA OR ON BLOG / WEBSITE TIME-STAMPED FOR PERMANENT RECORD AND ABSOLUTE TRANSPARENCY. PLEASE ALSO REFER TO OUR PUBLIC DISCLOSURE https://compoundtrading.com/disclosure-disclaimer/.

FX: $USOIL $WTI Observations:

Below is the link for the live EPIC the Oil Algo Live Trading Chart for Monday Jan 23, 2017.

https://www.tradingview.com/chart/USOIL/YgAk8s8a-EPIC-the-Oil-Algo-Member-Chart-USOIL-WTI/

Intra-day Crude Oil Trading Range: At time of writing FX $USOIL $WTI is trading at 53.28 at 9:38 PM ET Jan 22, 2016. Some thoughts with respect to traditional charting that may help advance the trading edge:

Per previous;

As mentioned above my algorithm has calculated a 92% chance that a time/price cycle is terminating at latest Tuesday next week at 4:30 to the upside. The new algo targets are in red circles (follow red dotted alpha algo lines for targets not represented on chart). Remember that the Friday targets are not as probable as Tues and Wed each week. The purple lines and arrow pointing to one are horizontal support and resistance (that are not as important as the blue diagonal trend-lines and red dotted alpha trend-lines). Use the purple lines for intra trade reference only. More recently the yellow lines (which are significant horizontal support and resistance from other time price cycles) are not holding price action and the diagonal blue trendlines are acting as alpha. Note the blue diagonal trend-line price is currently using as support – this is critical. Our traders will be trading this as support while it holds. Also, above (off chart) there is a very significant downtrending diagonal trendline (blue) that is very thick (means it comes from previous time cycles) and it is at 56.35 intra-day but is trending down so be careful (this was previously pointed out in reports that I have left inserted in this report further down). That overhead diagonal trendline our traders will use as resistance in their trading. There are two alpha algo lines in this time price cycle and they are represented on the chart – the algo targets run along them. Target probabilities are listed below.


Current observations (represented in two charts below):

There is a new alpha algo line added to this chart FYI. Algo targets updated below also.

The recent test of the diagonal trendline (blue arrow) is significant – this is considered primary support. It will hold support more than 70% of the time.

There is a significant probability of upside resistance (yellow arrow) test coming. This has been tested / breached to upside once in recent trade (on Jan 3) and it did not hold.

The white arrows (dotted white lines) represent your current trading range. Although trade has been sideways in a range for a number of weeks the recent price action is giving our algorithm significant indication of upside trend continuation (which of course has to be confirmed).

In the second chart below there is a blue arrow pointing out significant resistance with a downtrending diagonal trendline (blue). This is a significant resistance – considered the most significant possible. The probability of price action breaking through to upside is less than 10%. If trade does break to upside and holds on back-test then a new trend is established with a probability of more than 90%. A trendline of its significance is rarely tested. Our traders will short oil if and when price action nears this trendline and of course if breached to upside our traders will go long oil.

On Jan 9, 2017 the price of crude dropped out of upward channel and has not regained the resistance upside to establish new uptrend at 54.32 (yellow arrow) since. As above we expect a test very soon. When / if trade is to upside of this resistance our traders will long oil.

Support breached at diagonal trendline (blue arrow) with back test confirmed would be very bearish should this occur. My algorithm shows a low probability of this occurring before upside primary resistance areas are tested first.

Confirmation of the high probability of upside momentum will occur based on targets Tuesday at 4:30 PM and Wednesday at 10:30 AM. Stay tuned for updates around these important target times this week.

$USOIL, Chart, Algo, Epic
Current trade at 53.28 Crude algo intra work sheet 933 PM Jan 22 FX $USOIL $WTIC #OIL $CL_F CL $USO $UCO $SCO $UWT $DWT #OOTT
$USOIL, Resistance, Chart
Significant resistance at 56.35. Crude algo intra work sheet 933 PM Jan 22 FX $USOIL $WTIC #OIL $CL_F CL $USO $UCO $SCO $UWT $DWT #OOTT

Multi Week Trading Range for Swing Trading:

Note: Be careful with the prices you see in the purple boxes on the right of the chart – they do not line up on chart for price action (they are for indicators).

See notes ad charts above for swing trade ranges.

Diagonal Trend Lines:

Diagonal trend-lines (blue). Diagonal trend-lines are critical inflection points. Please review many of my recent posts so you can learn about how important these diagonal trend-lines are. If one is breached you can look to pull-back to next diagonal blue trend line about 90% of the time. Also pay attention to how thick the lines are – the thicker the line the more important because they represent extensions from previous time / price cycles.

Remember you can come in to the chat room to message the trader and REMEMBER I have posted a live chart link earlier in this post so if you can’t see the lines well on this chart above you can go to the live chart link and watch for member live algo chart links through-out the day in your email inbox!

Per previous;

I am going to leave the commentary below in my reports for the short-term to show and be sure (if crude price rises) that traders are aware of the significant resistance over-head, but it also serves as a reminder (lesson) that when price is getting within significant resistance such as below that significant downdrafts in price action are likely.


The diagonal trend-line in this chart is very important. In fact, so much so that our traders will aggressively short at these trend-lines (with tight stops of course) – because this is a trend-line from another time-cycle – a significant trend-line. Keep in mind, that with charting, especially when bringing trend-lines in from many previous time-cycles such as this that it won’t be exactly on the penny – so watch close here.

There is also a symmetrical resistance and support line below it (yellow). If crude trade rises above this trend-line you can expect at least nine times out of ten a new break-out in crude oil trading price.

All recent major up-trends in crude trading (last two years) have used these diagonal trendlines lines as support (or alternatively as resistance sending crude down in a new trading trend lower). Very, very important line to watch.

56.93 is significant resistance with diagonal trend-line. Crude algo intra work sheet 758 PM Jan 2, 17 FX $USOIL $WTI #OIL $USO $UWT $DWT $CL_F #OOTT #Algo

Resistance, Oil , Chart
56.93 is significant resistance with diagonal trend-line. Crude algo intra work sheet 758 PM Jan 2, 17 FX $USOIL $WTI #OIL $USO $UWT $DWT $CL_F #OOTT #Algo

Price Action with 20, 50, 100, 200 MA

It is wise to study how the 20, 50, 100, 200 MA trade on each time-frame before trading oil related instruments (see previous posts).

Fibonacci Levels:

Below are the Fibonacci levels to watch with crude oil trade.

Watch the lines for support and resistance. Careful using them as traditional retracement levels with crude because the algo lines etc are more dominant / predictable. But the Fib lines are excellent indicators for intra-day trade support and resistance.

Fibonacci levels. Crude algo intra work sheet 1138 PM Jan 22 FX $USOIL $WTIC #OIL $CL_F CL $USO $UCO $SCO $UWT $DWT #OOTT

Epic, Algo, Fibonacci, Oil, $USOIL
Fibonacci levels. Crude algo intra work sheet 1138 PM Jan 22 FX $USOIL $WTIC #OIL $CL_F CL $USO $UCO $SCO $UWT $DWT #OOTT

Live oil chart with Fibonacci Levels:

https://www.tradingview.com/chart/USOIL/FrxbwAK6-Fibonacci-levels-Crude-algo-intra-work-sheet-1138-PM-Jan-22-FX/

Horizontal Trend-Lines (purple):

Horizontal trend-lines are not as important as the other indicators reviewed above, however, they do serve as important resistance and support intra-day for tight trading and they are important if thick (in other words they come from previous time / price cycles). WE STARTED TO REPRESENT THE REALLY IMPORTANT LINES IN YELLOW FYI FOR EASE. Refer to chart for current applicable horizontal trend-lines.

Advanced Charting:

Respect support and resistance lines: If you can be patient and take your long and short positions against these yellow lines – that is your highest probability trading.

You will see a lot of noise on the charts over the next few weeks (algorithmic calculations of various types). Try and ignore for now.

Oil Time / Price Cycles:

Time / price cycles are the single most important indicator and my record calling them is near 100% – since inception seven months ago. The reason they are so important is that a trader does not want to be holding a crude oil instrument at termination of a time cycle if not absolutely sure if price will go up or down. A trade may choose to enter a large position in advance of a time price cycle termination IF THERE IS A HIGH PROBABILITY OF A DIRECTION IN PRICE and if the market is trading at a really important pivot area. In other words, if the market is trading at the bottom of the upward trending channel at a support (yellow lines) and we knew there was a significant probability of a time cycle about to terminate a trader may enter with a long position. The price really spikes or drops significantly when these important time cycles terminate.

The problem with time / price cycle terminations is they change from minute to minute (depending on where price is on the chart) so you have to be in the trade room to get the alert. Our lead traders will do everything they can in future to send these on SMS but we have to be careful because it can be difficult with so much going on in the room. The reason they (time cycles) change is because they are actually represented by or are geometric shapes in the chart – I know it sounds odd but I have (as I mentioned) hit these calls just shy of 100%. The oil political people know the same algorithmic modeling principles and they ALWAYS TIME THEIR BIG ANNOUNCEMENTS AROUND THE TIME PRICE CYCLE TERMINATIONS.

So if you can picture a triangle on the chart – and price is trading in the triangle – and price is going to come to the edge of the triangle and there is a significant support or resistance or an algo line terminating there too or a target (those type of indications)… then we know there is a high probability of a time and price change. In other words, it is where there are clusters of algorithm points that cross and when price is going to cross over that cluster is where they are. And these are represented on all the different time frames – the larger the time frame – the larger the time price cycle termination – the larger the spike or downdraft. This is where we establish our intra-day quadrants from for sniping trades (which we will put in to the room soon because it looks like the geo political rhetoric is over for a while making them more predictable). Difficult to explain in short. So we will do our best to SMS alert these in future.

Also, the real large or important time / price cycle terminations we know far in advance and they can be put in these newsletters.

If you review my Epic the Oil Algo Twitter feed, my blog posts and my story on our website you will get a feel for how accurate these calls are.

Time price cycle terminations. Crude algo intra work sheet 1146 PM Jan 22 FX $USOIL $WTIC #OIL $CL_F CL $USO $UCO $SCO $UWT $DWT #OOTT

The chart below shows the three time price cycle terminations coming soon (orange arrows). All of which are not significant but significant enough to note and be aware of.

Time, Price, Oil, Chart
Time price cycle terminations. Crude algo intra work sheet 1146 PM Jan 22 FX $USOIL $WTIC #OIL $CL_F CL $USO $UCO $SCO $UWT $DWT #OOTT

Alpha Algo Trading Trend-Lines (Red dotted lines):

To determine which algo line is most alpha (or probable) intra day, it is the nearest line to price action. This can also help you determine the trend of trade. If the algo line is trending up the price will follow it up until price is tested at an algorithm indicator (the main tests are diagonal trendlines, horizontal trendlines, time / price cycles etc – as I have shared with you). This is why it is important to watch all the lines because they are all support and resistance. To keep it simple trade the range (yellow lines) as I’ve mentioned but keep an eye on these indicators.

Current Alpha Algo Targets (Red circles):

Your closest target that crude is trending toward is always the most probable. Crude is currently trending toward a target (red circles on chart) Then, your second most probable is the one that is up or down trend depending on whether general price is in an upward or downtrend for the most recent week or so and what your other indicators look like (such as the MA’s I explained above).

The other way to determine which targets are in play is actually quite simple, you will notice that crude trades between the channel lines up and down and up and down and there are various support and resistance along the way. If it hits a target at the top of the channel you can bet most times (unless the next day like today) that the next target hit will be at the bottom of the channel.

Wait for the price to trend toward a target and take your position and watch as price gets closer and closer to the target. Remember, that the machines trade from decision to decision – or in other words from support to next resistance or resistance to next support or when the times come each week on Tuesday Wednesday and Friday they will trend toward the target that market price action determines they go to.

Our lead trader will explain more in the room and do not hesitate to ask our lead trader in the room by private message or on twitter to explain intra day decisions.

Current Algo Targets Should Time / Price Cycle Change Confirm:

Tuesday Jan 24 EST 4:30 – 52.88 (56%), 53.47 (59%), 54.94 (11%)

Wednesday Jan 25 EST 10:30 – 53.03 (51%), 53.58 (54%), 55.12 (7%)

Friday Jan 27 EST 13:00 – 53.46 (14%), 53.90 (19%), 55.50 (2%) – Friday Targets are least Predictable.

Oil Intra-Day Algo Trading Quadrants:

Processing now for release soon (you are seeing the beginning of them above in charts now) – I don’t think there are any real tight crude related snipers beyond our lead trader right now anyway – but nonetheless, we are getting these out – they take a lot of data processing to say the least. We’re almost there.

Indicator Methods:

As explained above, my algorithm is a consideration of up to fifty traditional indicators at any one time – each one given its own weight in accordance to its accuracy (win rate). This is how we establish the probability of specific targets hitting (we call them alpha algo targets).

Alpha Algo Targets, Algo Trend-lines, Algo Timing, Quadrants for Intra Snipes:

Algo targets are the red circles – they correspond with important times each week in oil reporting land. Tuesday 4:30 PM, Wednesday 10:30 AM and Friday at 1:00 PM. The red dotted diagonal lines are the algo trend-lines. And the vertical dotted (red or green) are marking the important times each week. You will find that the price of crude will hit one of the alpha algo targets about 90% of the time. In the absence of market direction the machines take price to the next algo line and/or target. Understanding how the price of crude reacts to the algos and how they move price from target to target is critical for intra-day and swing trading crude oil and associated instruments.

You will notice that price action of crude will use these algo trend-lines and act as support and resistance, and that price also often violently moves when an alpha algo line is breached either upward or downward.

We cover this in much more detail in the member updates, trading room. A review of my Twitter feed and previous blog posts will help you understand the relation of these indicators. We will start posting video blogs (for my subscribers) on YouTube (in addition to my daily blog posts) for swing traders that work during regular trading hours.

Also… we will cover how to establish algo trend-lines and price targets future forward (as you have seen me do on my Twitter feed for some time now).

Conclusion:

That is a good place to leave it for now – we will review details of the above in the trading room and when time allows we will segment for our swing traders (and publish) videos of the work we do in the trading room.

See you in the live trade room! And again, if you struggle to know how to use these indicators as a trader’s edge, it is recommended (if you have earnestly reviewed all of our documentation first) that you obtain private coaching prior to trading a real account with real money – we recommend you use a paper trading account at first. And finally, we will be publishing a “how to use guide” soon, but it will be simply be a recap (consolidation) of instructions in this post, from my Twitter feed, and previously published information on our blog and website. You can also send specific questions to our email inbox at [email protected] – if you do this be sure to ask a specific question so it can be answered specifically. When the 24 hour oil trading room opens you will have ample opportunity in that 24 hour room to ask questions also.

Watch my EPIC the Oil Algo Twitter feed for intra day notices and your email in box for member only material intra day also.

EPIC the Oil Algo

Tweets by EPICtheAlgo

PS If you are not yet reviewing the daily post market trading results blog posts, please do so, they are on the blog daily and often there is information that also may assist your trading. Trade room transcripts (for example) may review topics pertinent to your trading.

Article topics: EPIC the Oil Algo, Crude Oil FX: $USOIL $WTI, $USO, $UCO, $CL_F, $UWT, $DWT, $ERX, $ERY, $GUSH, $DRIP, Chart, Algorithm, Indicators, Fibonacci, Algo

Read More
Member S&P 500 $SPY Trade Charting Fri Jan 20 $ES_F ($SPXL, $SPXS)

Member S&P 500 $SPY Trade Charting Fri Jan 20 $ES_F ($SPXL, $SPXS)

January 20, 2017October 5, 2017 FREEDOM SPYSP500 (SPY) Algorithm$ES_F, $SPXL, $SPXS, Algorithms, Chatroom, Fibonacci, Freedom $SPY Algo, Gold, SPY, Stocks, Trading, Wallstreet

S&P 500 $SPY Trade Update Friday Jan 20, 2017 $ES_F ($SPXL, $SPXS) Charting / Algorithm Observations

Good morning! My name is Freedom the $SPY Algo. Welcome to my new S&P trade report.

Notices:

Charting Below: I am going to leave in much of recent reports below because the trade in $SPY is still within a defined range and until it trends the algorithmic modeling cannot be processed in full for all your trading ranges etc. Nonetheless, below is charting to assist you intra-day until we lock in  on a trend either up or down.

Per previous;

The one bonus, if there is one while we await price movement up or down, is that our technicians have now locked in the math for the $SPY algorithm model. In other words, as soon as we get movement up or down we will be able to provide detailed modeling for members.

New Service Options: We now also offer a stand-alone trading room option vs. bundle (incl. trading room, premarket newsletter, alerts). Plans from $1.22 per day w/ promo code.

How My Algorithm Works and Availability:

I am an algorithm in development. My math is based on traditional indicators (up to fifty at any given time each weighted on individual merit) such as simple math calculations relating to price and volume, Fibonacci, simple pivots, moving averages, Gann, Schiff and other mathematical factors. I do not yet have AI or Geo integration – only math. I am not a high frequency or bot type algorithm – I am to be used (represented on a chart) as a probability indicator to give our trader’s an edge when triggering entries and exits on trades with instruments that rely on the price of the S&P500 (more specifically $SPY). Early 2017 I will also provide algo indicators and charting for $ES_F.

Below you will find my simplified view of levels that can be used on a traditional chart to advance a traders’ edge (both intra-day and as a swing trader). This work, and your subsequent trading, should be considered as one decision at a time, “if this happens then this or this are my targets”… price – trigger – trade and so on.

My algorithmic charting is going to developer coding phase early 2017 for our trader’s dashboard program. Please review my algorithm development process and a recent post by my developer that explains more about “Why Our Algorithms are Different than Most”.

$SPY Trading Observations:

Live Chart Link: https://www.tradingview.com/chart/SPY/CX2a7Oex-Freedom-SPY-Algo-Member-Charting/

Support and Resistance Lines / Fibonacci Levels and Algo Trading Quadrants Based on Algorithmic Modeling Available Until Trade Trends Upward or Down.

Below is the chart our traders have prepared based on algorithmic calculations using Fibonacci to prepare for trade on Friday. If trade gets upward or lower momentum and price reacts to these levels use the levels – if trade does not respect the Fib lines and the algo quadrants (dotted lines) in this chart abandon the chart signals until the next report is issued.

If you are trading futures / ES_F our new modeling early 2017 (February) will also include this charting – until then you would have to transpose these quadrants to the ES_F chart.

$SPY, Chart
S&P 500 $SPY Support Resistance Fib Algo Quadrant Calcs 30 Min Fri Jan 20 317 AM $ES_F ($SPXL, $SPXS) Charting – Algo Model Observations

Fib Levels Our Traders Will Watch in Event Trade Moves Downward

I know the chart becomes messy, but these are the levels our traders will trade against (in addition to the quadrants above) should price move downward. Yes, I know the use of Fib levels below is not conventional, but we use algorithmic modeling scenarios and you will find them to be very accurate.

Live Chart: https://www.tradingview.com/chart/SPY/RA0bYRSi-SPY-Simple-Levels-for-Downward-Trade/

$SPY, Chart
$SPY Simple Levels for Downward Trade

Fib Levels Our Traders Will Watch in Event Trade Moves Upward

And yes, I know it’s messy, far from conventional and looks like mad science – but check the levels with intra day trade and you will find them accurate should the trade trend upward.

Live Chart: https://www.tradingview.com/chart/SPY/Sfxrm7QK-SPY-Simple-Levels-for-Upward-Trade/

$SPY, Chart
Fib Levels Our Traders Will Watch in Event Trade Moves Upward

Building the Probabilities for Buy Sell Signals in Algorithmic Model – We Start With Simple MA’s

With our algorithmic modeling our development philosophy has been to keep it simple. One way we do this is to start with the MA’s and how they might become predictable buy and sell triggers on various time-frames – once we have reviewed them all (which I won’t include all in these posts because there are many hundreds of variations and these posts would become books) we then calculate the win rate % for each win / loss for each time frame for each MA. Simple right? It actually is – the more difficult part is actually processing the information.

Once we have the MA data processed for all time frames we then have buy / sell triggers with probabilities attached to each for our buy / sell alerts. We can then move on to other indicators such a Fibonacci and many more (all of which become part of our probability set for algorithmic targets).

Please refer to recent reports for applicable MA’s, and once again once price moves up or down we will continue this part of the work. As soon as price trends up or down we will provide a series of MA charts for reference for the trend and associated trade.

Alpha Algo Trading Lines:

Currently waiting for $SPY to trend up or down to establish.

Alpha Algo Trading Targets:

Currently waiting for $SPY to trend up or down to establish.

Intra Day Algo Trading Quadrants:

Currently waiting for $SPY to trend up or down to establish.

Time / Price Cycle Change Forecast:

Currently waiting for $SPY to trend up or down to establish.

Conclusion:

Over-all, we are bullish. This can change at any moment – but all indicators we watch are indicating higher prices. We will update as the week goes on or as signals allow for updates.

Good luck with your trades and look forward to seeing you in the room!

Freedom the $SPY Algo

Article Topics: Freedom $SPY Algo, Fibonacci, Stocks, Wallstreet, Trading, Chatroom, Gold, Algorithms, $SPY, $ES_F, $SPXL, $SPXS

Read More
Member Oil Trade Fri Jan 20 Chart Algo FX: $USOIL $WTIC – $USO $CL_F $UWT $DWT $UCO $SCO $ERX $ERY $GUSH $DRIP

Member Oil Trade Fri Jan 20 Chart Algo FX: $USOIL $WTIC – $USO $CL_F $UWT $DWT $UCO $SCO $ERX $ERY $GUSH $DRIP

January 20, 2017January 29, 2017 Epic the AlgoCrude Oil Trading Algorithm (EPIC)$CL_F, $DRIP, $ERX, $ERY, $GUSH, $UCO, $USO, $UWT, Algo, Algorithm, Chart, Crude Oil FX: $USOIL $WTI, DWT, EPIC the Oil Algo, Fibonacci, Indicators

Friday Jan 20, 2017 EPIC the Oil Algo Oil Report (Member Edition). FX: $USOIL $WTIC – $USO $CL_F $UWT $DWT $UCO $SCO $ERX $ERY $GUSH $DRIP

Welcome to my new FX: $USOIL $WTI oil trade report. My name is EPIC the Oil Algo.

NOTICES:

Big News Below Members! Time / Price Cycle has 92% chance of terminating before Tues 4:30 to upside trend! We cannot confirm this trend change until Wednesday at 10:30 AM as 100% so trade cautiously optimistic.

NEW SERVICE OPTIONS: We now also offer a stand-alone trading room option vs. bundle (incl. trading room, premarket newsletter, alerts). Plans from $1.22 per day w/promo code.

NEW SERVICE OPTIONS: EPIC the Oil Algo now has an Oil Report only option vs. bundle w/ 24 hr trading room. Plans from $4.10 per day w/promo code.

MUST READ: There is a feature blog post at this link, “Why our Stock Algorithms are Different than Most“. If you are viewing our algorithmic model charting it is a must read.

MULTI-USERS: Institutional / commercial platform now available.

PATENT PHASE: I am now in patent application phase. Stay tuned for agreements concerning disclosure and use coming to members.

24 HOUR TRADE ROOM: My charting transitions from FX $USOIL $WTI to 24hr crude oil futures early 2017. My sub service w incl 24 hr crude oil trade room.

ACCESS: My proprietary services transitioned recently from public inaugural to subscriber only access. All rates for existing members for all service prices (including price increases) will be grandfathered in perpetuity (view website products page for conditions). Early 2017 when my 24 hour futures trading room opens along with 24 hour live charting I will have a rate increase but as with recent the roll-over existing members will be grandfathered at locked-in current rates.

SOFTWARE: My algorithmic charting is going to developer coding phase early 2017 for our trader’s dashboard program. Please review my algorithm development process and about my oil algorithm story on our website www.compoundtrading.com and my oil algo charting posts on my Twitter feed and this blog.

HOW MY ALGORITHM WORKS: I am an algorithm in development. My math is based on traditional indicators (up to fifty at any given time each weighted on win ratio merit – all not shown on chart at any given time) – such as simple math calculations relating to price and volume, Fibonacci, simple pivots, moving averages, Gann, Schiff and various other charting, geometric and mathematical factors. I do not yet have AI or Geo Political integration – only math as it relates to traditional indicators with the primary goal being probabilities. I am not a high frequency or bot type algorithm – I am represented on and used on a traditional trading chart as one would normally use as a probability indicator. The goal is to provide our trader’s with an edge when triggering entries and exits on trades with instruments that rely on the price of crude oil (specifically FX: $USOIL $WTI and transitioning to futures in the new year in our new 24 hour oil trading room).

Below you will find my simplified view of levels that can be used on a traditional chart (both intra-day and as a swing trader or investor). This work, and subsequent trading, should be considered one decision at a time, “if this happens then this or this are my targets”… price – trigger – trade and so on. Questions to; [email protected], message our lead trader on Twitter, or message a lead trader privately in the trade room.

EVERY CALL WE MAKE, EVERY PUBLIC INTERACTION, REPRESENTATION OF TRADE (ON EVERY VENUE) IS VIDEO RECORDED (TRADING ROOM), ON SOCIAL MEDIA OR ON BLOG / WEBSITE TIME-STAMPED FOR PERMANENT RECORD AND ABSOLUTE TRANSPARENCY. PLEASE ALSO REFER TO OUR PUBLIC DISCLOSURE https://compoundtrading.com/disclosure-disclaimer/.

FX: $USOIL $WTI Observations:

Below is the link for the live EPIC the Oil Algo Live Trading Chart for Friday Jan 20, 2017.

https://www.tradingview.com/chart/USOIL/X3PhOXFT-EPIC-the-Oil-Algo-Member-Live-Chart-USOIL-WTI/

Intra-day Crude Oil Trading Range: At time of writing FX $USOIL $WTI is trading at 52.20 at 2:11 AM ET Jan 20, 2016. Some thoughts with respect to traditional charting that may help advance the trading edge:

As mentioned above my algorithm has calculated a 92% chance that a time/price cycle is terminating at latest Tuesday next week at 4:30 to the upside. The new algo targets are in red circles (follow red dotted alpha algo lines for targets not represented on chart). Remember that the Friday targets are not as probable as Tues and Wed each week. The purple lines and arrow pointing to one are horizontal support and resistance (that are not as important as the blue diagonal trend-lines and red dotted alpha trend-lines). Use the purple lines for intra trade reference only. More recently the yellow lines (which are significant horizontal support and resistance from other time price cycles) are not holding price action and the diagonal blue trendlines are acting as alpha. Note the blue diagonal trend-line price is currently using as support – this is critical. Our traders will be trading this as support while it holds. Also, above (off chart) there is a very significant downtrending diagonal trendline (blue) that is very thick (means it comes from previous time cycles) and it is at 56.35 intra-day but is trending down so be careful (this was previously pointed out in reports that I have left inserted in this report further down). That overhead diagonal trendline our traders will use as resistance in their trading. There are two alpha algo lines in this time price cycle and they are represented on the chart – the algo targets run along them. Target probabilities are listed below.

Epic, Oil, Algo, Chart
Crude algo intra work sheet 208 AM Jan 20 FX $USOIL $WTIC #OIL $CL_F CL $USO $UCO $SCO $UWT $DWT #OOTT

Multi Week Trading Range for Swing Trading:

Note: Be careful with the prices you see in the purple boxes on the right of the chart – they do not line up on chart for price action (they are for indicators).

Diagonal Trend Lines:

Diagonal trend-lines (blue). Diagonal trend-lines are critical inflection points. Please review many of my recent posts so you can learn about how important these diagonal trend-lines are. If one is breached you can look to pull-back to next diagonal blue trend line about 90% of the time. Also pay attention to how thick the lines are – the thicker the line the more important because they represent extensions from previous time / price cycles.

Remember you can come in to the chat room to message the trader and REMEMBER I have posted a live chart link earlier in this post so if you can’t see the lines well on this chart above you can go to the live chart link and watch for member live algo chart links through-out the day in your email inbox!

Per previous;

I am going to leave the commentary below in my reports for the short-term to show and be sure (if crude price rises) that traders are aware of the significant resistance over-head, but it also serves as a reminder (lesson) that when price is getting within significant resistance such as below that significant downdrafts in price action are likely.

The diagonal trend-line in this chart is very important. In fact, so much so that our traders will aggressively short at these trend-lines (with tight stops of course) – because this is a trend-line from another time-cycle – a significant trend-line. Keep in mind, that with charting, especially when bringing trend-lines in from many previous time-cycles such as this that it won’t be exactly on the penny – so watch close here.

There is also a symmetrical resistance and support line below it (yellow). If crude trade rises above this trend-line you can expect at least nine times out of ten a new break-out in crude oil trading price.

All recent major up-trends in crude trading (last two years) have used these diagonal trendlines lines as support (or alternatively as resistance sending crude down in a new trading trend lower). Very, very important line to watch.

56.93 is significant resistance with diagonal trend-line. Crude algo intra work sheet 758 PM Jan 2, 17 FX $USOIL $WTI #OIL $USO $UWT $DWT $CL_F #OOTT #Algo

Resistance, Oil , Chart
56.93 is significant resistance with diagonal trend-line. Crude algo intra work sheet 758 PM Jan 2, 17 FX $USOIL $WTI #OIL $USO $UWT $DWT $CL_F #OOTT #Algo

Price Action with 20, 50, 100, 200 MA

It is wise to study how the 20, 50, 100, 200 MA trade on each time-frame before trading oil related instruments (see previous posts).

Fibonacci Levels:

This chart does not represent the current fib lines but the weekend update will include them.

Watch the lines for support and resistance. Careful using them as traditional retracement levels with crude because the algo lines etc are more dominant / predictable. But the Fib lines are excellent indicators for intra-day trade support and resistance.

Horizontal Trend-Lines (purple):

Horizontal trend-lines are not as important as the other indicators reviewed above, however, they do serve as important resistance and support intra-day for tight trading and they are important if thick (in other words they come from previous time / price cycles). WE STARTED TO REPRESENT THE REALLY IMPORTANT LINES IN YELLOW FYI FOR EASE. Refer to chart for current applicable horizontal trend-lines.

Advanced Charting:

Respect support and resistance lines: If you can be patient and take your long and short positions against these yellow lines – that is your highest probability trading.

You will see a lot of noise on the charts over the next few weeks (algorithmic calculations of various types). Try and ignore for now.

Oil Time / Price Cycles:

Time / price cycles are the single most important indicator and my record calling them is near 100% – since inception seven months ago. The reason they are so important is that a trader does not want to be holding a crude oil instrument at termination of a time cycle if not absolutely sure if price will go up or down. A trade may choose to enter a large position in advance of a time price cycle termination IF THERE IS A HIGH PROBABILITY OF A DIRECTION IN PRICE and if the market is trading at a really important pivot area. In other words, if the market is trading at the bottom of the upward trending channel at a support (yellow lines) and we knew there was a significant probability of a time cycle about to terminate a trader may enter with a long position. The price really spikes or drops significantly when these important time cycles terminate.

The problem with time / price cycle terminations is they change from minute to minute (depending on where price is on the chart) so you have to be in the trade room to get the alert. Our lead traders will do everything they can in future to send these on SMS but we have to be careful because it can be difficult with so much going on in the room. The reason they (time cycles) change is because they are actually represented by or are geometric shapes in the chart – I know it sounds odd but I have (as I mentioned) hit these calls just shy of 100%. The oil political people know the same algorithmic modeling principles and they ALWAYS TIME THEIR BIG ANNOUNCEMENTS AROUND THE TIME PRICE CYCLE TERMINATIONS.

So if you can picture a triangle on the chart – and price is trading in the triangle – and price is going to come to the edge of the triangle and there is a significant support or resistance or an algo line terminating there too or a target (those type of indications)… then we know there is a high probability of a time and price change. In other words, it is where there are clusters of algorithm points that cross and when price is going to cross over that cluster is where they are. And these are represented on all the different time frames – the larger the time frame – the larger the time price cycle termination – the larger the spike or downdraft. This is where we establish our intra-day quadrants from for sniping trades (which we will put in to the room soon because it looks like the geo political rhetoric is over for a while making them more predictable). Difficult to explain in short. So we will do our best to SMS alert these in future.

Also, the real large or important time / price cycle terminations we know far in advance and they can be put in these newsletters.

If you review my Epic the Oil Algo Twitter feed, my blog posts and my story on our website you will get a feel for how accurate these calls are.

Alpha Algo Trading Trend-Lines (Red dotted lines):

To determine which algo line is most alpha (or probable) intra day, it is the nearest line to price action. This can also help you determine the trend of trade. If the algo line is trending up the price will follow it up until price is tested at an algorithm indicator (the main tests are diagonal trendlines, horizontal trendlines, time / price cycles etc – as I have shared with you). This is why it is important to watch all the lines because they are all support and resistance. To keep it simple trade the range (yellow lines) as I’ve mentioned but keep an eye on these indicators.

Current Alpha Algo Targets (Red circles):

Your closest target that crude is trending toward is always the most probable. Crude is currently trending toward a target (red circles on chart) Then, your second most probable is the one that is up or down trend depending on whether general price is in an upward or downtrend for the most recent week or so and what your other indicators look like (such as the MA’s I explained above).

The other way to determine which targets are in play is actually quite simple, you will notice that crude trades between the channel lines up and down and up and down and there are various support and resistance along the way. If it hits a target at the top of the channel you can bet most times (unless the next day like today) that the next target hit will be at the bottom of the channel.

Wait for the price to trend toward a target and take your position and watch as price gets closer and closer to the target. Remember, that the machines trade from decision to decision – or in other words from support to next resistance or resistance to next support or when the times come each week on Tuesday Wednesday and Friday they will trend toward the target that market price action determines they go to.

Our lead trader will explain more in the room and do not hesitate to ask our lead trader in the room by private message or on twitter to explain intra day decisions.

Current Algo Targets Should Time / Price Cycle Change Confirm:

Friday Jan 20 EST 13:00 – 52.43 (53%)

Tuesday Jan 24 EST 4:30 – 52.88 (47%), 54.94 (11%)

Wednesday Jan 25 EST 10:30 – 53.03 (31%), 55.12 (7%)

Friday Jan 27 EST 13:00 – 53.46 (14%), 55.50 (2%)

Oil Intra-Day Algo Trading Quadrants:

These will be included in Monday report with Fib levels.

Processing now for release soon (you are seeing the beginning of them above in charts now) – I don’t think there are any real tight crude related snipers beyond our lead trader right now anyway – but nonetheless, we are getting these out – they take a lot of data processing to say the least. We’re almost there.

Indicator Methods:

As explained above, my algorithm is a consideration of up to fifty traditional indicators at any one time – each one given its own weight in accordance to its accuracy (win rate). This is how we establish the probability of specific targets hitting (we call them alpha algo targets).

Alpha Algo Targets, Algo Trend-lines, Algo Timing, Quadrants for Intra Snipes:

Algo targets are the red circles – they correspond with important times each week in oil reporting land. Tuesday 4:30 PM, Wednesday 10:30 AM and Friday at 1:00 PM. The red dotted diagonal lines are the algo trend-lines. And the vertical dotted (red or green) are marking the important times each week. You will find that the price of crude will hit one of the alpha algo targets about 90% of the time. In the absence of market direction the machines take price to the next algo line and/or target. Understanding how the price of crude reacts to the algos and how they move price from target to target is critical for intra-day and swing trading crude oil and associated instruments.

You will notice that price action of crude will use these algo trend-lines and act as support and resistance, and that price also often violently moves when an alpha algo line is breached either upward or downward.

We cover this in much more detail in the member updates, trading room. A review of my Twitter feed and previous blog posts will help you understand the relation of these indicators. We will start posting video blogs (for my subscribers) on YouTube (in addition to my daily blog posts) for swing traders that work during regular trading hours.

Also… we will cover how to establish algo trend-lines and price targets future forward (as you have seen me do on my Twitter feed for some time now).

Conclusion:

That is a good place to leave it for now – we will review details of the above in the trading room and when time allows we will segment for our swing traders (and publish) videos of the work we do in the trading room.

See you in the live trade room! And again, if you struggle to know how to use these indicators as a trader’s edge, it is recommended (if you have earnestly reviewed all of our documentation first) that you obtain private coaching prior to trading a real account with real money – we recommend you use a paper trading account at first. And finally, we will be publishing a “how to use guide” soon, but it will be simply be a recap (consolidation) of instructions in this post, from my Twitter feed, and previously published information on our blog and website. You can also send specific questions to our email inbox at [email protected] – if you do this be sure to ask a specific question so it can be answered specifically. When the 24 hour oil trading room opens you will have ample opportunity in that 24 hour room to ask questions also.

Watch my EPIC the Oil Algo Twitter feed for intra day notices and your email in box for member only material intra day also.

EPIC the Oil Algo

Tweets by EPICtheAlgo

PS If you are not yet reviewing the daily post market trading results blog posts, please do so, they are on the blog daily and often there is information that also may assist your trading. Trade room transcripts (for example) may review topics pertinent to your trading.

Article topics: EPIC the Oil Algo, Crude Oil FX: $USOIL $WTI, $USO, $UCO, $CL_F, $UWT, $DWT, $ERX, $ERY, $GUSH, $DRIP, Chart, Algorithm, Indicators, Fibonacci, Algo

Read More

Posts navigation

Older posts
Newer posts
Proudly powered by WordPress | Theme: sharksdesign by reviewexchanger.
 

Loading Comments...