S&P 500 $SPY Trade Update Thursday May 18, 2017 $ES_F ($SPXL, $SPXS) Algorithmic Charting Observations
Good morning! My name is Freedom the $SPY Algo. Welcome to my new S&P trade report for Compound Trading.
Because trade came off so aggressively on Wednesday, we are going to set over any algorithmic modeling until Thurs night because anomolies are not friendly to charting models. So below are some items to watch for in Thursday trade on conventional charting and below that is an updated quadrant and Fib retracement chart.
This delay won’t put the release of the full model publication planned for Monday back at all – it will be released this Monday.
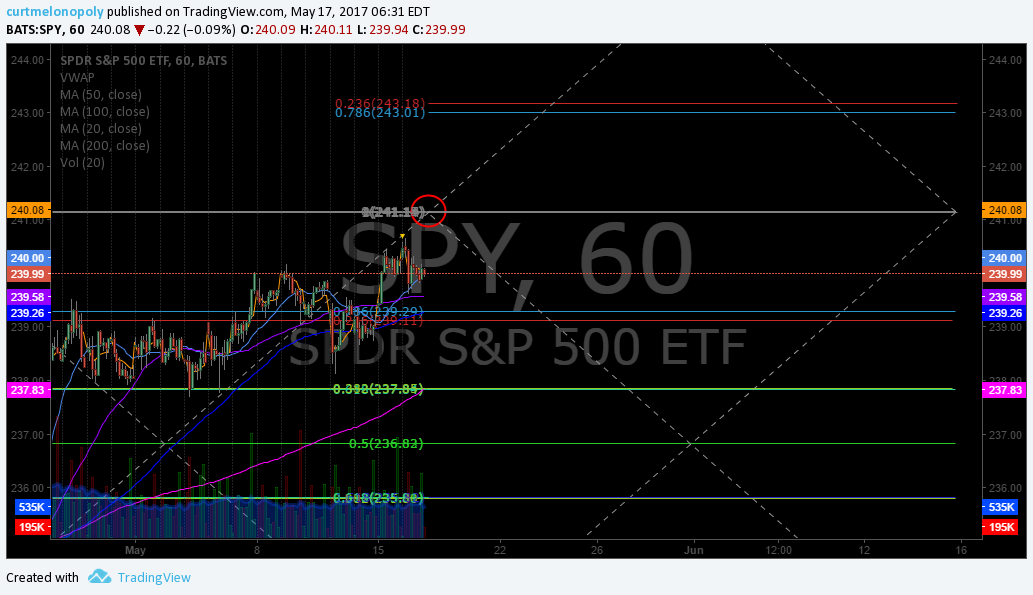
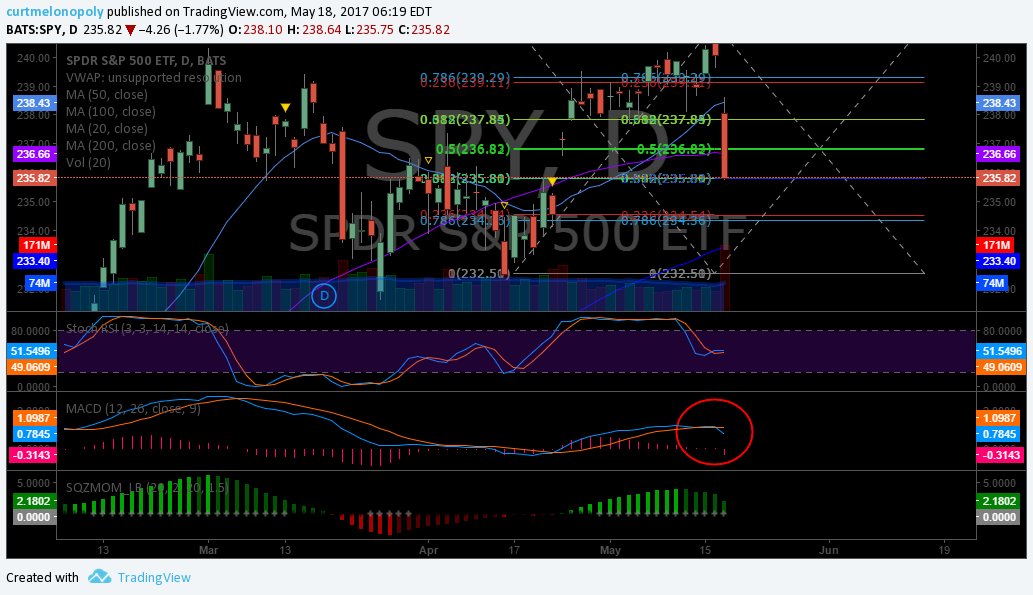
Trade respecting Fibs perfect. Two possible support levels with arrows. S&P 500 $SPY May 18 613 AM $ES_F $SPXL, $SPXS

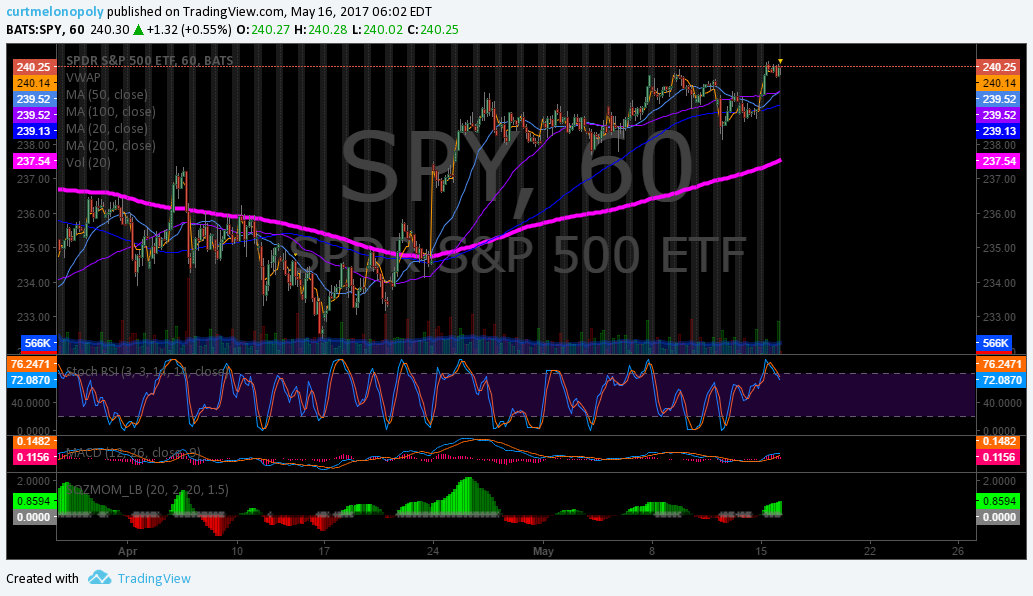
Trade working its way through Fibs. S&P 500 $SPY May 18 604 AM $ES_F $SPXL, $SPXS


Recent Posting
Fibonacci Charting
Yesterday, we produced the first step in the new charting model that will be complete by Monday. If you missed the report yesterday please read it here first: Freedom S&P 500 $SPY (Complete Algorithm Charting Process Commences) Tues May 16 $ES_F $SPXL, $SPXS
With algorithmic modeling and associated trading, we first “root” our trading in simple charts (as with the report yesterday) and then we move on to Fibonacci related work. Much of what we do with Fib work is conventional, but some you will find is outside convention.
Below is the first 60 minute time frame trading quadrant set in to the chart. The diagonal dotted lines will act as intra-day support and resistance when trading interacts. The red circle is the technical time and price target – but it is only a target – price will often fail the target – but more often than not trend toward it. The upper resistance decision on this chart is in the 241.33 – .50 range as with previous price extension pricing.
These “quadrants” can be used on various time frames and will be invaluable when you learn how to use them for trade on different time frames.
Also the horizontal Fib lines naturally act as support and resistance.
Our oil algo uses these quadrants primarily on the 30 minute chart.
So in the next report we will start to add in these quadrants on shorter time frames and build out the quadrant map so to speak. Then the next report after that we will work with various price extensions, algo targets, intra-day trading quadrants and time / price cycles.
If you review an EPIC the OIL chart you will see these quadrants in action.
For now, I am going to leave it here.
I have left recent report notes and charts below also for context.
First 60 min time frame quadrants set in chart with diagonal support and resistance. S&P 500 $SPY May 17 532 AM $ES_F $SPXL, $SPXS

Per Previous Reporting (for context)
New Charting
Well, it has been a long road, but we have finally confidently locked in the algorithmic model charting for $SPY. an exciting day for us in the lab.
Trading Range Extensions (wide time-frame price targets – the main turns). In short, we have been publishing price predicts for the main price extensions on $SPY trade and for about four months now we have been hitting them. The price extension price targets are the most important. If you can catch the main turns in trade then this of course is where the money is. So that was the primary priority and it has proven out. Reviewing historical reports this is represented by the red dotted line extensions and was also in writing (the price predicts of trading extensions).
Trading Quadrants (shorter time frame trading ranges). The second priority was to lock in the natural trading range on shorter time frames, we call these quadrants and they have been represented on the charts as geometric shapes (boxes, or as some refer to them as diamonds). These also have proven out.
Trading Time Cycles / Main Resistance Areas (clusters of resistance). You would have to go back in the historical reporting some time to confirm that our algorithm has actually called these consistently, but it has. The more recent is the area $SPY is struggling to breach right now and the significant one prior to Christmas last year. The purpose of knowing where the primary time cycle resistance areas (or clusters) are, is for traders to know where and when it is bets to let off the gas to speak.
Specific Time / Price Targets. This area of work in the algorithm we are still working with (in development) and as such you will know begin to see our best guess of specific time / price targets weekly. You would have to review EPIC the Oil Algo posts or Twitter feed to understand what I am referring to (they are represented on EPIC’s feed as red circles and EPIC has been undeniably accurate). Now, IT IS CRITICAL to know that we may never be able to lock in these “cyrstal ball” specific time and price targets with $SPY like we have with EPIC. But that doesn’t make the work we are doing ineffective, actually quite the opposite.
If you have been a member for a while you will have known the basics of the process, if not, you may want to review at least the last ten or so posts (if you do not have the passwords you can request from Sartaj by email at info@compoundtrading.com). It isn’t required to review the historical of course, just something that is available to you.
So what does this mean going forward?
Going forward we will be representing the work we do over the next three or four days in a build-out (a release process) of the most basic simple charting to most extensive algorithmic model charting we have now (based on the model completed) – representing the points / signals I explained above.
This is exactly the same process that EPIC the Oil Algo undertook when we were preparing / training our traders to use the model. This is the process for us to train our traders with $SPY also and so you will also be the recipients of that process over the next few days.
So in short, your report today will start with the most basic charting and over the next few days completing at latest Monday you will have the full model of charting and it will be very similar to EPIC the Oil Algorithm’s charting.
If over the next few days you have any questions (or going forward of course), please let us know by Twitter DM or email info@compoundtradig.com. And also quick, with the new model building out you will of course see the monthly subscription rate rise over time (appropriate to work involved for maintenance of model charting) but existing members are grandfathered without increase if subscription does not lapse).
Reporting Rotation, Futures, $ES_F, $VIX, 24 Hour Trading Room
The next steps (after the full model is published prior to Monday) are as follows’
- The rotations for $SPY newsletters will increase to multiple times per week (updating the model).
- The $VIX newsletter will be updated, published, and the reporting rotations will also increase although not to the same frequency and not to the same model build-out level as Oil or SPY. It is still in early development.
- New charting will be release in 2017 representing future / $ES_F and as with Oil there will be a 24 hour trading room. Do not expect this until later in 2017.
So Let’s Start the Process of the Chart Build-Out
This process will take three or four days of reporting. It will start with the most basic conventional charting for our traders to be “grounded in” and will culminate in the full model. Even when the full model is published, our reporting will still often include as part of the reporting the basic charting for our trader’s reference.
So bear with us for just a few days here…
Today we are going to publish the simple charts, next day the Fibonacci based charts and then the next two days roll-out the algorithmic model charting with signals on charts as explained above.
Live Charts
When we provide a link to a live chart and the chart viewer opens (after you click on link) you can click the share button in the bottom right corner (beside the thumbs up symbol) and then click “make it mine”.
Simple Charts
15 Min. Price above with 100 MA to breach 200 MA. SQZMOM red but trend up, MACD trend down but curl up, Stoch RSI down but curl up. S&P 500 $SPY May 16 706 AM $ES_F $SPXL, $SPXS
Watch that 100 MA for a breach thru 200 MA. Could be the pop it needs.

Hourly. Indecision. 20 MA breached 50 MA. SQZMOM trending up, MACD mid range turned up, Stoch RSI trend down. Price extended above MA’s. S&P 500 $SPY Trade Charting May 16 556 AM $ES_F $SPXL, $SPXS
The Stoch RSI on the hourly is indicating downward price pressure but the 20 MA breaching the 50 MA is bullish. The SQZMOM is bullish on the hourly as is the MACD.

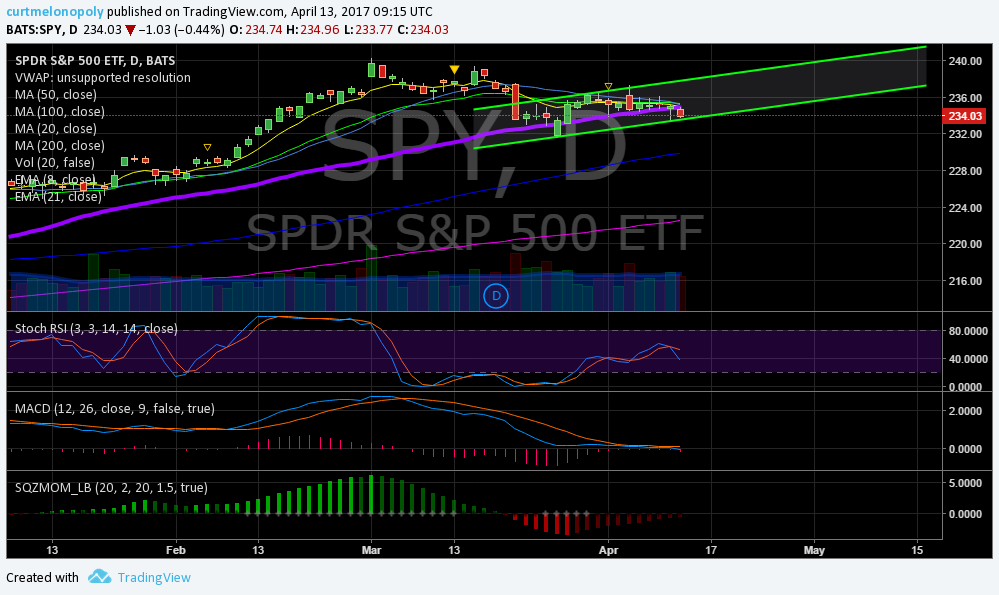
Daily. Indecision. 20 MA breached 50 MA. SQZMOM trend down green, MACD mid range pinch, Stoch RSI trend down. Price extended above MA’s. S&P 500 $SPY Trade Charting May 16 603 AM $ES_F $SPXL, $SPXS
Live chart: https://www.tradingview.com/chart/SPY/BKemGzVf-Daily-Indecision-20-MA-breached-50-MA-SQZMOM-trend-down-gree/
As with above, the indicators are indecisive on daily. Most important consideration would be the Stoch RSI trending down.

Weekly. Indecision. Price ext well above 200 MA. SQZMOM trend down, MACD high range pinch, Stoch RSI trend up. Price ext above MA’s. S&P 500 $SPY Trade Chart May 16 605 AM $ES_F $SPXL, $SPXS.
Live Chart: https://www.tradingview.com/chart/SPY/2jPsid8T-Weekly-Indecision-Price-extended-well-above-200-MA-SQZMOM-tr/
Weekly chart shows a Stoch RSI trending up, which is bullish but advantage bears is price way over extended over 200 MA and SQMOM trending down and MACD pinch. And don’t forget the resistance cluster above – it isn’t an absolute wall, but price action was challenged last time it attempted to breach it and price did come off to 20 MA.

Most Recent (Old Version) Charting and Text in Old Reports for Easy Reference of New Members (for context)
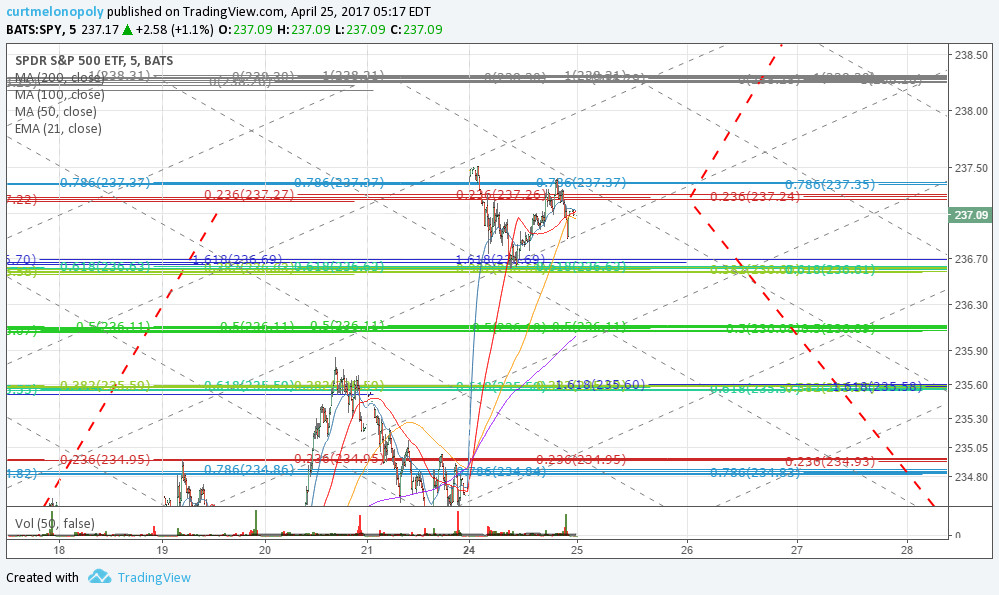
Price as we predicted has been in a rest mode since most recent upside price target predicted was hit. Price is trading at or near the mid range pivot (dark grey horizontal line).
Live $SPY Chart representing current extensions:
https://www.tradingview.com/chart/SPY/PmozIbII-SPY-Worksheet/

Notes with respect to $SPY Price Extensions and Targets
Recent Trade – $SPY price action has been hitting our upside price extension targets for months now. The chart above includes the price extension targets for upward and downward trade.
Trading just the price extension targets we have provided on the upside and downside has proven a very profitable signal.
Also of importance, in addition to trading the price extensions, our traders have found the Fib resistance and support on the chart and the algorithmic quadrants excellent signals intra-day for support and resistance.
Fibonacci – The Fibonacci levels have been predictable so we are leaving them as they are.
Trading Quadrants – The trading quadrants have become predictable – we are leaving them as they are.
Symmetry Extension Targets – The extension price targets we have published the last number of months now have hit the price targets to upside and downside near perfect so they are becoming very predictable! Trade the outside ranges for optimum return and predictability.
Most probable downside price target if trade is in a downtrend is in 233.33 area before a decision.
Most probable upside price target if trade is in an uptrend is in 241.50 area before a decision.
Time / Price Cycles – There are currently no significant cycles in the charting.
Trading Bias – Although the warning below is still in place, our traders do have considerable high expectations that previous highs will be tested and / or taken out soon. Unless of course a geo political situation arises to derail the market.
Warning per recent reports;
This is a considerable warning because price has not traded above previous high since we alerted members to this divergence in the algorithm: Current bias is to the upside target, however, there is a divergence in the upward trade extension makes the target a double topped target, which is divergent from recent trade, which does cause us to pause.
Good luck with your trades and look forward to seeing you in the room!
Freedom the $SPY Algo
Article Topics: Freedom, $SPY, Algo, Fibonacci, Stocks, Trading, Chatroom, Algorithms, $SPY, $ES_F, $SPXL, $SPXS