Compound Trading Chat Room Stock Trading Plan and Watch List for Tuesday August 15, 2017 $EXTR, $SNAP, $BITCF, $BTCS, $BTSC, $OMVS, $AMMJ, $BTCUSD, $WTI, $GOLD – Gold $GLD, Gold Miners $GDX, Silver $SLV, Oil $USOIL $WTI, US Dollar Index $USD/JPY $DXY, S&P 500 $SPY, Volatility $VIX… more.
Welcome to the morning Wall Street trading day session at Compound Trading!
Notices:
Notes in red text below are new comments entered specifically today.
Today’s Live Trading Room Link:
http://compoundtrading1.clickmeeting.com/livetrading
Live Alerts for Oil, Gold, Swing Trading and Day Trading are now available only on either email and/or by following alert Twitter feed. If you did not get an email send an email to info@compoundtrading.com and ask Sartaj to get you info. Most of those I spoke to are opting for email only, but the Twitter alert system is available for those that want it.
Disclaimer / disclosure: Every subscriber must read this disclaimer.
Private Fund / Personal Trading Going Forward:
I am now also trading for our private fund which will bring some slight changes.
The financing or our business build-out was planned to occur by way of either retail memberships, institutional memberships or private fund trading. The retail market is still early and slow on the uptake of the requirement toward #IA intelligent assisted trade (within six years our estimation is that most retails traders will all need it, but until then we’re not waiting and we’ll just be ready on the other side of that awareness curve). The institutional membership growth has been very strong and to be sure we meet our growth trajectory goals (development completion timeline targets for launch of digital “intelligent assistance” #AI algorithm models) we are engaging the implementation of our private fund.
A few things of consideration:
- Following my trades is never condoned. Trade alerts are for the purpose of alerting awareness to something important occurring so that a member can form a thesis of trade and they are also for the purpose of learning when I win and win I fail. This (following trades) will be more difficult going forward because my frequency of trade will considerably increase.
- Trade Alerts. The trade alerts (swing and day) are not guaranteed at any time (in and/or out) however, it is important to note that with a much higher frequency of trade I will be alerting only those trades I expect to last a few hours or longer. If you ask me for targets or thesis type questions on the alert feeds or otherwise it is unlikely you will receive a response. Trade review videos will be posted for that purpose as required.
- Type of Trades. I will be trading the algorithm models (the six we have), day trading and swing trading for the fund.
- Trade Sizing. When I alert to the trading room or on a feed I will be alerting the size only specific to the membership base trading. In other words, the size of trade for our private fund will not be disclosed.
- ROI Objective. I will be trading under the goal / target of returning 100% per month (which is near impossible, especially for the 24 month period I will be trading). 50% would be very good and 25% is my minimum goal. So at minimum I am looking for 25% ROI per month compounded over 24 months. The fund size will not be disclosed.
- Term of Project. The term is 24 months (as mentioned above). It is a personal & stakeholder legacy fund / goal retirement project. Others I train as we progress will continue the legacy fund thereafter (as will they continue with our trading services at large).
- Trading Platform on Screen. You will see at times (when I am trading my small daytrading account) my actual IB trading platform on the screen. When I trade my accounts (any of them) they are connected to various other private fund accounts (at different percentages etc).
- Sizing Considerations. Because I am also trading for the private fund, there will be trades I cannot take that I may otherwise take because the fund trade size will make it difficult for me to chip in and out of and other related liquidity issues.
Reporting and Next Gen Algorithms:
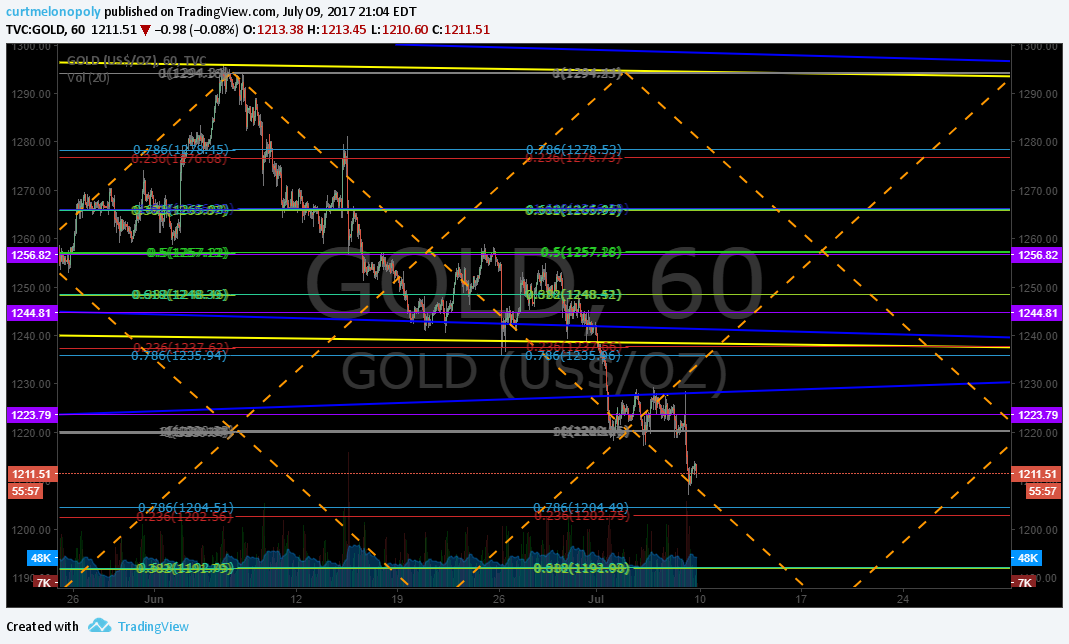
EPIC Oil $USOIL $WTI algorithm is now considered complete and ready for coding phase, Rosie Gold $GLD $GDX algorithm model is complete Gen 3 and has entered Generation 4 modeling (that is EPIC the Oil Algo level), $SPY and $DXY Generation 2 models to be released soon. $VIX Gen 1 to be re-continued within 48 hours. $Bitcoin $BTCUSD #crypto to be released Sept 1.
New GOLD alerts Twitter feed is @GoldAlerts_CT.
New Crypto alert Twitter feed, regular public Crypto Twitter feed and Crypto trading room on-deck.
Post market catch up posts still on to do list (we have about thirty from last quarter to post for transparency). Hopefully going forward now that we aren’t releasing any new algorithm models etc I’ll be able to get the rhythm of reporting cycle fluent / regular. It was the development / math etc of the models that took most of the energy so it should be good going forward. Between now and Christmas we’re just locking in what we have tighter and tighter so it sounds like a good plan:)
$SPY, $DXY, $VIX models are on deck for member updates Tues night FYI.
Master Class Charting Series Webinars:
This week Master Classes are Wed, Thur, Fri – my daughter is landing today at 1 PM. I thought it was yesterday but we had a mix up.
Master Class 2:00 PM every Tues, Wed, Thur, Fri from 2 PM to 3:30 PM until complete. All members receive a copy in their email inbox as we progress. Full series will be posted to website at a cost of 2999.99. Early adopter members receives it free.
If you are a member that has received the video series and you ask me questions in the trading room, on DM, email etc that has the answer contained in the Master Class Series I will defer you to the training videos going forward:) That actually goes for any of the published reporting FYI.
Connect with me on Discord.
https://twitter.com/CompoundTrading/status/880670140454637569
Recent lead trader blog / video / social posts:
Master Class Video 10 has been sent to member email inboxes. It is published “unlisted” so please respect that.
How to Use EPIC Oil Algorithm: $USOIL, $WTI, $CL_F, $USO, $UCO, $SCO, $UWT, $DWT, #OIL, #OOTT: http://youtu.be/hawVV31G9bg?a via @YouTube
https://twitter.com/CompoundTrading/status/889148655785177088
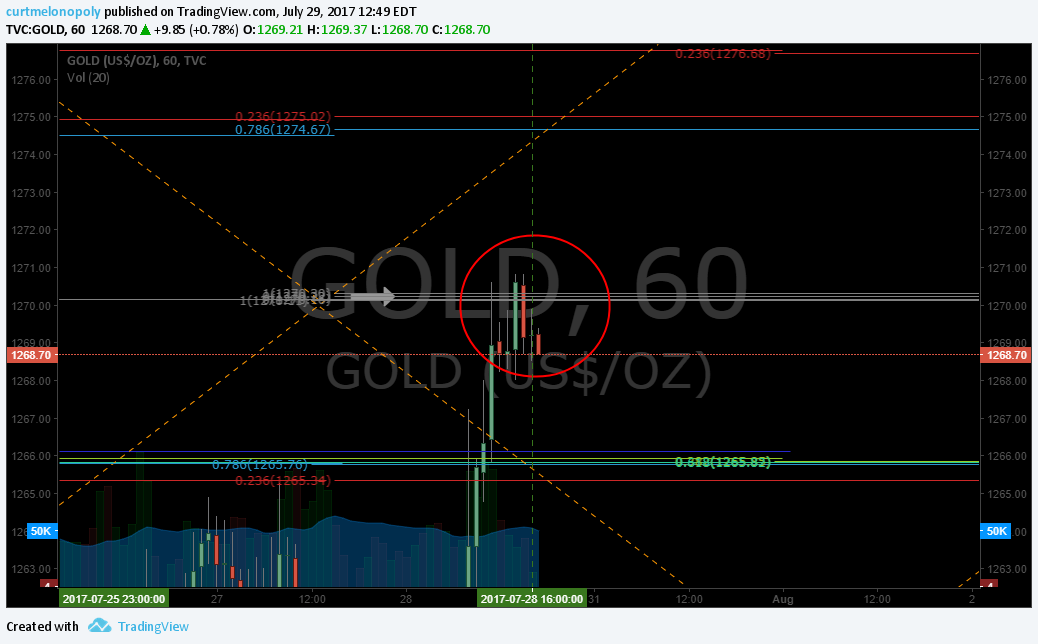
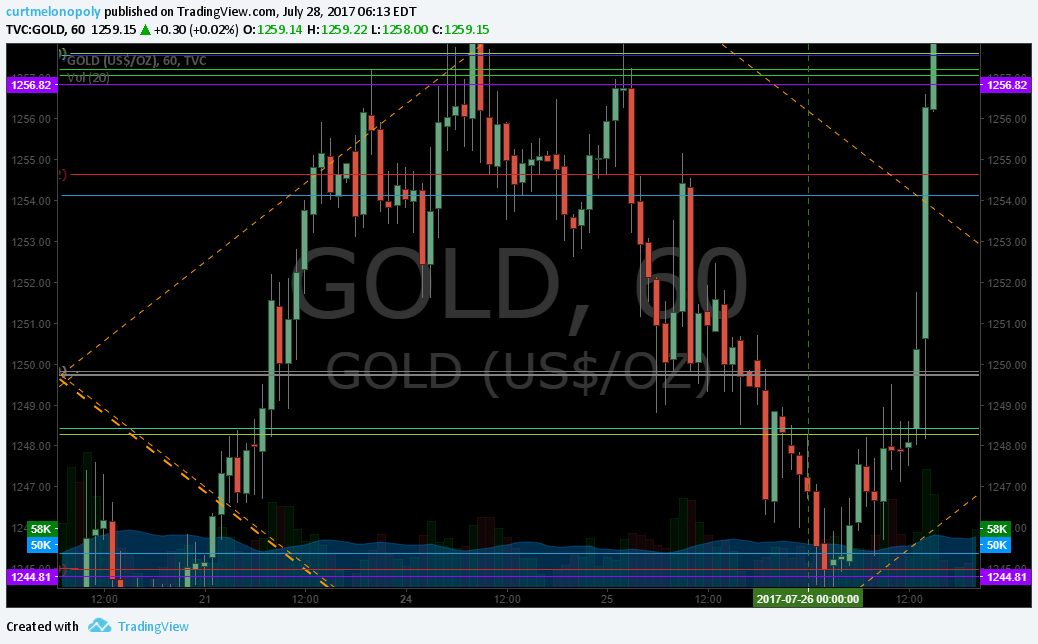
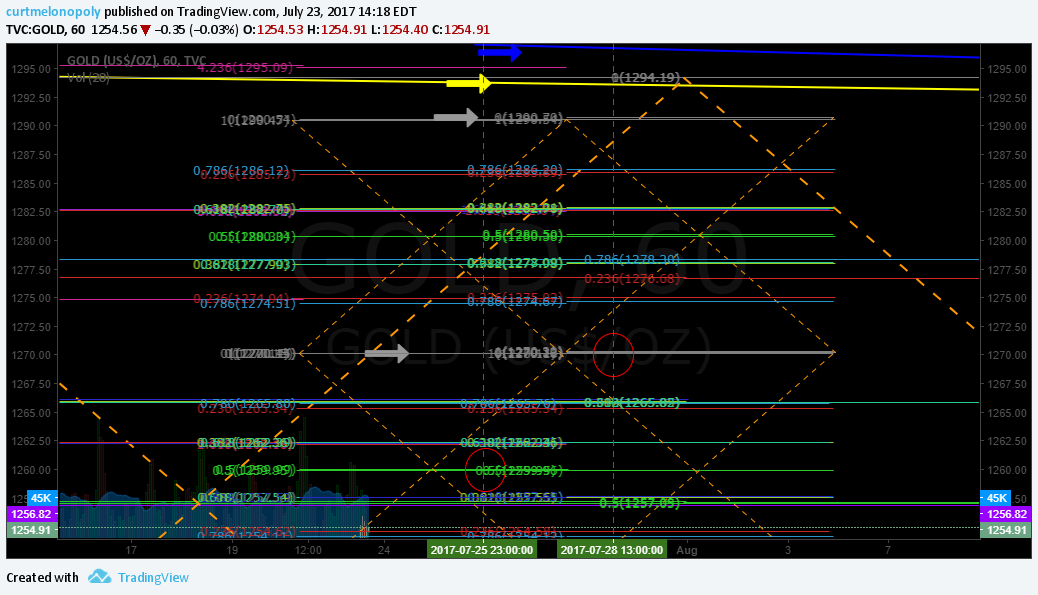
How to Use ROSIE Gold Algorithm: #GOLD, $GLD, $XAUUSD, $GDX, $GDXJ, $NUGT, $DUST, $JNUG, $JDST
https://twitter.com/CompoundTrading/status/889147527278333952
Recent Mid Day Chart / Trade Set-Ups:
Aug 11 Trade Set Ups $SPY, $BTCS, $BTSC, $BITCF, $CALA, $ERGX, $USOIL, $SGMO, $TWLO, $AAOI
Aug 9 Trade Set Ups $BOFI, $ACHN, $AMMJ, $USOIL, $WTI, $GLD, #GOLD, $XIV, $CBLI …
Aug 8 Mid Day Trade Set-Ups $TWLO, $USOIL, #GOLD, $VRAY, $KORS, $OMVS, $BSTG, $XXII, $ESPR…
Q2 2017 Swing Trading Results are available here: P/L Realized Gains: $99,452.00 Percentage Portfolio Gain 105.74% (~35% per month)
https://twitter.com/CompoundTrading/status/896897288798392320
Trading Plan (Buy, Hold, Sell) and Watch Lists.
Morning Momentum Stocks on Watch:
Market observation / on watch: Oil $USOIL $WTI under pressure, $DXY US Dollar at support, Gold / Silver pressure. $SPY looking better and held important model support yesterday, $BTCUSD lots of momentum and $VIX pressure – there is a general time / price cycle terminating early to mid Sept (Sept 9)… so I am watching closer as summer rolls on.
OTC on watch: $OMVS, $BSTG, $AMMJ, $HEMP, $BITCF, $BTCS, $BTSC, $GAHC
Recent SEC Filings to Watch:
Some Earnings On Deck: $A $FENG $JKHY $URBN $VIAV
Recent / Current Holds, Open and Closed Trades: $XIV from last week I closed in premarket for small gain, still holding some position from previous, $UGLD (closed in premarket July 31 small gain), $FEYE (closed for nice gain), $SRG (closed for nice gain), $NFLX (closed for huge gain), $IPXL (closed for gain), $AKCA (closed nice gain), $MCRB (closed small gain), $WMT (closed excellent gains), $UUP (closed small loss), $BWA (closed tiny loss), Holding: $XIV and new entry $AMMJ. All other holds are small size (less than 4% of day trading account on total) holds in this order according to sizing: $ONTX, $SSH, $LGCY, $TRCH, $ESEA, $LIGA (all not including select swing trading or algorithm charting trades).
Recent Chart Set-ups on Watch: See mid day charting trade set-up reviews on You Tube (member only on email also FYI).
We are working on these (if listed) and others in Mid Day Review in trading room. If you can’t be in there you can catch the review on the raw video feed we post to You Tube of each trading day. Many of the mid day reviews are published “private” for members only so be sure to watch your email inbox for these among other member only videos.
Market Outlook:
Market has been repairing early week so we shall see. I’m moderately bullish.
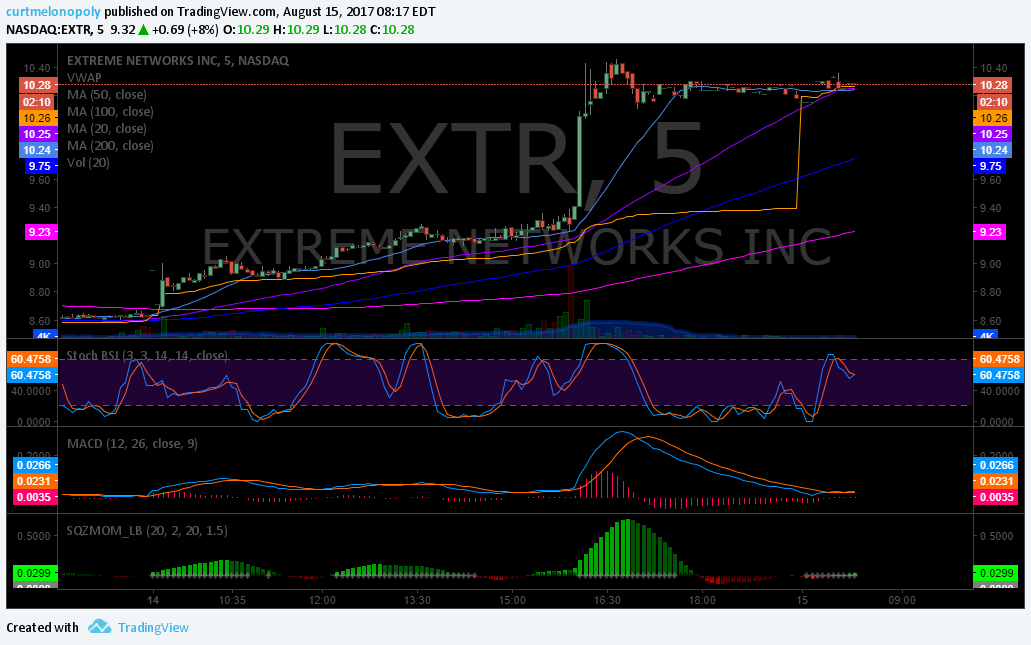
Early movers: $EXTR
$EXTR premarket up 10.3% Daily looks good for an MA bounce off the trend. #earnings #tradingprocess
https://www.tradingview.com/chart/EXTR/0FJsR7yR-EXTR-premarket-up-10-3-Daily-looks-good-for-an-MA-bounce-off-t/

Market News and Social Bits From Around the Internet:
8:30am
-Retail Sales
-Empire State Mfg Survey
-Import/Export Prices
8:55am
Chain Store Sales
10am
-Biz Inventories
-Housing Market Index
$SNAP Cantor Fitzgerald Upgrades Snap to Overweight.
If you are new to our trading service you should review recent blog posts, the Compound Trading YouTube Channel and at minimum our algorithm Twitter feeds because they do tell a story in terms of the market and how the inflections of the market determine our day to day trading. You will notice the algorithmic modelling has been undeniably accurate with many time-frames (intra-day, weeks and months out) so I myself have learned to respect their math (they have taken me from a 60% hit rate to 80%+ in my trading – all publicly posted live trades).
Momentum Stocks (Market Open and Intra-Day):
I do trade morning momo stocks, but I do avoid risk – so often I avoid the first 30 minutes (gap and go) and trade momentum stocks later in the day after the wash-out looking for a snap-back. Just prior to open and shortly after open I post momentum stocks to the trade chat room (and Twitter and Stocktwits if I have time).
Some of my Favorite Intra-day Trading Set-Ups:
(1) Momentum Stock Wash-Outs for Snap Back, (2) Bad News Wash-outs on Stocks with High Institutional Ownership, (3) Getting on the Right Side of a Trend Change and scaling in my position and (4) Our Algorithm Set-Ups.
The momentum stocks (from previous days and morning trade) I continue to watch through the day for indicators that allow a trade.
Morning Stock Watch-Lists for my Favorite Set-Ups:
(1) Pre-Market Gainers Watch-List: $EXTR 10%, $FRSX 10%, $ARLZ 7%, $AVEO $SYF $JEQ $GPRO $DRYS $DUST $SNAP $AMD $JDST $XIV $DGAZ $SVXY $CHK $TEVA $MU I will update before market open or refer to chat room notices.
(2) Pre-market Decliners Watch-List : $YY $OMER $DKS $G $GLW $ETP $COH $AAP I will update before market open or refer to chat room notices.
(3) Other Watch-List:
(4) Regular Algo Charting Watch-List: Gold $GC_F $GLD, Miners $GDX ($NUGT, $DUST, $JDST, $JNUG), Silver $SLV $SI_F ($USLV, $DSLV), Crude Oil FX: $USOIL $WTI ($UWTI, $DWTI, $USO, $UCO, $CL_F, $UWT, $DWT), Natural Gas $NG_F ($UGAZ, $DGAZ), S & P 500 $SPY $ES_F ($SPXL, $SPXS), US Dollar Index $DXY ($UUP), Volatility $VIX ($TVIX, $UVXY, $XIV)
(5) Recent Upgrades: as time allows I will update before market open or refer to chat room notices.
(6) Recent Downgrades: as time allows I will update before market open or refer to chat room notices.
Stay tuned in Stock Chat Room for more pre-market stocks on watch.
Study:
For new readers, a review of our unlocked posts on our blog would help you get in to the story we are following with the securities listed in this newsletter.
Free scanners to find momentum stocks that you can easily review charts of for indicators that bring probability of your trade being successful up considerably. These are not useful for first 30 minute market open gap and go type plays (you need a good momentum scanner, level 2, and best to have hot-keys for the first 30 mins of gap and go trading)… but are very useful for intra day scalping and swing trading (start with trending stocks and then look at indicators intra for simple set-ups – study scan study scan study scan).
http://finviz.com/
https://finance.yahoo.com/screener/predefined/ec5bebb9-b7b2-4474-9e5c-3e258b61cbe6
http://www.highshortinterest.com/
http://www.gurufocus.com/short-stocks.php
http://www.3xetf.com/all/
http://www.etf.com/channels/gold-etfs
GL!
Curtis
Algorithm Twitter feeds can be found here: $WTI (@EPICtheAlgo), $VIX (@VexatiousVIX), $SPY (@FREEDOMtheAlgo), $GLD (@ROSIEtheAlgo), $SLV (@SuperNovaAlgo), $DXY (@DXYUSD_Index). Our Swing Trading Twitter feed is found here: https://twitter.com/swingtrading_ct. Our lead trader Twitter feed is here @curtmelonopoly and lead tech developer @hundalSHS.
Article Topics: $EXTR, $SNAP, $BITCF, $BTCS, $BTSC, $OMVS, $AMMJ, $BTCUSD, $WTI, $GOLD – $USOIL, $WTI, $GLD, $GDX, $SPY, $DXY – $NUGT, $DUST, $USLV, $DSLV, $UWT, $DWT, $JNUG, $JDST, Premarket, Watchlist, Stocks, Trading, Plan, $GLD, $GOLD, $SILVER, $USD/JPY, $USOIL, $WTI, $VIX, $SPY