Skip to content

Compound Trading Group

  • About
  • White Paper
  • Returns
  • News
    • NOTICE of Online Information Meetings
  • Order
    • Terms
  • About
  • White Paper
  • Returns
  • News
    • NOTICE of Online Information Meetings
  • Order
    • Terms

Tag Archives: $UWT

  1.   »  
  2. Tag Archives: $UWT

Tag: $UWT

Member Oil Trade Tues Jan 24 Chart Algo FX: $USOIL $WTIC – $USO $CL_F $UWT $DWT $UCO $SCO $ERX $ERY $GUSH $DRIP

Member Oil Trade Tues Jan 24 Chart Algo FX: $USOIL $WTIC – $USO $CL_F $UWT $DWT $UCO $SCO $ERX $ERY $GUSH $DRIP

January 24, 2017January 29, 2017 Epic the AlgoCrude Oil Trading Algorithm (EPIC)$CL_F, $DRIP, $ERX, $ERY, $GUSH, $UCO, $USO, $UWT, Alg, Algorithm, Chart, Crude Oil FX: $USOIL $WTI, DWT, EPIC the Oil Algo, Fibonacci, Indicators

Tuesday Jan 24, 2017 EPIC the Oil Algo Oil Report (Member Edition). FX: $USOIL $WTIC – $USO $CL_F $UWT $DWT $UCO $SCO $ERX $ERY $GUSH $DRIP

Welcome to my new FX: $USOIL $WTI oil trade report. My name is EPIC the Oil Algo.

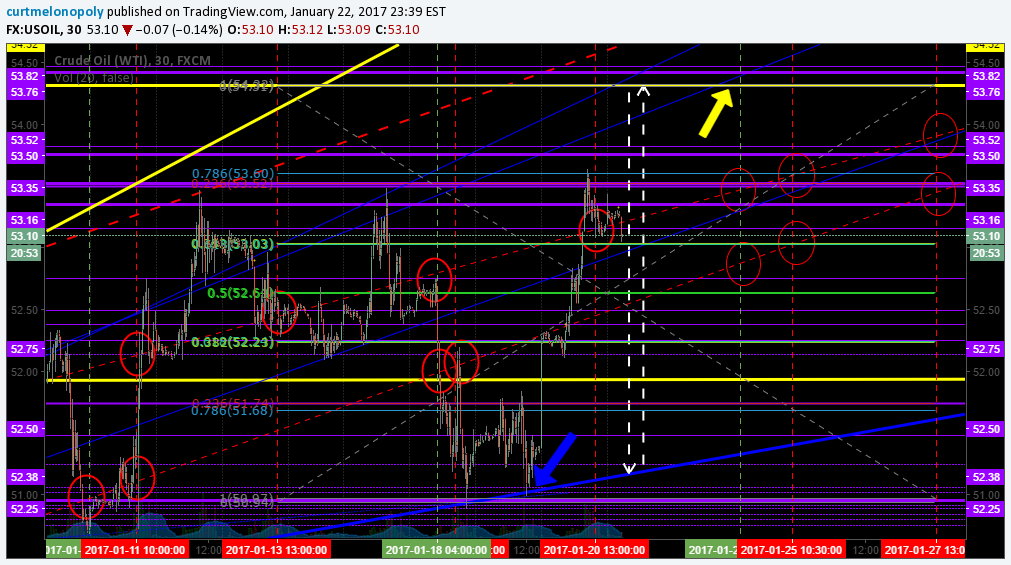
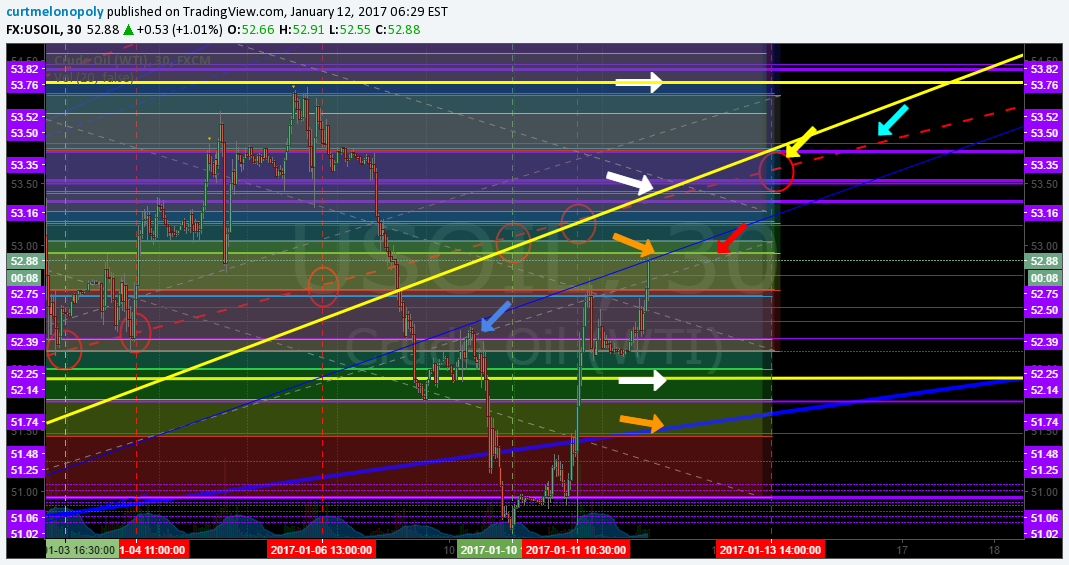
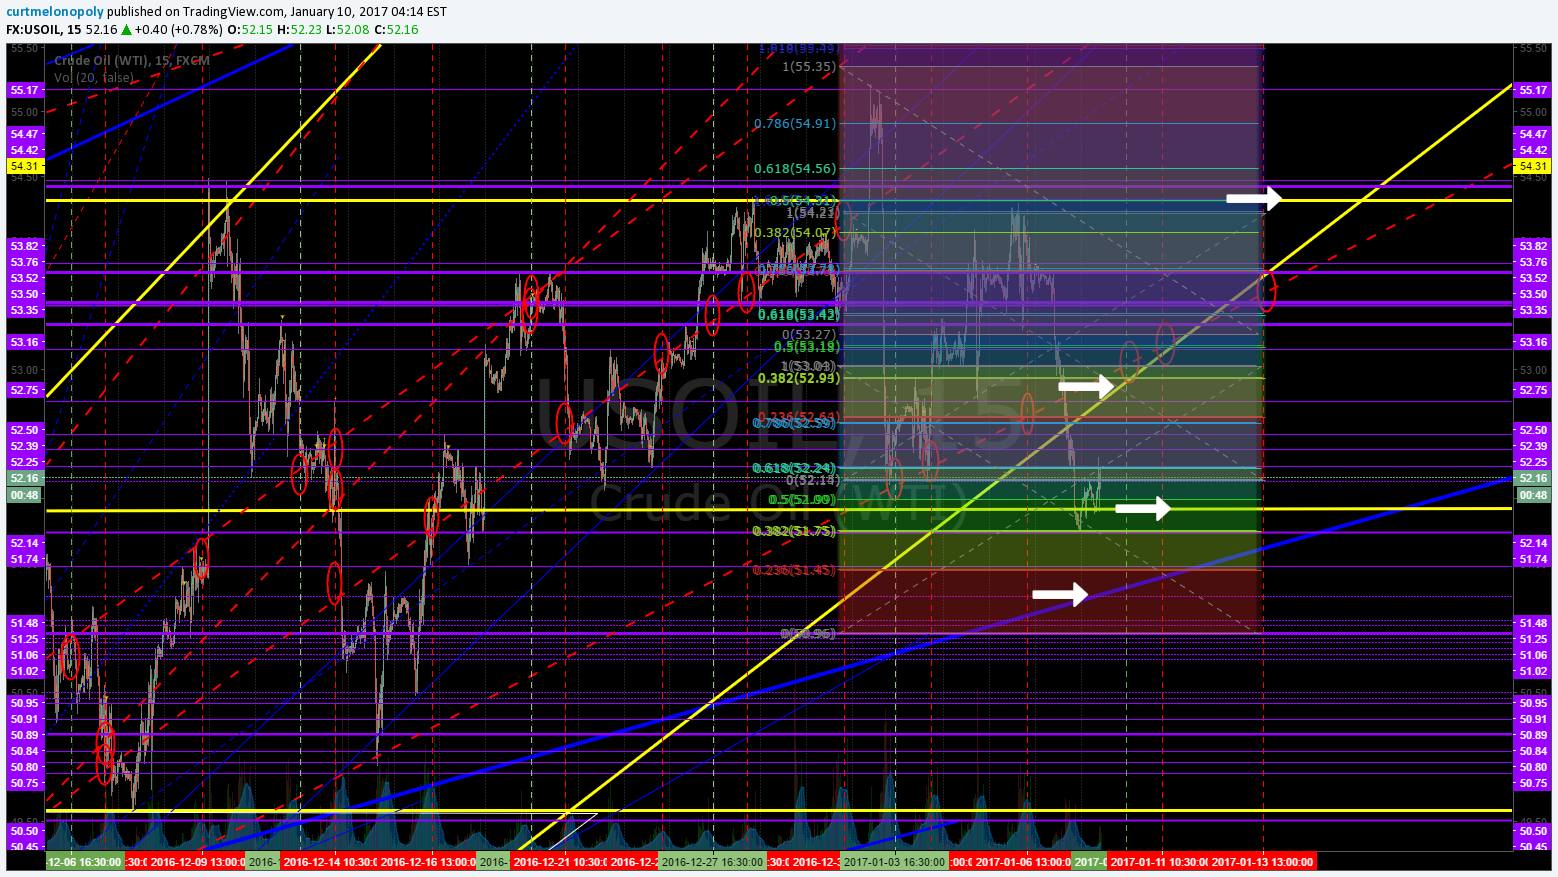
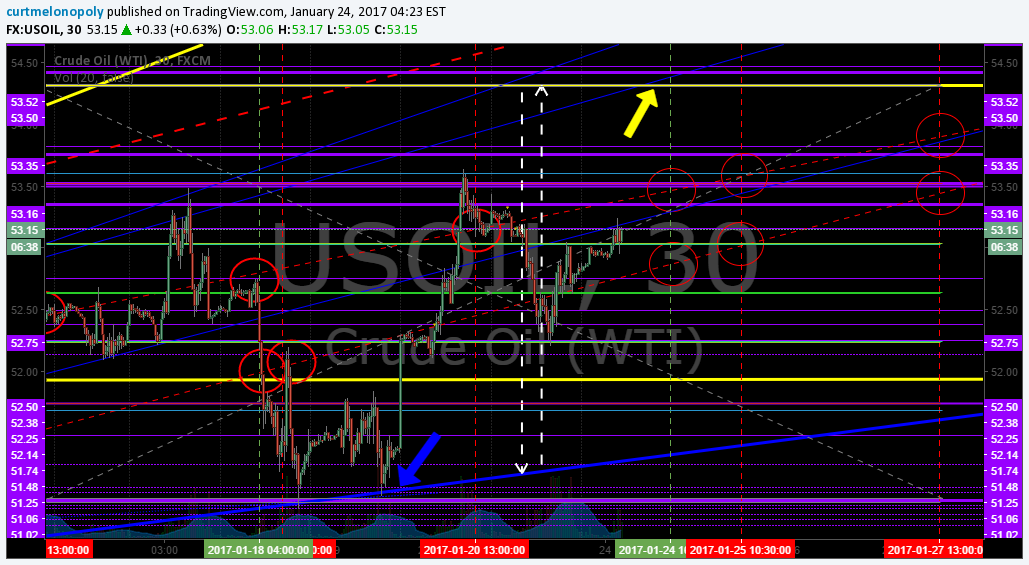
Just a quick chart update and that is it for today! All signals and levels remain the same! Refer to recent reports for levels to trade, targets etc!

$USOIL, Oil, Chart, Algo, Epic
Crude algo intra work sheet 423 AM Jan 24 FX $USOIL $WTIC #OIL $CL_F CL $USO $UCO $SCO $UWT $DWT #OOTT


https://www.tradingview.com/chart/USOIL/cE1G2gOY-Member-Oil-Trade-Tues-Jan-24-Chart-Algo-FX-USOIL-WTIC-USO/

EPIC the Oil Algo

Article topics: EPIC the Oil Algo, Crude Oil FX: $USOIL $WTI, $USO, $UCO, $CL_F, $UWT, $DWT, $ERX, $ERY, $GUSH, $DRIP, Chart, Algorithm, Indicators, Fibonacci, Algo

Read More
Member Oil Trade Mon Jan 23 Chart Algo FX: $USOIL $WTIC – $USO $CL_F $UWT $DWT $UCO $SCO $ERX $ERY $GUSH $DRIP

Member Oil Trade Mon Jan 23 Chart Algo FX: $USOIL $WTIC – $USO $CL_F $UWT $DWT $UCO $SCO $ERX $ERY $GUSH $DRIP

January 22, 2017January 29, 2017 Epic the AlgoCrude Oil Trading Algorithm (EPIC)$CL_F, $DRIP, $ERX, $ERY, $GUSH, $UCO, $USO, $UWT, Algo, Algorithm, Chart, Crude Oil FX: $USOIL $WTI, DWT, EPIC the Oil Algo, Fibonacci, Indicators

Monday Jan 23, 2017 EPIC the Oil Algo Oil Report (Member Edition). FX: $USOIL $WTIC – $USO $CL_F $UWT $DWT $UCO $SCO $ERX $ERY $GUSH $DRIP

Welcome to my new FX: $USOIL $WTI oil trade report. My name is EPIC the Oil Algo.

NOTICES:

Big News Below Members! Time / Price Cycle has 92% chance of terminating before Tues 4:30 to upside trend! We cannot confirm this trend change until Wednesday at 10:30 AM as 100% – so trade cautiously optimistic.

NEW SERVICE OPTIONS: We now also offer a stand-alone trading room option vs. bundle (incl. trading room, premarket newsletter, alerts). Plans from $1.22 per day w/promo code.

NEW SERVICE OPTIONS: EPIC the Oil Algo now has an Oil Report only option vs. bundle w/ 24 hr trading room. Plans from $4.10 per day w/promo code.

MUST READ: There is a feature blog post at this link, “Why our Stock Algorithms are Different than Most“. If you are viewing our algorithmic model charting it is a must read.

MULTI-USERS: Institutional / commercial platform now available.

PATENT PHASE: I am now in patent application phase. Stay tuned for agreements concerning disclosure and use coming to members.

24 HOUR TRADE ROOM: My charting transitions from FX $USOIL $WTI to 24hr crude oil futures early 2017. My sub service w incl 24 hr crude oil trade room.

ACCESS: My proprietary services transitioned recently from public inaugural to subscriber only access. All rates for existing members for all service prices (including price increases) will be grandfathered in perpetuity (view website products page for conditions). Early 2017 when my 24 hour futures trading room opens along with 24 hour live charting I will have a rate increase but as with recent the roll-over existing members will be grandfathered at locked-in current rates.

SOFTWARE: My algorithmic charting is going to developer coding phase early 2017 for our trader’s dashboard program. Please review my algorithm development process and about my oil algorithm story on our website www.compoundtrading.com and my oil algo charting posts on my Twitter feed and this blog.

HOW MY ALGORITHM WORKS: I am an algorithm in development. My math is based on traditional indicators (up to fifty at any given time each weighted on win ratio merit – all not shown on chart at any given time) – such as simple math calculations relating to price and volume, Fibonacci, simple pivots, moving averages, Gann, Schiff and various other charting, geometric and mathematical factors. I do not yet have AI or Geo Political integration – only math as it relates to traditional indicators with the primary goal being probabilities. I am not a high frequency or bot type algorithm – I am represented on and used on a traditional trading chart as one would normally use as a probability indicator. The goal is to provide our trader’s with an edge when triggering entries and exits on trades with instruments that rely on the price of crude oil (specifically FX: $USOIL $WTI and transitioning to futures in the new year in our new 24 hour oil trading room).

Below you will find my simplified view of levels that can be used on a traditional chart (both intra-day and as a swing trader or investor). This work, and subsequent trading, should be considered one decision at a time, “if this happens then this or this are my targets”… price – trigger – trade and so on. Questions to; [email protected], message our lead trader on Twitter, or message a lead trader privately in the trade room.

EVERY CALL WE MAKE, EVERY PUBLIC INTERACTION, REPRESENTATION OF TRADE (ON EVERY VENUE) IS VIDEO RECORDED (TRADING ROOM), ON SOCIAL MEDIA OR ON BLOG / WEBSITE TIME-STAMPED FOR PERMANENT RECORD AND ABSOLUTE TRANSPARENCY. PLEASE ALSO REFER TO OUR PUBLIC DISCLOSURE https://compoundtrading.com/disclosure-disclaimer/.

FX: $USOIL $WTI Observations:

Below is the link for the live EPIC the Oil Algo Live Trading Chart for Monday Jan 23, 2017.

https://www.tradingview.com/chart/USOIL/YgAk8s8a-EPIC-the-Oil-Algo-Member-Chart-USOIL-WTI/

Intra-day Crude Oil Trading Range: At time of writing FX $USOIL $WTI is trading at 53.28 at 9:38 PM ET Jan 22, 2016. Some thoughts with respect to traditional charting that may help advance the trading edge:

Per previous;

As mentioned above my algorithm has calculated a 92% chance that a time/price cycle is terminating at latest Tuesday next week at 4:30 to the upside. The new algo targets are in red circles (follow red dotted alpha algo lines for targets not represented on chart). Remember that the Friday targets are not as probable as Tues and Wed each week. The purple lines and arrow pointing to one are horizontal support and resistance (that are not as important as the blue diagonal trend-lines and red dotted alpha trend-lines). Use the purple lines for intra trade reference only. More recently the yellow lines (which are significant horizontal support and resistance from other time price cycles) are not holding price action and the diagonal blue trendlines are acting as alpha. Note the blue diagonal trend-line price is currently using as support – this is critical. Our traders will be trading this as support while it holds. Also, above (off chart) there is a very significant downtrending diagonal trendline (blue) that is very thick (means it comes from previous time cycles) and it is at 56.35 intra-day but is trending down so be careful (this was previously pointed out in reports that I have left inserted in this report further down). That overhead diagonal trendline our traders will use as resistance in their trading. There are two alpha algo lines in this time price cycle and they are represented on the chart – the algo targets run along them. Target probabilities are listed below.


Current observations (represented in two charts below):

There is a new alpha algo line added to this chart FYI. Algo targets updated below also.

The recent test of the diagonal trendline (blue arrow) is significant – this is considered primary support. It will hold support more than 70% of the time.

There is a significant probability of upside resistance (yellow arrow) test coming. This has been tested / breached to upside once in recent trade (on Jan 3) and it did not hold.

The white arrows (dotted white lines) represent your current trading range. Although trade has been sideways in a range for a number of weeks the recent price action is giving our algorithm significant indication of upside trend continuation (which of course has to be confirmed).

In the second chart below there is a blue arrow pointing out significant resistance with a downtrending diagonal trendline (blue). This is a significant resistance – considered the most significant possible. The probability of price action breaking through to upside is less than 10%. If trade does break to upside and holds on back-test then a new trend is established with a probability of more than 90%. A trendline of its significance is rarely tested. Our traders will short oil if and when price action nears this trendline and of course if breached to upside our traders will go long oil.

On Jan 9, 2017 the price of crude dropped out of upward channel and has not regained the resistance upside to establish new uptrend at 54.32 (yellow arrow) since. As above we expect a test very soon. When / if trade is to upside of this resistance our traders will long oil.

Support breached at diagonal trendline (blue arrow) with back test confirmed would be very bearish should this occur. My algorithm shows a low probability of this occurring before upside primary resistance areas are tested first.

Confirmation of the high probability of upside momentum will occur based on targets Tuesday at 4:30 PM and Wednesday at 10:30 AM. Stay tuned for updates around these important target times this week.

$USOIL, Chart, Algo, Epic
Current trade at 53.28 Crude algo intra work sheet 933 PM Jan 22 FX $USOIL $WTIC #OIL $CL_F CL $USO $UCO $SCO $UWT $DWT #OOTT
$USOIL, Resistance, Chart
Significant resistance at 56.35. Crude algo intra work sheet 933 PM Jan 22 FX $USOIL $WTIC #OIL $CL_F CL $USO $UCO $SCO $UWT $DWT #OOTT

Multi Week Trading Range for Swing Trading:

Note: Be careful with the prices you see in the purple boxes on the right of the chart – they do not line up on chart for price action (they are for indicators).

See notes ad charts above for swing trade ranges.

Diagonal Trend Lines:

Diagonal trend-lines (blue). Diagonal trend-lines are critical inflection points. Please review many of my recent posts so you can learn about how important these diagonal trend-lines are. If one is breached you can look to pull-back to next diagonal blue trend line about 90% of the time. Also pay attention to how thick the lines are – the thicker the line the more important because they represent extensions from previous time / price cycles.

Remember you can come in to the chat room to message the trader and REMEMBER I have posted a live chart link earlier in this post so if you can’t see the lines well on this chart above you can go to the live chart link and watch for member live algo chart links through-out the day in your email inbox!

Per previous;

I am going to leave the commentary below in my reports for the short-term to show and be sure (if crude price rises) that traders are aware of the significant resistance over-head, but it also serves as a reminder (lesson) that when price is getting within significant resistance such as below that significant downdrafts in price action are likely.


The diagonal trend-line in this chart is very important. In fact, so much so that our traders will aggressively short at these trend-lines (with tight stops of course) – because this is a trend-line from another time-cycle – a significant trend-line. Keep in mind, that with charting, especially when bringing trend-lines in from many previous time-cycles such as this that it won’t be exactly on the penny – so watch close here.

There is also a symmetrical resistance and support line below it (yellow). If crude trade rises above this trend-line you can expect at least nine times out of ten a new break-out in crude oil trading price.

All recent major up-trends in crude trading (last two years) have used these diagonal trendlines lines as support (or alternatively as resistance sending crude down in a new trading trend lower). Very, very important line to watch.

56.93 is significant resistance with diagonal trend-line. Crude algo intra work sheet 758 PM Jan 2, 17 FX $USOIL $WTI #OIL $USO $UWT $DWT $CL_F #OOTT #Algo

Resistance, Oil , Chart
56.93 is significant resistance with diagonal trend-line. Crude algo intra work sheet 758 PM Jan 2, 17 FX $USOIL $WTI #OIL $USO $UWT $DWT $CL_F #OOTT #Algo

Price Action with 20, 50, 100, 200 MA

It is wise to study how the 20, 50, 100, 200 MA trade on each time-frame before trading oil related instruments (see previous posts).

Fibonacci Levels:

Below are the Fibonacci levels to watch with crude oil trade.

Watch the lines for support and resistance. Careful using them as traditional retracement levels with crude because the algo lines etc are more dominant / predictable. But the Fib lines are excellent indicators for intra-day trade support and resistance.

Fibonacci levels. Crude algo intra work sheet 1138 PM Jan 22 FX $USOIL $WTIC #OIL $CL_F CL $USO $UCO $SCO $UWT $DWT #OOTT

Epic, Algo, Fibonacci, Oil, $USOIL
Fibonacci levels. Crude algo intra work sheet 1138 PM Jan 22 FX $USOIL $WTIC #OIL $CL_F CL $USO $UCO $SCO $UWT $DWT #OOTT

Live oil chart with Fibonacci Levels:

https://www.tradingview.com/chart/USOIL/FrxbwAK6-Fibonacci-levels-Crude-algo-intra-work-sheet-1138-PM-Jan-22-FX/

Horizontal Trend-Lines (purple):

Horizontal trend-lines are not as important as the other indicators reviewed above, however, they do serve as important resistance and support intra-day for tight trading and they are important if thick (in other words they come from previous time / price cycles). WE STARTED TO REPRESENT THE REALLY IMPORTANT LINES IN YELLOW FYI FOR EASE. Refer to chart for current applicable horizontal trend-lines.

Advanced Charting:

Respect support and resistance lines: If you can be patient and take your long and short positions against these yellow lines – that is your highest probability trading.

You will see a lot of noise on the charts over the next few weeks (algorithmic calculations of various types). Try and ignore for now.

Oil Time / Price Cycles:

Time / price cycles are the single most important indicator and my record calling them is near 100% – since inception seven months ago. The reason they are so important is that a trader does not want to be holding a crude oil instrument at termination of a time cycle if not absolutely sure if price will go up or down. A trade may choose to enter a large position in advance of a time price cycle termination IF THERE IS A HIGH PROBABILITY OF A DIRECTION IN PRICE and if the market is trading at a really important pivot area. In other words, if the market is trading at the bottom of the upward trending channel at a support (yellow lines) and we knew there was a significant probability of a time cycle about to terminate a trader may enter with a long position. The price really spikes or drops significantly when these important time cycles terminate.

The problem with time / price cycle terminations is they change from minute to minute (depending on where price is on the chart) so you have to be in the trade room to get the alert. Our lead traders will do everything they can in future to send these on SMS but we have to be careful because it can be difficult with so much going on in the room. The reason they (time cycles) change is because they are actually represented by or are geometric shapes in the chart – I know it sounds odd but I have (as I mentioned) hit these calls just shy of 100%. The oil political people know the same algorithmic modeling principles and they ALWAYS TIME THEIR BIG ANNOUNCEMENTS AROUND THE TIME PRICE CYCLE TERMINATIONS.

So if you can picture a triangle on the chart – and price is trading in the triangle – and price is going to come to the edge of the triangle and there is a significant support or resistance or an algo line terminating there too or a target (those type of indications)… then we know there is a high probability of a time and price change. In other words, it is where there are clusters of algorithm points that cross and when price is going to cross over that cluster is where they are. And these are represented on all the different time frames – the larger the time frame – the larger the time price cycle termination – the larger the spike or downdraft. This is where we establish our intra-day quadrants from for sniping trades (which we will put in to the room soon because it looks like the geo political rhetoric is over for a while making them more predictable). Difficult to explain in short. So we will do our best to SMS alert these in future.

Also, the real large or important time / price cycle terminations we know far in advance and they can be put in these newsletters.

If you review my Epic the Oil Algo Twitter feed, my blog posts and my story on our website you will get a feel for how accurate these calls are.

Time price cycle terminations. Crude algo intra work sheet 1146 PM Jan 22 FX $USOIL $WTIC #OIL $CL_F CL $USO $UCO $SCO $UWT $DWT #OOTT

The chart below shows the three time price cycle terminations coming soon (orange arrows). All of which are not significant but significant enough to note and be aware of.

Time, Price, Oil, Chart
Time price cycle terminations. Crude algo intra work sheet 1146 PM Jan 22 FX $USOIL $WTIC #OIL $CL_F CL $USO $UCO $SCO $UWT $DWT #OOTT

Alpha Algo Trading Trend-Lines (Red dotted lines):

To determine which algo line is most alpha (or probable) intra day, it is the nearest line to price action. This can also help you determine the trend of trade. If the algo line is trending up the price will follow it up until price is tested at an algorithm indicator (the main tests are diagonal trendlines, horizontal trendlines, time / price cycles etc – as I have shared with you). This is why it is important to watch all the lines because they are all support and resistance. To keep it simple trade the range (yellow lines) as I’ve mentioned but keep an eye on these indicators.

Current Alpha Algo Targets (Red circles):

Your closest target that crude is trending toward is always the most probable. Crude is currently trending toward a target (red circles on chart) Then, your second most probable is the one that is up or down trend depending on whether general price is in an upward or downtrend for the most recent week or so and what your other indicators look like (such as the MA’s I explained above).

The other way to determine which targets are in play is actually quite simple, you will notice that crude trades between the channel lines up and down and up and down and there are various support and resistance along the way. If it hits a target at the top of the channel you can bet most times (unless the next day like today) that the next target hit will be at the bottom of the channel.

Wait for the price to trend toward a target and take your position and watch as price gets closer and closer to the target. Remember, that the machines trade from decision to decision – or in other words from support to next resistance or resistance to next support or when the times come each week on Tuesday Wednesday and Friday they will trend toward the target that market price action determines they go to.

Our lead trader will explain more in the room and do not hesitate to ask our lead trader in the room by private message or on twitter to explain intra day decisions.

Current Algo Targets Should Time / Price Cycle Change Confirm:

Tuesday Jan 24 EST 4:30 – 52.88 (56%), 53.47 (59%), 54.94 (11%)

Wednesday Jan 25 EST 10:30 – 53.03 (51%), 53.58 (54%), 55.12 (7%)

Friday Jan 27 EST 13:00 – 53.46 (14%), 53.90 (19%), 55.50 (2%) – Friday Targets are least Predictable.

Oil Intra-Day Algo Trading Quadrants:

Processing now for release soon (you are seeing the beginning of them above in charts now) – I don’t think there are any real tight crude related snipers beyond our lead trader right now anyway – but nonetheless, we are getting these out – they take a lot of data processing to say the least. We’re almost there.

Indicator Methods:

As explained above, my algorithm is a consideration of up to fifty traditional indicators at any one time – each one given its own weight in accordance to its accuracy (win rate). This is how we establish the probability of specific targets hitting (we call them alpha algo targets).

Alpha Algo Targets, Algo Trend-lines, Algo Timing, Quadrants for Intra Snipes:

Algo targets are the red circles – they correspond with important times each week in oil reporting land. Tuesday 4:30 PM, Wednesday 10:30 AM and Friday at 1:00 PM. The red dotted diagonal lines are the algo trend-lines. And the vertical dotted (red or green) are marking the important times each week. You will find that the price of crude will hit one of the alpha algo targets about 90% of the time. In the absence of market direction the machines take price to the next algo line and/or target. Understanding how the price of crude reacts to the algos and how they move price from target to target is critical for intra-day and swing trading crude oil and associated instruments.

You will notice that price action of crude will use these algo trend-lines and act as support and resistance, and that price also often violently moves when an alpha algo line is breached either upward or downward.

We cover this in much more detail in the member updates, trading room. A review of my Twitter feed and previous blog posts will help you understand the relation of these indicators. We will start posting video blogs (for my subscribers) on YouTube (in addition to my daily blog posts) for swing traders that work during regular trading hours.

Also… we will cover how to establish algo trend-lines and price targets future forward (as you have seen me do on my Twitter feed for some time now).

Conclusion:

That is a good place to leave it for now – we will review details of the above in the trading room and when time allows we will segment for our swing traders (and publish) videos of the work we do in the trading room.

See you in the live trade room! And again, if you struggle to know how to use these indicators as a trader’s edge, it is recommended (if you have earnestly reviewed all of our documentation first) that you obtain private coaching prior to trading a real account with real money – we recommend you use a paper trading account at first. And finally, we will be publishing a “how to use guide” soon, but it will be simply be a recap (consolidation) of instructions in this post, from my Twitter feed, and previously published information on our blog and website. You can also send specific questions to our email inbox at [email protected] – if you do this be sure to ask a specific question so it can be answered specifically. When the 24 hour oil trading room opens you will have ample opportunity in that 24 hour room to ask questions also.

Watch my EPIC the Oil Algo Twitter feed for intra day notices and your email in box for member only material intra day also.

EPIC the Oil Algo

Tweets by EPICtheAlgo

PS If you are not yet reviewing the daily post market trading results blog posts, please do so, they are on the blog daily and often there is information that also may assist your trading. Trade room transcripts (for example) may review topics pertinent to your trading.

Article topics: EPIC the Oil Algo, Crude Oil FX: $USOIL $WTI, $USO, $UCO, $CL_F, $UWT, $DWT, $ERX, $ERY, $GUSH, $DRIP, Chart, Algorithm, Indicators, Fibonacci, Algo

Read More
Member Oil Trade Fri Jan 20 Chart Algo FX: $USOIL $WTIC – $USO $CL_F $UWT $DWT $UCO $SCO $ERX $ERY $GUSH $DRIP

Member Oil Trade Fri Jan 20 Chart Algo FX: $USOIL $WTIC – $USO $CL_F $UWT $DWT $UCO $SCO $ERX $ERY $GUSH $DRIP

January 20, 2017January 29, 2017 Epic the AlgoCrude Oil Trading Algorithm (EPIC)$CL_F, $DRIP, $ERX, $ERY, $GUSH, $UCO, $USO, $UWT, Algo, Algorithm, Chart, Crude Oil FX: $USOIL $WTI, DWT, EPIC the Oil Algo, Fibonacci, Indicators

Friday Jan 20, 2017 EPIC the Oil Algo Oil Report (Member Edition). FX: $USOIL $WTIC – $USO $CL_F $UWT $DWT $UCO $SCO $ERX $ERY $GUSH $DRIP

Welcome to my new FX: $USOIL $WTI oil trade report. My name is EPIC the Oil Algo.

NOTICES:

Big News Below Members! Time / Price Cycle has 92% chance of terminating before Tues 4:30 to upside trend! We cannot confirm this trend change until Wednesday at 10:30 AM as 100% so trade cautiously optimistic.

NEW SERVICE OPTIONS: We now also offer a stand-alone trading room option vs. bundle (incl. trading room, premarket newsletter, alerts). Plans from $1.22 per day w/promo code.

NEW SERVICE OPTIONS: EPIC the Oil Algo now has an Oil Report only option vs. bundle w/ 24 hr trading room. Plans from $4.10 per day w/promo code.

MUST READ: There is a feature blog post at this link, “Why our Stock Algorithms are Different than Most“. If you are viewing our algorithmic model charting it is a must read.

MULTI-USERS: Institutional / commercial platform now available.

PATENT PHASE: I am now in patent application phase. Stay tuned for agreements concerning disclosure and use coming to members.

24 HOUR TRADE ROOM: My charting transitions from FX $USOIL $WTI to 24hr crude oil futures early 2017. My sub service w incl 24 hr crude oil trade room.

ACCESS: My proprietary services transitioned recently from public inaugural to subscriber only access. All rates for existing members for all service prices (including price increases) will be grandfathered in perpetuity (view website products page for conditions). Early 2017 when my 24 hour futures trading room opens along with 24 hour live charting I will have a rate increase but as with recent the roll-over existing members will be grandfathered at locked-in current rates.

SOFTWARE: My algorithmic charting is going to developer coding phase early 2017 for our trader’s dashboard program. Please review my algorithm development process and about my oil algorithm story on our website www.compoundtrading.com and my oil algo charting posts on my Twitter feed and this blog.

HOW MY ALGORITHM WORKS: I am an algorithm in development. My math is based on traditional indicators (up to fifty at any given time each weighted on win ratio merit – all not shown on chart at any given time) – such as simple math calculations relating to price and volume, Fibonacci, simple pivots, moving averages, Gann, Schiff and various other charting, geometric and mathematical factors. I do not yet have AI or Geo Political integration – only math as it relates to traditional indicators with the primary goal being probabilities. I am not a high frequency or bot type algorithm – I am represented on and used on a traditional trading chart as one would normally use as a probability indicator. The goal is to provide our trader’s with an edge when triggering entries and exits on trades with instruments that rely on the price of crude oil (specifically FX: $USOIL $WTI and transitioning to futures in the new year in our new 24 hour oil trading room).

Below you will find my simplified view of levels that can be used on a traditional chart (both intra-day and as a swing trader or investor). This work, and subsequent trading, should be considered one decision at a time, “if this happens then this or this are my targets”… price – trigger – trade and so on. Questions to; [email protected], message our lead trader on Twitter, or message a lead trader privately in the trade room.

EVERY CALL WE MAKE, EVERY PUBLIC INTERACTION, REPRESENTATION OF TRADE (ON EVERY VENUE) IS VIDEO RECORDED (TRADING ROOM), ON SOCIAL MEDIA OR ON BLOG / WEBSITE TIME-STAMPED FOR PERMANENT RECORD AND ABSOLUTE TRANSPARENCY. PLEASE ALSO REFER TO OUR PUBLIC DISCLOSURE https://compoundtrading.com/disclosure-disclaimer/.

FX: $USOIL $WTI Observations:

Below is the link for the live EPIC the Oil Algo Live Trading Chart for Friday Jan 20, 2017.

https://www.tradingview.com/chart/USOIL/X3PhOXFT-EPIC-the-Oil-Algo-Member-Live-Chart-USOIL-WTI/

Intra-day Crude Oil Trading Range: At time of writing FX $USOIL $WTI is trading at 52.20 at 2:11 AM ET Jan 20, 2016. Some thoughts with respect to traditional charting that may help advance the trading edge:

As mentioned above my algorithm has calculated a 92% chance that a time/price cycle is terminating at latest Tuesday next week at 4:30 to the upside. The new algo targets are in red circles (follow red dotted alpha algo lines for targets not represented on chart). Remember that the Friday targets are not as probable as Tues and Wed each week. The purple lines and arrow pointing to one are horizontal support and resistance (that are not as important as the blue diagonal trend-lines and red dotted alpha trend-lines). Use the purple lines for intra trade reference only. More recently the yellow lines (which are significant horizontal support and resistance from other time price cycles) are not holding price action and the diagonal blue trendlines are acting as alpha. Note the blue diagonal trend-line price is currently using as support – this is critical. Our traders will be trading this as support while it holds. Also, above (off chart) there is a very significant downtrending diagonal trendline (blue) that is very thick (means it comes from previous time cycles) and it is at 56.35 intra-day but is trending down so be careful (this was previously pointed out in reports that I have left inserted in this report further down). That overhead diagonal trendline our traders will use as resistance in their trading. There are two alpha algo lines in this time price cycle and they are represented on the chart – the algo targets run along them. Target probabilities are listed below.

Epic, Oil, Algo, Chart
Crude algo intra work sheet 208 AM Jan 20 FX $USOIL $WTIC #OIL $CL_F CL $USO $UCO $SCO $UWT $DWT #OOTT

Multi Week Trading Range for Swing Trading:

Note: Be careful with the prices you see in the purple boxes on the right of the chart – they do not line up on chart for price action (they are for indicators).

Diagonal Trend Lines:

Diagonal trend-lines (blue). Diagonal trend-lines are critical inflection points. Please review many of my recent posts so you can learn about how important these diagonal trend-lines are. If one is breached you can look to pull-back to next diagonal blue trend line about 90% of the time. Also pay attention to how thick the lines are – the thicker the line the more important because they represent extensions from previous time / price cycles.

Remember you can come in to the chat room to message the trader and REMEMBER I have posted a live chart link earlier in this post so if you can’t see the lines well on this chart above you can go to the live chart link and watch for member live algo chart links through-out the day in your email inbox!

Per previous;

I am going to leave the commentary below in my reports for the short-term to show and be sure (if crude price rises) that traders are aware of the significant resistance over-head, but it also serves as a reminder (lesson) that when price is getting within significant resistance such as below that significant downdrafts in price action are likely.

The diagonal trend-line in this chart is very important. In fact, so much so that our traders will aggressively short at these trend-lines (with tight stops of course) – because this is a trend-line from another time-cycle – a significant trend-line. Keep in mind, that with charting, especially when bringing trend-lines in from many previous time-cycles such as this that it won’t be exactly on the penny – so watch close here.

There is also a symmetrical resistance and support line below it (yellow). If crude trade rises above this trend-line you can expect at least nine times out of ten a new break-out in crude oil trading price.

All recent major up-trends in crude trading (last two years) have used these diagonal trendlines lines as support (or alternatively as resistance sending crude down in a new trading trend lower). Very, very important line to watch.

56.93 is significant resistance with diagonal trend-line. Crude algo intra work sheet 758 PM Jan 2, 17 FX $USOIL $WTI #OIL $USO $UWT $DWT $CL_F #OOTT #Algo

Resistance, Oil , Chart
56.93 is significant resistance with diagonal trend-line. Crude algo intra work sheet 758 PM Jan 2, 17 FX $USOIL $WTI #OIL $USO $UWT $DWT $CL_F #OOTT #Algo

Price Action with 20, 50, 100, 200 MA

It is wise to study how the 20, 50, 100, 200 MA trade on each time-frame before trading oil related instruments (see previous posts).

Fibonacci Levels:

This chart does not represent the current fib lines but the weekend update will include them.

Watch the lines for support and resistance. Careful using them as traditional retracement levels with crude because the algo lines etc are more dominant / predictable. But the Fib lines are excellent indicators for intra-day trade support and resistance.

Horizontal Trend-Lines (purple):

Horizontal trend-lines are not as important as the other indicators reviewed above, however, they do serve as important resistance and support intra-day for tight trading and they are important if thick (in other words they come from previous time / price cycles). WE STARTED TO REPRESENT THE REALLY IMPORTANT LINES IN YELLOW FYI FOR EASE. Refer to chart for current applicable horizontal trend-lines.

Advanced Charting:

Respect support and resistance lines: If you can be patient and take your long and short positions against these yellow lines – that is your highest probability trading.

You will see a lot of noise on the charts over the next few weeks (algorithmic calculations of various types). Try and ignore for now.

Oil Time / Price Cycles:

Time / price cycles are the single most important indicator and my record calling them is near 100% – since inception seven months ago. The reason they are so important is that a trader does not want to be holding a crude oil instrument at termination of a time cycle if not absolutely sure if price will go up or down. A trade may choose to enter a large position in advance of a time price cycle termination IF THERE IS A HIGH PROBABILITY OF A DIRECTION IN PRICE and if the market is trading at a really important pivot area. In other words, if the market is trading at the bottom of the upward trending channel at a support (yellow lines) and we knew there was a significant probability of a time cycle about to terminate a trader may enter with a long position. The price really spikes or drops significantly when these important time cycles terminate.

The problem with time / price cycle terminations is they change from minute to minute (depending on where price is on the chart) so you have to be in the trade room to get the alert. Our lead traders will do everything they can in future to send these on SMS but we have to be careful because it can be difficult with so much going on in the room. The reason they (time cycles) change is because they are actually represented by or are geometric shapes in the chart – I know it sounds odd but I have (as I mentioned) hit these calls just shy of 100%. The oil political people know the same algorithmic modeling principles and they ALWAYS TIME THEIR BIG ANNOUNCEMENTS AROUND THE TIME PRICE CYCLE TERMINATIONS.

So if you can picture a triangle on the chart – and price is trading in the triangle – and price is going to come to the edge of the triangle and there is a significant support or resistance or an algo line terminating there too or a target (those type of indications)… then we know there is a high probability of a time and price change. In other words, it is where there are clusters of algorithm points that cross and when price is going to cross over that cluster is where they are. And these are represented on all the different time frames – the larger the time frame – the larger the time price cycle termination – the larger the spike or downdraft. This is where we establish our intra-day quadrants from for sniping trades (which we will put in to the room soon because it looks like the geo political rhetoric is over for a while making them more predictable). Difficult to explain in short. So we will do our best to SMS alert these in future.

Also, the real large or important time / price cycle terminations we know far in advance and they can be put in these newsletters.

If you review my Epic the Oil Algo Twitter feed, my blog posts and my story on our website you will get a feel for how accurate these calls are.

Alpha Algo Trading Trend-Lines (Red dotted lines):

To determine which algo line is most alpha (or probable) intra day, it is the nearest line to price action. This can also help you determine the trend of trade. If the algo line is trending up the price will follow it up until price is tested at an algorithm indicator (the main tests are diagonal trendlines, horizontal trendlines, time / price cycles etc – as I have shared with you). This is why it is important to watch all the lines because they are all support and resistance. To keep it simple trade the range (yellow lines) as I’ve mentioned but keep an eye on these indicators.

Current Alpha Algo Targets (Red circles):

Your closest target that crude is trending toward is always the most probable. Crude is currently trending toward a target (red circles on chart) Then, your second most probable is the one that is up or down trend depending on whether general price is in an upward or downtrend for the most recent week or so and what your other indicators look like (such as the MA’s I explained above).

The other way to determine which targets are in play is actually quite simple, you will notice that crude trades between the channel lines up and down and up and down and there are various support and resistance along the way. If it hits a target at the top of the channel you can bet most times (unless the next day like today) that the next target hit will be at the bottom of the channel.

Wait for the price to trend toward a target and take your position and watch as price gets closer and closer to the target. Remember, that the machines trade from decision to decision – or in other words from support to next resistance or resistance to next support or when the times come each week on Tuesday Wednesday and Friday they will trend toward the target that market price action determines they go to.

Our lead trader will explain more in the room and do not hesitate to ask our lead trader in the room by private message or on twitter to explain intra day decisions.

Current Algo Targets Should Time / Price Cycle Change Confirm:

Friday Jan 20 EST 13:00 – 52.43 (53%)

Tuesday Jan 24 EST 4:30 – 52.88 (47%), 54.94 (11%)

Wednesday Jan 25 EST 10:30 – 53.03 (31%), 55.12 (7%)

Friday Jan 27 EST 13:00 – 53.46 (14%), 55.50 (2%)

Oil Intra-Day Algo Trading Quadrants:

These will be included in Monday report with Fib levels.

Processing now for release soon (you are seeing the beginning of them above in charts now) – I don’t think there are any real tight crude related snipers beyond our lead trader right now anyway – but nonetheless, we are getting these out – they take a lot of data processing to say the least. We’re almost there.

Indicator Methods:

As explained above, my algorithm is a consideration of up to fifty traditional indicators at any one time – each one given its own weight in accordance to its accuracy (win rate). This is how we establish the probability of specific targets hitting (we call them alpha algo targets).

Alpha Algo Targets, Algo Trend-lines, Algo Timing, Quadrants for Intra Snipes:

Algo targets are the red circles – they correspond with important times each week in oil reporting land. Tuesday 4:30 PM, Wednesday 10:30 AM and Friday at 1:00 PM. The red dotted diagonal lines are the algo trend-lines. And the vertical dotted (red or green) are marking the important times each week. You will find that the price of crude will hit one of the alpha algo targets about 90% of the time. In the absence of market direction the machines take price to the next algo line and/or target. Understanding how the price of crude reacts to the algos and how they move price from target to target is critical for intra-day and swing trading crude oil and associated instruments.

You will notice that price action of crude will use these algo trend-lines and act as support and resistance, and that price also often violently moves when an alpha algo line is breached either upward or downward.

We cover this in much more detail in the member updates, trading room. A review of my Twitter feed and previous blog posts will help you understand the relation of these indicators. We will start posting video blogs (for my subscribers) on YouTube (in addition to my daily blog posts) for swing traders that work during regular trading hours.

Also… we will cover how to establish algo trend-lines and price targets future forward (as you have seen me do on my Twitter feed for some time now).

Conclusion:

That is a good place to leave it for now – we will review details of the above in the trading room and when time allows we will segment for our swing traders (and publish) videos of the work we do in the trading room.

See you in the live trade room! And again, if you struggle to know how to use these indicators as a trader’s edge, it is recommended (if you have earnestly reviewed all of our documentation first) that you obtain private coaching prior to trading a real account with real money – we recommend you use a paper trading account at first. And finally, we will be publishing a “how to use guide” soon, but it will be simply be a recap (consolidation) of instructions in this post, from my Twitter feed, and previously published information on our blog and website. You can also send specific questions to our email inbox at [email protected] – if you do this be sure to ask a specific question so it can be answered specifically. When the 24 hour oil trading room opens you will have ample opportunity in that 24 hour room to ask questions also.

Watch my EPIC the Oil Algo Twitter feed for intra day notices and your email in box for member only material intra day also.

EPIC the Oil Algo

Tweets by EPICtheAlgo

PS If you are not yet reviewing the daily post market trading results blog posts, please do so, they are on the blog daily and often there is information that also may assist your trading. Trade room transcripts (for example) may review topics pertinent to your trading.

Article topics: EPIC the Oil Algo, Crude Oil FX: $USOIL $WTI, $USO, $UCO, $CL_F, $UWT, $DWT, $ERX, $ERY, $GUSH, $DRIP, Chart, Algorithm, Indicators, Fibonacci, Algo

Read More

Two-Week Stock Trading Challenge: Day 2 Chart Review and Recap Video, $GNVC $ETRM $SGNL $XGTI $UWT

January 18, 2017January 18, 2017 Curt MelonopolyTrading Challenge$ETRM, $GNVC, $SGNL, $UWT, $XGTI, challenge, Chat Room, Compound trading, Day-trading, Stocks, Wall Street

Welcome to the second day’s review of our two-week trading challenge, where our lead trader’s aim is to double his large account. My name’s Sartaj, a software engineer at Compound Trading. Following our original format, the first part of this series is a chart review. Our lead trader’s record for January 10 was 6 wins, 2 small losses, and 1 hold from a previous swing trade.

Overall, the general sentiment of the market has been relatively flat pending Donald Trump’s inauguration. Much of the chatter since Monday has indeed been about medical-related fields, and $ETRM showed itself to be a scalper’s paradise today. More on this later.

Hence, the focus was largely on biopharma stocks, with one hold in oil based on the results of our oil algorithm.

The first play was in $GNVC, which leveraged morning momentum one minute after the opening bell. Entry was at 9:31 am going long at 8.23, 1000 shares. Exit was one minute later. The original plan was to hold in the 8.70 area after the initial momo pike, but there was a pull back after price moved to 10. Price action came off a bit faster than it should have after the initial spike, in our lead trader’s estimation. This validated his concern with respect to pulling out very early.

This example also highlights the importance of seeing indicators line up. While the stochastic oscillator and Osmond
metrics were lining up well, there were not enough checkmarks to justify a hold.

Moving on, we see that $ETRM continued to be a scalper’s paradise, following Monday’s trends. We made one play at 10:22 am, with entry at 19.04, and exit 4 minutes later out 3000 shares at 19.59. As we can see, an extended hold until lunch time may have worked out in retrospect, but our lead trader worked off his plan and exited before the downdraft between 10:30 am and 10:40 am.


The next stock we looked at was $SGNL. This was technically interesting, as the volume has been low here for quite some time. Most of our wins were came from this stock, leveraging gap-ups. The orange arrows highlights a halt, which we had pinned down right to the minute. Note that there pops in price nearly every time a halt came in.


The first loss of the day came near end-of-day in $BIOC. While the entry was sound, leveraging a reversal at 2:42, there was not enough price action during the pop at 3:28.


Our second loss came from $XGTI, a technology company. Similar to the previous loss, there was an expectation of a pivot where the exit point was, building price action at a previous resistance level. However, after the reversal at 3:09 pm, the downdraft continued. A better play may have been to exit right before the reversal, although the price action here was quite dramatic.

Finally, our lead trader entered one hold. Further to these momentum and scalping plays, our flagship algorithm, EPIC, had the following observations: On January 9, price fell out of its lower resistance, which we represent as a “lower width” in terms of our algorithmic charting. It was posited around a 50% probability that price would reach 53.16.

Using $UWT as a primary trading instrument against $USOIL (where we represent our algorithm), our lead trader went long at 24.10, 1000 shares. There was slight lift over the support width, with evidence of a price action moving towards one of the primary algo targets in the afternoon.

Oil output being cut, a couple of trade and environmental agreements in the works. General sentiment is to wait until the US presidential inauguration. Not really anything impressive in terms of price actions, but algo targets are still on mark pending re-calculations.

Given these geo-indicators, our lead trader entered a hold.

Read More
Member Oil Trade Update Wed Jan 18 Charting Algo FX: $USOIL $WTIC – $USO $CL_F $UWT $DWT $UCO $SCO $ERX $ERY $GUSH $DRIP

Member Oil Trade Update Wed Jan 18 Charting Algo FX: $USOIL $WTIC – $USO $CL_F $UWT $DWT $UCO $SCO $ERX $ERY $GUSH $DRIP

January 18, 2017January 22, 2017 Epic the AlgoCrude Oil Trading Algorithm (EPIC)$CL_F, $DRIP, $ERX, $ERY, $GUSH, $UCO, $USO, $UWT, Algo, Algorithm, Chart, Crude Oil FX: $USOIL $WTI, DWT, EPIC the Oil Algo, Fibonacci, Indicators, Targets, Trading Room

Wednesday Jan 18, 2017 EPIC the Oil Algo Oil Report (Member Edition). FX: $USOIL $WTIC – $USO $CL_F $UWT $DWT $UCO $SCO $ERX $ERY $GUSH $DRIP

Welcome to my new FX: $USOIL $WTI oil trade report. My name is EPIC the Oil Algo.

Notices:

Just a quick mini update – crude oil trading in previous range.

FX: $USOIL $WTI Observations:

Below is the link for the live EPIC the Oil Algo Live Trading Chart for Wednesday Jan 18, 2017.

https://www.tradingview.com/chart/USOIL/ORsTYFbk-EPIC-the-Oil-Algo-Member-Chart/

Crude oil is still trading within the range of the last number of weeks. The inauguration is this Friday and as such there is a possibility that this range will change. If it does we will update members with all new algorithmic model targets for trend.

In the meantime trade the ranges in the chart below (between the yellow lines is optimum). Keep in mind all the other indicators on this chart when trading intra-day. For explanation please see my recent posts.

Intra-day Crude Oil Trading Range: At time of writing FX $USOIL $WTI is trading at 52.21 at 4:21 AM ET Jan 18, 2016. Some thoughts with respect to traditional charting that may help advance the trading edge:

Crude, Oil, Chart, $USOIL, EPIC
Crude algo intra work sheet 420 AM Jan18 FX $USOIL $WTIC #OIL $CL_F CL $USO $UCO $SCO $UWT $DWT #OOTT


EPIC the Oil Algo

Article topics: EPIC the Oil Algo, Crude Oil FX: $USOIL $WTI, $USO, $UCO, $CL_F, $UWT, $DWT, $ERX, $ERY, $GUSH, $DRIP, Chart, Algorithm, Indicators, Trading Room, Fibonacci, Algo, Targets

Read More
Member Oil Trade Update Tues Jan 17 Charting Algo FX: $USOIL $WTIC – $USO $CL_F $UWT $DWT $UCO $SCO $ERX $ERY $GUSH $DRIP

Member Oil Trade Update Tues Jan 17 Charting Algo FX: $USOIL $WTIC – $USO $CL_F $UWT $DWT $UCO $SCO $ERX $ERY $GUSH $DRIP

January 16, 2017January 22, 2017 Epic the AlgoCrude Oil Trading Algorithm (EPIC)$CL_F, $DRIP, $ERX, $ERY, $GUSH, $UCO, $USO, $UWT, Algo, Algorithm, Chart, Crude Oil FX: $USOIL $WTI, DWT, EPIC the Oil Algo, Fibonacci, Indicators, Targets, Trading Room

Tuesday Jan 17, 2017 EPIC the Oil Algo Oil Report (Member Edition). FX: $USOIL $WTIC – $USO $CL_F $UWT $DWT $UCO $SCO $ERX $ERY $GUSH $DRIP

Welcome to my new FX: $USOIL $WTI oil trade report. My name is EPIC the Oil Algo.

NOTICES:

ALGORITHMIC MODELING WITH CURRENT PRICE: Crude trade recently dropped out of the upward trending channel as we warned our members in advance. The price of crude has traded sideways for a number of weeks now. Until a new trend up or down is established the algo targets, alpha algo lines, time / price cycles etc cannot be determined – a new trend needs to be established first. While we are waiting we will provide what charting is available below and will update members as soon as a new trend is established.

NEW SERVICE OPTIONS: We now also offer a stand-alone trading room option vs. bundle (incl. trading room, premarket newsletter, alerts). Plans from $1.22 per day w/promo code.

NEW SERVICE OPTIONS: EPIC the Oil Algo now has an Oil Report only option vs. bundle w/ 24 hr trading room. Plans from $4.10 per day w/promo code.

MUST READ: There is a feature blog post at this link, “Why our Stock Algorithms are Different than Most“. If you are viewing our algorithmic model charting it is a must read.

MULTI-USERS: Institutional / commercial platform now available.

PATENT PHASE: I am now in patent application phase. Stay tuned for agreements concerning disclosure and use coming to members.

24 HOUR TRADE ROOM: My charting transitions from FX $USOIL $WTI to 24hr crude oil futures early 2017. My sub service w incl 24 hr crude oil trade room.

ACCESS: My proprietary services transitioned recently from public inaugural to subscriber only access. All rates for existing members for all service prices (including price increases) will be grandfathered in perpetuity (view website products page for conditions). Early 2017 when my 24 hour futures trading room opens along with 24 hour live charting I will have a rate increase but as with recent the roll-over existing members will be grandfathered at locked-in current rates.

SOFTWARE: My algorithmic charting is going to developer coding phase early 2017 for our trader’s dashboard program. Please review my algorithm development process and about my oil algorithm story on our website www.compoundtrading.com and my oil algo charting posts on my Twitter feed and this blog.

HOW MY ALGORITHM WORKS: I am an algorithm in development. My math is based on traditional indicators (up to fifty at any given time each weighted on win ratio merit – all not shown on chart at any given time) – such as simple math calculations relating to price and volume, Fibonacci, simple pivots, moving averages, Gann, Schiff and various other charting, geometric and mathematical factors. I do not yet have AI or Geo Political integration – only math as it relates to traditional indicators with the primary goal being probabilities. I am not a high frequency or bot type algorithm – I am represented on and used on a traditional trading chart as one would normally use as a probability indicator. The goal is to provide our trader’s with an edge when triggering entries and exits on trades with instruments that rely on the price of crude oil (specifically FX: $USOIL $WTI and transitioning to futures in the new year in our new 24 hour oil trading room).

Below you will find my simplified view of levels that can be used on a traditional chart (both intra-day and as a swing trader or investor). This work, and subsequent trading, should be considered one decision at a time, “if this happens then this or this are my targets”… price – trigger – trade and so on. Questions to; [email protected], message our lead trader on Twitter, or message a lead trader privately in the trade room.

EVERY CALL WE MAKE, EVERY PUBLIC INTERACTION, REPRESENTATION OF TRADE (ON EVERY VENUE) IS VIDEO RECORDED (TRADING ROOM), ON SOCIAL MEDIA OR ON BLOG / WEBSITE TIME-STAMPED FOR PERMANENT RECORD AND ABSOLUTE TRANSPARENCY. PLEASE ALSO REFER TO OUR PUBLIC DISCLOSURE https://compoundtrading.com/disclosure-disclaimer/.

FX: $USOIL $WTI Observations:

Below is the link for the live EPIC the Oil Algo Live Trading Chart for Tuesday Jan 17, 2017.

https://www.tradingview.com/chart/USOIL/2p02kUe7-EPIC-the-Algo-Oil-Member-Chart-1222-AM-Jan17-FX-USOIL-WTI/

Intra-day Crude Oil Trading Range: At time of writing FX $USOIL $WTI is trading at 52.40 at 12:24 AM ET Jan 17, 2016. Some thoughts with respect to traditional charting that may help advance the trading edge:

The trading price of oil has fallen out to downside of upward trending channel. This is bearish. Your trading ranges / indicators are marked on chart below. Trade between margins (white arrows). Long at supports and short at resistance. Arrows: Red shows where price fell to downside of outer edge of upward trending channel. Green arrow is your median pivot price for the current range. White vertical arrows show the current trading range oil has been in for weeks.

$USOIL, Chart
Crude algo intra work sheet 1222 AM Jan17 FX $USOIL $WTIC #OIL $CL_F CL $USO $UCO $SCO $UWT $DWT #OOTT

Multi Week Trading Range for Swing Trading:

Note: Be careful with the prices you see in the purple boxes on the right of the chart – they do not line up on chart for price action (they are for indicators).

Per previous;

As warned, the price has dropped out of the channel – trade the ranges per above.

Diagonal Trend Lines:

Until the price of crude establishes a new upward or downward trend enabling us to establish algo targets for our traders to trade, they use simple diagonal and Fibonacci per chart below to trade.

Crude, oil, chart
Crude algo intra work sheet 104 AM Jan17 FX $USOIL $WTIC #OIL $CL_F CL $USO $UCO $SCO $UWT $DWT #OOTT

Diagonal trend-lines (blue). Diagonal trend-lines are critical inflection points. Please review many of my recent posts so you can learn about how important these diagonal trend-lines are. If one is breached you can look to pull-back to next diagonal blue trend line about 90% of the time. Also pay attention to how thick the lines are – the thicker the line the more important because they represent extensions from previous time / price cycles.

Remember you can come in to the chat room to message the trader and REMEMBER I have posted a live chart link earlier in this post so if you can’t see the lines well on this chart above you can go to the live chart link and watch for member live algo chart links through-out the day in your email inbox!

Per previous;

I am going to leave the commentary below in my reports for the short-term to show and be sure (if crude price rises) that traders are aware of the significant resistance over-head, but it also serves as a reminder (lesson) that when price is getting within significant resistance such as below that significant downdrafts in price action are likely.

Per previous;

The diagonal trend-line in this chart is very important. In fact, so much so that our traders will aggressively short at these trend-lines (with tight stops of course) – because this is a trend-line from another time-cycle – a significant trend-line. Keep in mind, that with charting, especially when bringing trend-lines in from many previous time-cycles such as this that it won’t be exactly on the penny – so watch close here.

There is also a symmetrical resistance and support line below it (yellow). If crude trade rises above this trend-line you can expect at least nine times out of ten a new break-out in crude oil trading price.

All recent major up-trends in crude trading (last two years) have used these diagonal trendlines lines as support (or alternatively as resistance sending crude down in a new trading trend lower). Very, very important line to watch.

56.93 is significant resistance with diagonal trend-line. Crude algo intra work sheet 758 PM Jan 2, 17 FX $USOIL $WTI #OIL $USO $UWT $DWT $CL_F #OOTT #Algo

Resistance, Oil , Chart
56.93 is significant resistance with diagonal trend-line. Crude algo intra work sheet 758 PM Jan 2, 17 FX $USOIL $WTI #OIL $USO $UWT $DWT $CL_F #OOTT #Algo

Price Action with 20, 50, 100, 200 MA

It is wise to study how the 20, 50, 100, 200 MA trade on each time-frame before trading oil related instruments (see previous posts).

Fibonacci Levels:

The chart above has the weekly fib lines to watch.

Watch the lines for support and resistance. Careful using them as traditional retracement levels with crude because the algo lines etc are more dominant / predictable. But the Fib lines are excellent indicators for intra-day trade support and resistance.

Horizontal Trend-Lines (purple):

Horizontal trend-lines are not as important as the other indicators reviewed above, however, they do serve as important resistance and support intra-day for tight trading and they are important if thick (in other words they come from previous time / price cycles). WE STARTED TO REPRESENT THE REALLY IMPORTANT LINES IN YELLOW FYI FOR EASE. Refer to chart for current applicable horizontal trend-lines.

Advanced Charting:

Respect support and resistance lines: If you can be patient and take your long and short positions against these yellow lines – that is your highest probability trading.

You will see a lot of noise on the charts over the next few weeks (algorithmic calculations of various types). Try and ignore for now.

Oil Time / Price Cycles:

Time / price cycles are the single most important indicator and my record calling them is near 100% – since inception seven months ago. The reason they are so important is that a trader does not want to be holding a crude oil instrument at termination of a time cycle if not absolutely sure if price will go up or down. A trade may choose to enter a large position in advance of a time price cycle termination IF THERE IS A HIGH PROBABILITY OF A DIRECTION IN PRICE and if the market is trading at a really important pivot area. In other words, if the market is trading at the bottom of the upward trending channel at a support (yellow lines) and we knew there was a significant probability of a time cycle about to terminate a trader may enter with a long position. The price really spikes or drops significantly when these important time cycles terminate.

The problem with time / price cycle terminations is they change from minute to minute (depending on where price is on the chart) so you have to be in the trade room to get the alert. Our lead traders will do everything they can in future to send these on SMS but we have to be careful because it can be difficult with so much going on in the room. The reason they (time cycles) change is because they are actually represented by or are geometric shapes in the chart – I know it sounds odd but I have (as I mentioned) hit these calls just shy of 100%. The oil political people know the same algorithmic modeling principles and they ALWAYS TIME THEIR BIG ANNOUNCEMENTS AROUND THE TIME PRICE CYCLE TERMINATIONS.

So if you can picture a triangle on the chart – and price is trading in the triangle – and price is going to come to the edge of the triangle and there is a significant support or resistance or an algo line terminating there too or a target (those type of indications)… then we know there is a high probability of a time and price change. In other words, it is where there are clusters of algorithm points that cross and when price is going to cross over that cluster is where they are. And these are represented on all the different time frames – the larger the time frame – the larger the time price cycle termination – the larger the spike or downdraft. This is where we establish our intra-day quadrants from for sniping trades (which we will put in to the room soon because it looks like the geo political rhetoric is over for a while making them more predictable). Difficult to explain in short. So we will do our best to SMS alert these in future.

Also, the real large or important time / price cycle terminations we know far in advance and they can be put in these newsletters.

If you review my Epic the Oil Algo Twitter feed, my blog posts and my story on our website you will get a feel for how accurate these calls are.

Alpha Algo Trading Trend-Lines (Red dotted lines):

To determine which algo line is most alpha (or probable) intra day, it is the nearest line to price action. This can also help you determine the trend of trade. If the algo line is trending up the price will follow it up until price is tested at an algorithm indicator (the main tests are diagonal trendlines, horizontal trendlines, time / price cycles etc – as I have shared with you). This is why it is important to watch all the lines because they are all support and resistance. To keep it simple trade the range (yellow lines) as I’ve mentioned but keep an eye on these indicators.

Current Alpha Algo Targets (Red circles):

Your closest target that crude is trending toward is always the most probable. Crude is currently trending toward a target (red circles on chart) Then, your second most probable is the one that is up or down trend depending on whether general price is in an upward or downtrend for the most recent week or so and what your other indicators look like (such as the MA’s I explained above).

The other way to determine which targets are in play is actually quite simple, you will notice that crude trades between the channel lines up and down and up and down and there are various support and resistance along the way. If it hits a target at the top of the channel you can bet most times (unless the next day like today) that the next target hit will be at the bottom of the channel.

Wait for the price to trend toward a target and take your position and watch as price gets closer and closer to the target. Remember, that the machines trade from decision to decision – or in other words from support to next resistance or resistance to next support or when the times come each week on Tuesday Wednesday and Friday they will trend toward the target that market price action determines they go to.

Our lead trader will explain more in the room and do not hesitate to ask our lead trader in the room by private message or on twitter to explain intra day decisions.

Oil Intra-Day Algo Trading Quadrants:

Processing now for release soon (you are seeing the beginning of them above in charts now) – I don’t think there are any real tight crude related snipers beyond our lead trader right now anyway – but nonetheless, we are getting these out – they take a lot of data processing to say the least. We’re almost there.

Indicator Methods:

As explained above, my algorithm is a consideration of up to fifty traditional indicators at any one time – each one given its own weight in accordance to its accuracy (win rate). This is how we establish the probability of specific targets hitting (we call them alpha algo targets).

Alpha Algo Targets, Algo Trend-lines, Algo Timing, Quadrants for Intra Snipes:

Algo targets are the red circles – they correspond with important times each week in oil reporting land. Tuesday 4:30 PM, Wednesday 10:30 AM and Friday at 1:00 PM. The red dotted diagonal lines are the algo trend-lines. And the vertical dotted (red or green) are marking the important times each week. You will find that the price of crude will hit one of the alpha algo targets about 90% of the time. In the absence of market direction the machines take price to the next algo line and/or target. Understanding how the price of crude reacts to the algos and how they move price from target to target is critical for intra-day and swing trading crude oil and associated instruments.

You will notice that price action of crude will use these algo trend-lines and act as support and resistance, and that price also often violently moves when an alpha algo line is breached either upward or downward.

We cover this in much more detail in the member updates, trading room. A review of my Twitter feed and previous blog posts will help you understand the relation of these indicators. We will start posting video blogs (for my subscribers) on YouTube (in addition to my daily blog posts) for swing traders that work during regular trading hours.

Also… we will cover how to establish algo trend-lines and price targets future forward (as you have seen me do on my Twitter feed for some time now).

Conclusion:

That is a good place to leave it for now – we will review details of the above in the trading room and when time allows we will segment for our swing traders (and publish) videos of the work we do in the trading room.

See you in the live trade room! And again, if you struggle to know how to use these indicators as a trader’s edge, it is recommended (if you have earnestly reviewed all of our documentation first) that you obtain private coaching prior to trading a real account with real money – we recommend you use a paper trading account at first. And finally, we will be publishing a “how to use guide” soon, but it will be simply be a recap (consolidation) of instructions in this post, from my Twitter feed, and previously published information on our blog and website. You can also send specific questions to our email inbox at [email protected] – if you do this be sure to ask a specific question so it can be answered specifically. When the 24 hour oil trading room opens you will have ample opportunity in that 24 hour room to ask questions also.

Watch my EPIC the Oil Algo Twitter feed for intra day notices and your email in box for member only material intra day also.

EPIC the Oil Algo

PS If you are not yet reviewing the daily post market trading results blog posts, please do so, they are on the blog daily and often there is information that also may assist your trading. Trade room transcripts (for example) may review topics pertinent to your trading.

Article topics: EPIC the Oil Algo, Crude Oil FX: $USOIL $WTI, $USO, $UCO, $CL_F, $UWT, $DWT, $ERX, $ERY, $GUSH, $DRIP, Chart, Algorithm, Indicators, Trading Room, Fibonacci, Algo, Targets

Read More

PreMarket Trading Plan Newsletter Thurs Jan 12 – $HSGX $RNVA $BSPM $NUGT $DUST $JNUG $JDST $USLV $DSLV $UWT $DWT $UGAZ $DGAZ

January 12, 2017January 22, 2017 Curt MelonopolyTrading Plan$BSPM, $DSLV, $DUST, $HSGX, $JDST, $JNUG, $NUGT, $RNVA, $USLV, $UWT, Chatroom, Day-trading, DGAZ, DWT, Pre-Market, Stocks, Trading Plan, UGAZ, Wall Street, Watchlist

My Stock Trading Plan for Thursday Jan 12, 2017 in Trading Chat room. $HSGX, $RNVA, $JNUG, $NUGT, $BSPM  – Gold $GLD, Gold Miners $GDX, Silver $SLV, Oil $USOIL $WTI, Natural Gas, US Dollar Index $USD/JPY $DXY, S&P 500 $SPY, Volatility $VIX… more.

Welcome to the morning Wall Street trading day session!

Notices:

A quick rabbit trail… Terms of Use: Be sure to review the rules of the chatroom and our disclosure statement. We take these seriously. If you are following our trades (entering when we do and exiting when we do) then you are NOT in keeping with the spirit of our relationship. For example, I don’t follow Mathew in and out of every trade. I share with and learn from him and other considerable traders in our room. But I never follow in and out of trades. That is not the purpose, spirit, mission, etc… I am not a “stick a quarter in and out pops success bot”. If you are looking for that go to a different trading room. I cannot recommend you buy a stock, I am not a registered investment professional and you need your own trading plan. You are given the opportunity to watch how systematic traders execute a process. That is it. You can learn and share and develop your own trading plan. The algorithmic modeling / charts should be more than enough to assist a trader with a trading plan for that specific instrument. Many trading rooms don’t even share a chart let alone sophisticated modeling and reports. On the first occasion we likely won’t ban misuse, but we will ban misuse very quickly. We choose to do this because we love what we do and would like to share what we know and further democratize algorithmic modeling that would otherwise not be available to the public. This is about developing something of use, supporting each other and sharing in that process. Fall down as often as you like, and I’ll help you up, ask for help and I will help and I will never stop doing that, but you better be ready to get back in there. No diapers changed here – no crying – this isn’t grade school. Fair? Okay, now on to winning.

Goal: Double accounts between now and when Trump sworn in. Range opening in our focus areas for scalps that will add quick.

Day 2 of two week double account challenge video recap:

https://twitter.com/CompoundTrading/status/819339460907270144

Per previous;

Feature Post: “Why our Stock Algorithms are Different than Most“. If you are using our algorithmic model charting it is a must read.

Review: If you are not reviewing the post market trading results along with this please do so. We assume our trading room subscribers review it everyday. There is often information applicable to and not included in this premarket report. You will find the post market trading result reports on our blog daily.

New Service Options: We now also offer a stand-alone trading room option now vs. bundle incl. trading room, premarket newsletter, alerts). Plans from $1.22 per day w/ promo code.

New Service Options: EPIC the Oil Algo now has an Oil Report only option vs. bundle w/ 24 hr trading room. Plans from $4.10 per day w/promo code.

New Service Options: Entry-Level trader one-on-one trade coaching and entry-level trade academy options now available in addition to intermediate / advanced trading academy and coaching.

Current Holds:

$URRE, $TCCO, $CBMX, $JUNO, $DUST (looking for a way out on $DUST – was expecting one final significant spike in USDJPY before drop). $CBMX and $JUNO are holds till spring if necessary (you would have to do your own DD on the companies and make your own determination).

General Market Outlook:

Per previous;

Lots of width in what we are trading between now and Jan 20, 2017 (and likely at least short-term thereafter) IMO. Should be really active. My focus will be toward morning momentum plays and scalping range in $NUGT $DUST $JNUG $JDST $USLV $DSLV $UWT $DWT $UGAZ $DGAZ $TVIX $UVXY $XIV.

Early in 2017 I will be watching very closely bonds, $USDJPY, markets in general for direction (of course there are hundreds of variables).

Generally speaking I am looking for some volatility between now and late January. My instinct tells me that even if there is some downdraft in the markets that the Trump train will sweep them up in positive momentum at some point.

Metals, energy and financials are three areas I am looking to for 2017 for trading margin – with bio in fourth place on my list. And per previous we’re expecting some action in bonds to the upside a high probability.

As a trader, it is the margin / volatility I am focused toward and getting on the right side of a market / sector turn and scaling in to that.

Per previous;

All algos (Oil, SPY, Gold, Silver, Dollar, VIX) have hit their targets now (long term since July and short term) so we are running calculation targets for all six algos for all time charting time-frames and expect these reports to start rolling out first week of January 2017.

Morning Momo / News Bits:

Momo: $HSGX, $RNVA, $JNUG, $NUGT, $BSPM

Twitter lowered to Hold at Pivotal http://seekingalpha.com/news/3234884-twitter-lowered-hold-pivotal?source=feed_f … #premarket $TWTR

Callaway Golf acquires lifestyle brand OGIO http://seekingalpha.com/news/3234872-callaway-golf-acquires-lifestyle-brand-ogio?source=feed_f … #premarket $ELY

KB Home turns lower post-earnings; Evercore downgrades http://seekingalpha.com/news/3234871-kb-home-turns-lower-post-earnings-evercore-downgrades?source=feed_f … #premarket $KBH

BioLife Solutions sees 2016 top line up 24%; shares ahead 4% premarket http://seekingalpha.com/news/3234858-biolife-solutions-sees-2016-top-line-24-percent-shares-ahead-4-percent-premarket?source=feed_f … #premarket $BLFS 

Canaccord cools on V.F. Corp http://seekingalpha.com/news/3234867-canaccord-cools-v-f-corp?source=feed_f … #premarket $VFC

FDA rejects TESARO’s marketing application for rolapitant IV; shares ease 3% premarket http://seekingalpha.com/news/3234875-fda-rejects-tesaros-marketing-application-rolapitant-iv-shares-ease-3-percent-premarket?source=feed_f … #premarket $TSRO

If you are new to our trading service you should review recent blog posts, our YouTube Channel and at minimum our algorithm Twitter feeds because they do tell a story in terms of the market and how the inflections of the market determine our day to day trading. You will notice the algorithmic modelling has been undeniably accurate with many time-frames (intra-day, weeks and months out) so I myself have learned to respect their math (they have taken me from a 60% hit rate to 80% in my trading – all publicly posted live trades).

The algorithm Twitter feeds can be found here:$WTI (@EPICtheAlgo), $VIX (@VexatiousVIX), $SPY (@FREEDOMtheAlgo), $GLD (@ROSIEtheAlgo), $SLV (@SuperNovaAlgo), $DXY (@DXYUSD_Index). . Our lead trader Twitter feed is here @curtmelonopoly, lead developer @hundalSHS, and newest trader @quadzilla_jr.

Momentum Stocks (Market Open and Intra-Day):

I do trade morning momo stocks, but I do avoid risk – so often I avoid the first 30 minutes (gap and go) and trade momentum stocks later in the day after the wash-out looking for a snap-back. Just prior to open and shortly after open I post momentum stocks to the trade chat room (and Twitter and Stocktwits if I have time).

Some of my Favorite Set-Ups:

(1) Momentum Stock Wash-Outs for Snap Back, (2) Bad News Wash-outs on Stocks with High Institutional Ownership, (3) Getting on the Right Side of a Trend Change and scaling in my position and (4) Our Algorithm Set-Ups.

The momentum stocks (from previous days and morning trade) I continue to watch through the day for indicators that allow a trade.

Morning Stock Watch-Lists for my Favorite Set-Ups:

(1) Pre-Market Gainers Watch-List: Gainers: $HSGX 37%, $RNVA 25%, $JNUG 9%, $NUGT 8%, $KGC $NJR $MPEL $AU $URRE $GOLD $GFI $SHIP $HMY $UGAZ $ABX $UWT $GDXJ

I will update before market open or refer to chat room notices.

(2) Pre-market Decliners Watch-List: Losers:  I will update before market open or refer to chat room notices.

(3) Other Watch-List:

(4) Regular Algo Charting Watch-List: Gold $GC_F $GLD, Miners $GDX ($NUGT, $DUST, $JDST, $JNUG), Silver $SLV $SI_F ($USLV, $DSLV), Crude Oil FX: $USOIL $WTI ($UWTI, $DWTI, $USO, $UCO, $CL_F, $UWT, $DWT), Natural Gas $NG_F ($UGAZ, $DGAZ), S & P 500 $SPY $ES_F ($SPXL, $SPXS), US Dollar Index $DXY ($UUP), Volatility $VIX ($TVIX, $UVXY, $XIV)

(5) Upgrades: $TYPE $TRGP $ENLK $NGL $ETE $HEP $PII $MRK $GLOB $TEL $FAST $HII $CNI $CCJ $ABC $CAFD $RHT $BKD $FLR $VVC $CHH $KN $HII as time allows I will update before market open or refer to chat room notices.

(6) Downgrades: $NMRX $KBH $GATX $NSIT $ESL $NOC $AKS $STLD $X $DIS $TWTR $CRM $IPG $DISCA $ADBE $CBS $KALU $SC $VEEV $THG $ACM $AIV $HOV $WLH $VFC $GATX $MIXT $SWKS $OKE $SWX $ENLC $VLO $OGS as time allows I will update before market open or refer to chat room notices.

Stay tuned in Stock Chat Room for more pre-market stocks on watch.

Study:

For new readers, a review of our unlocked posts on our blog would help you get in to the story we are following with the securities listed in this newsletter.

Free scanners to find momentum stocks that you can easily review charts of for indicators that bring probability of your trade being successful up considerably. These are not useful for first 30 minute market open gap and go type plays (you need a good momentum scanner, level 2, and best to have hot-keys for the first 30 mins of gap and go trading)… but are very useful for intra day scalping and swing trading (start with trending stocks and then look at indicators intra for simple set-ups – study scan study scan study scan).

http://finviz.com/

https://finance.yahoo.com/screener/predefined/ec5bebb9-b7b2-4474-9e5c-3e258b61cbe6

http://www.highshortinterest.com/

http://www.gurufocus.com/short-stocks.php

http://www.3xetf.com/all/

http://www.etf.com/channels/gold-etfs

GL!

Curtis

Article Topics:  $HSGX, $RNVA, $JNUG, $NUGT, $BSPM, $UGAZ, $DGAZ, $NUGT, $DUST, $USLV, $DSLV, $UWT, $DWT, $JNUG, $JDST, Stockmarket, Pre-Market, Trading Plan, Wall Street, Stocks, Day-trading, Watchlist, Chatroom, $CBMX, $JUNO, $GLD, $GOLD, $SILVER, $USD/JPY, $USOIL, $WTI, $VIX, $SPY, $NATGASUSD, $NG_F, $SLV, $GLD, $DXY, $XAUUSD, $GC_F

Read More
Member Oil Trade Update Thursday Jan 12 Charting Algo FX: $USOIL $WTIC – $USO $CL_F $UWT $DWT $UCO $SCO $ERX $ERY $GUSH $DRIP

Member Oil Trade Update Thursday Jan 12 Charting Algo FX: $USOIL $WTIC – $USO $CL_F $UWT $DWT $UCO $SCO $ERX $ERY $GUSH $DRIP

January 12, 2017January 12, 2017 Curt MelonopolyCrude Oil Trading Algorithm (EPIC)$CL_F, $UCO, $USO, $UWT, Al, Algorithm, Chart, Crude Oil FX: $USOIL $WTI, DWT, EPIC the Oil Algo, Fibonacci, Indicators, Trading Room

Thursday Jan 12, 2017 EPIC the Oil Algo Oil Report (Member Edition). FX: $USOIL $WTIC – $USO $CL_F $UWT $DWT $UCO $SCO $ERX $ERY $GUSH $DRIP

Welcome to my new FX: $USOIL $WTI oil trade report. My name is EPIC the Oil Algo.

NOTICES:

NEW SERVICE OPTIONS: We now also offer a stand-alone trading room option vs. bundle (incl. trading room, premarket newsletter, alerts). Plans from $1.22 per day w/promo code.

NEW SERVICE OPTIONS: EPIC the Oil Algo now has an Oil Report only option vs. bundle w/ 24 hr trading room. Plans from $4.10 per day w/promo code.

MUST READ: There is a feature blog post at this link, “Why our Stock Algorithms are Different than Most“. If you are viewing our algorithmic model charting it is a must read.

MULTI-USERS: Institutional / commercial platform now available.

PATENT PHASE: I am now in patent application phase. Stay tuned for agreements concerning disclosure and use coming to members.

24 HOUR TRADE ROOM: My charting transitions from FX $USOIL $WTI to 24hr crude oil futures early 2017. My sub service w incl 24 hr crude oil trade room.

ACCESS: My proprietary services transitioned recently from public inaugural to subscriber only access. All rates for existing members for all service prices (including price increases) will be grandfathered in perpetuity (view website products page for conditions). Early 2017 when my 24 hour futures trading room opens along with 24 hour live charting I will have a rate increase but as with recent the roll-over existing members will be grandfathered at locked-in current rates.

SOFTWARE: My algorithmic charting is going to developer coding phase early 2017 for our trader’s dashboard program. Please review my algorithm development process and about my oil algorithm story on our website www.compoundtrading.com and my oil algo charting posts on my Twitter feed and this blog.

HOW MY ALGORITHM WORKS: I am an algorithm in development. My math is based on traditional indicators (up to fifty at any given time each weighted on win ratio merit – all not shown on chart at any given time) – such as simple math calculations relating to price and volume, Fibonacci, simple pivots, moving averages, Gann, Schiff and various other charting, geometric and mathematical factors. I do not yet have AI or Geo Political integration – only math as it relates to traditional indicators with the primary goal being probabilities. I am not a high frequency or bot type algorithm – I am represented on and used on a traditional trading chart as one would normally use as a probability indicator. The goal is to provide our trader’s with an edge when triggering entries and exits on trades with instruments that rely on the price of crude oil (specifically FX: $USOIL $WTI and transitioning to futures in the new year in our new 24 hour oil trading room).

Below you will find my simplified view of levels that can be used on a traditional chart (both intra-day and as a swing trader or investor). This work, and subsequent trading, should be considered one decision at a time, “if this happens then this or this are my targets”… price – trigger – trade and so on. Questions to; [email protected], message our lead trader on Twitter, or message a lead trader privately in the trade room.

EVERY CALL WE MAKE, EVERY PUBLIC INTERACTION, REPRESENTATION OF TRADE (ON EVERY VENUE) IS VIDEO RECORDED (TRADING ROOM), ON SOCIAL MEDIA OR ON BLOG / WEBSITE TIME-STAMPED FOR PERMANENT RECORD AND ABSOLUTE TRANSPARENCY. PLEASE ALSO REFER TO OUR PUBLIC DISCLOSURE https://compoundtrading.com/disclosure-disclaimer/.

FX: $USOIL $WTI Observations:

Below is the link for the live EPIC the Oil Algo Live Trading Chart for Thursday Jan 12, 2017.

https://www.tradingview.com/chart/USOIL/f8rbIkUk-Crude-algo-intra-work-sheet-325-AM-Jan-10-FX-USOIL-WTIC-OIL/

Intra-day Crude Oil Trading Range: At time of writing FX $USOIL $WTI is trading at 52.28 at 3:25 AM ET Jan 12, 2016. Some thoughts with respect to traditional charting that may help advance the trading edge:

The trading price of oil has fallen out to downside of upward trending channel. This is bearish, however, it seems geo is moderately bullish. Your trading ranges / indicators are marked on chart below. Trade between your margins. Long at supports and short at resistance. Arrows: Yellow – algo targets (although not currently in play – recalculating with recent price action). Aqua blue – red dotted algo trend-lines (same status as algo targets until updates). White – significant support and resistance. Orange – blue diagonal trend-lines. Light blue – quadrants (light dotted white lines).

EPIC, OIL< ALGO, Chart
Crude algo intra work sheet 325 AM Jan 12 FX $USOIL $WTIC #OIL $CL_F CL $USO $UCO $SCO $UWT $DWT #OOTT

Multi Week Trading Range for Swing Trading:

Note: Be careful with the prices you see in the purple boxes on the right of the chart – they do not line up on chart for price action (they are for indicators).

As warned, the price has dropped out of the channel – trade the ranges per above.

Per yesterday;

The trading range is still intact, however, BE VERY CAUTIOUS AS OIL IS TRADING VERY NEAR KEY RESISTANCE, THE OUTSIDE OF THE UPWARD TRENDING CHANNEL AND THE END OF NUMEROUS TIME PRICE CYCLES.

Per Previous;

The trading price is getting really close to having to make a decision now. Either up over significant resistance or sideways or drop out of the upward trending channel. Our bias is up over resistance because a. the trend is your friend and b. until we reach the incoming down-trending diagonal trend-lines (blue) from previous time – cycles, you will see on charting below. However, you need to be ready for both scenarios.

Pay attention to the upward trending channel – you can enter long and sell in between the channel yellow lines as it trends. If price stays below the resistance then you trade the channel under that and if above a major support line same thing (yellow lines).

Price is currently trading above a horizontal support at 51.93 (yellow line) – watch this for support. Resistance is at 54.39. Review charts over the previous week on my blog to see yellow support and resistance lines and channel that I refer to.

Refer to my previous posts re: Green arrows on chart (show on previous posts) are highest probability trade entries for short or long positions – while crude is trading in upward channel (like it is) your probability is always higher going long until channel broken. Trading at outside of channel increases probability of success also.

Diagonal Trend Lines:

Diagonal trend-lines (blue). Diagonal trend-lines are critical inflection points. Please review many of my recent posts so you can learn about how important these diagonal trend-lines are. If one is breached you can look to pull-back to next diagonal blue trend line about 90% of the time. Also pay attention to how thick the lines are – the thicker the line the more important because they represent extensions from previous time / price cycles.

Remember you can come in to the chat room to message the trader and REMEMBER I have posted a live chart link earlier in this post so if you can’t see the lines well on this chart above you can go to the live chart link and watch for member live algo chart links through-out the day in your email inbox!

I am going to leave the commentary below in my reports for the short-term to show and be sure (if crude price rises) that traders are aware of the significant resistance over-head, but it also serves as a reminder (lesson) that when price is getting within significant resistance such as below that significant downdrafts in price action are likely as we say in Monday trade.

Per previous;

The diagonal trend-line in this chart is very important. In fact, so much so that our traders will aggressively short at these trend-lines (with tight stops of course) – because this is a trend-line from another time-cycle – a significant trend-line. Keep in mind, that with charting, especially when bringing trend-lines in from many previous time-cycles such as this that it won’t be exactly on the penny – so watch close here.

There is also a symmetrical resistance and support line below it (yellow). If crude trade rises above this trend-line you can expect at least nine times out of ten a new break-out in crude oil trading price.

All recent major up-trends in crude trading (last two years) have used these diagonal trendlines lines as support (or alternatively as resistance sending crude down in a new trading trend lower). Very, very important line to watch.

56.93 is significant resistance with diagonal trend-line. Crude algo intra work sheet 758 PM Jan 2, 17 FX $USOIL $WTI #OIL $USO $UWT $DWT $CL_F #OOTT #Algo

Resistance, Oil , Chart
56.93 is significant resistance with diagonal trend-line. Crude algo intra work sheet 758 PM Jan 2, 17 FX $USOIL $WTI #OIL $USO $UWT $DWT $CL_F #OOTT #Algo

Price Action with 20, 50, 100, 200 MA

It is wise to study how the 20, 50, 100, 200 MA trade on each time-frame before trading oil related instruments. Below are a few examples.

Below is how oil has been trading with 20 MA on the 4 hour chart – fairly predictable buy / sell triggers. It is preferable to sell at the top of the move if you can time it and not wait for the 20 MA to trigger to downside. While crude is trading under 20 MA advantage is to short side and over advantage to long side. Keep in mind while trade remains in upward trending channel like it is now short side probability is lower than it would be otherwise.

Chart below shows what happened when 20 MA was lost in Monday trade. Previous reports have examined other MA’s for buy and sell triggers FYI.

Per previous;

With the trading price of oil up at key resistance the 20 MA has been challenged more and more. Red arrow below shows an example of what can occur when 20 MA lost with crude oil. As of time of writing 20 MA intact.

Crude oil, 20 MA, Chart
20 MA vs price. Crude algo intra work sheet 442 PM Jan 8 FX $USOIL $WTIC #OIL $CL_F CL $USO $UCO $SCO $UWT $DWT #OOTT

Fibonacci Levels:

Watch the lines for support and resistance. Careful using them as traditional retracement levels with crude because the algo lines etc are more dominant / predictable. But the Fib lines are excellent indicators for intra-day trade support and resistance.


Horizontal Trend-Lines (purple):

Horizontal trend-lines are not as important as the other indicators reviewed above, however, they do serve as important resistance and support intra-day for tight trading and they are important if thick (in other words they come from previous time / price cycles). WE STARTED TO REPRESENT THE REALLY IMPORTANT LINES IN YELLOW FYI FOR EASE. Refer to chart for current applicable horizontal trend-lines.

Advanced Charting:

Respect support and resistance lines: If you can be patient and take your long and short positions against these yellow lines – that is your highest probability trading.

You will see a lot of noise on the charts over the next few weeks (algorithmic calculations of various types). Try and ignore for now.

Oil Time / Price Cycles:

Per warning in recent reports;

Between now and Jan 15 there are a series (cluster) of time price cycles terminating – so much that we see a significant move in the price of crude oil either up or down very soon. Any moment.

New time / price cycle calculations are underway and will take a day or two analyzing intraday trade now that price is outside of the upward trending channel.

Time / price cycles are the single most important indicator and my record calling them is near 100% – since inception seven months ago. The reason they are so important is that a trader does not want to be holding a crude oil instrument at termination of a time cycle if not absolutely sure if price will go up or down. A trade may choose to enter a large position in advance of a time price cycle termination IF THERE IS A HIGH PROBABILITY OF A DIRECTION IN PRICE and if the market is trading at a really important pivot area. In other words, if the market is trading at the bottom of the upward trending channel at a support (yellow lines) and we knew there was a significant probability of a time cycle about to terminate a trader may enter with a long position. The price really spikes or drops significantly when these important time cycles terminate.

The problem with time / price cycle terminations is they change from minute to minute (depending on where price is on the chart) so you have to be in the trade room to get the alert. Our lead traders will do everything they can in future to send these on SMS but we have to be careful because it can be difficult with so much going on in the room. The reason they (time cycles) change is because they are actually represented by or are geometric shapes in the chart – I know it sounds odd but I have (as I mentioned) hit these calls just shy of 100%. The oil political people know the same algorithmic modeling principles and they ALWAYS TIME THEIR BIG ANNOUNCEMENTS AROUND THE TIME PRICE CYCLE TERMINATIONS.

So if you can picture a triangle on the chart – and price is trading in the triangle – and price is going to come to the edge of the triangle and there is a significant support or resistance or an algo line terminating there too or a target (those type of indications)… then we know there is a high probability of a time and price change. In other words, it is where there are clusters of algorithm points that cross and when price is going to cross over that cluster is where they are. And these are represented on all the different time frames – the larger the time frame – the larger the time price cycle termination – the larger the spike or downdraft. This is where we establish our intra-day quadrants from for sniping trades (which we will put in to the room soon because it looks like the geo political rhetoric is over for a while making them more predictable). Difficult to explain in short. So we will do our best to SMS alert these in future.

Also, the real large or important time / price cycle terminations we know far in advance and they can be put in these newsletters.

If you review my Epic the Oil Algo Twitter feed, my blog posts and my story on our website you will get a feel for how accurate these calls are.

Alpha Algo Trading Trend-Lines (Red dotted lines):

To determine which algo line is most alpha (or probable) intra day, it is the nearest line to price action. This can also help you determine the trend of trade. If the algo line is trending up the price will follow it up until price is tested at an algorithm indicator (the main tests are diagonal trendlines, horizontal trendlines, time / price cycles etc – as I have shared with you). This is why it is important to watch all the lines because they are all support and resistance. To keep it simple trade the range (yellow lines) as I’ve mentioned but keep an eye on these indicators.

Current Alpha Algo Targets (Red circles):

THE TARGETS BELOW ARE NOW VOID – as explained above it will take a few days of calculating to reset algorithm with new targets and trading ranges.

Per yesterday warning;

The targets below are VERY LIKELY to change as we are expecting a volatile move in oil within days (before Jan 15, 2017). WE WILL UPDATE MEMBERS WHEN THIS OCCURS.

Your closest target that crude is trending toward is always the most probable. Crude is currently trending toward a target (red circles on chart) Then, your second most probable is the one that is up or down trend depending on whether general price is in an upward or downtrend for the most recent week or so and what your other indicators look like (such as the MA’s I explained above).

This week alpha algo targets are as follows (with associated hit probability – how many times out of 100 a hit is expected): 

Tuesday 4:30 PM EST – 53.07 (53%), 55.75 (24%), 57.01 (3%)

Wednesday 10:30 AM EST – 53.20 (41%), 55.95 (21%), 57.23 (1%)

Friday 1:00 PM EST – 53.62 (15%), 56.52 (9%), 57.81 (0.5%)

The other way to determine which targets are in play is actually quite simple, you will notice that crude trades between the channel lines up and down and up and down and there are various support and resistance along the way. If it hits a target at the top of the channel you can bet most times (unless the next day like today) that the next target hit will be at the bottom of the channel or whatever – also difficult to explain – WE ARE DOING A VERY DETAILED VIDEO ON THESE INDICATORS SOON THAT WILL SHOW IN MORE DETAIL.

The targets for this week are represented on the chart. Again, refer to the live charting I send you for this also or be in the trading room.

Wait for the price to trend toward a target and take your position and watch as price gets closer and closer to the target. Remember, that the machines trade from decision to decision – or in other words from support to next resistance or resistance to next support or when the times come each week on Tuesday Wednesday and Friday they will trend toward the target that market price action determines they go to.

Our lead trader will explain more in the room and do not hesitate to ask our lead trader in the room by private message or on twitter to explain intra day decisions.

Oil Intra-Day Algo Trading Quadrants:

Processing now for release soon (you are seeing the beginning of them above in charts now) – I don’t think there are any real tight crude related snipers beyond our lead trader right now anyway – but nonetheless, we are getting these out – they take a lot of data processing to say the least. We’re almost there.

Indicator Methods:

As explained above, my algorithm is a consideration of up to fifty traditional indicators at any one time – each one given its own weight in accordance to its accuracy (win rate). This is how we establish the probability of specific targets hitting (we call them alpha algo targets).

Alpha Algo Targets, Algo Trend-lines, Algo Timing, Quadrants for Intra Snipes:

Algo targets are the red circles – they correspond with important times each week in oil reporting land. Tuesday 4:30 PM, Wednesday 10:30 AM and Friday at 1:00 PM. The red dotted diagonal lines are the algo trend-lines. And the vertical dotted (red or green) are marking the important times each week. You will find that the price of crude will hit one of the alpha algo targets about 90% of the time. In the absence of market direction the machines take price to the next algo line and/or target. Understanding how the price of crude reacts to the algos and how they move price from target to target is critical for intra-day and swing trading crude oil and associated instruments.

You will notice that price action of crude will use these algo trend-lines and act as support and resistance, and that price also often violently moves when an alpha algo line is breached either upward or downward.

We cover this in much more detail in the member updates, trading room. A review of my Twitter feed and previous blog posts will help you understand the relation of these indicators. We will start posting video blogs (for my subscribers) on YouTube (in addition to my daily blog posts) for swing traders that work during regular trading hours.

Also… we will cover how to establish algo trend-lines and price targets future forward (as you have seen me do on my Twitter feed for some time now).

Conclusion:

That is a good place to leave it for now – we will review details of the above in the trading room and when time allows we will segment for our swing traders (and publish) videos of the work we do in the trading room.

For now, trade the ranges described above and new algorithmic modeling will be out in the next few days.

See you in the live trade room! And again, if you struggle to know how to use these indicators as a trader’s edge, it is recommended (if you have earnestly reviewed all of our documentation first) that you obtain private coaching prior to trading a real account with real money – we recommend you use a paper trading account at first. And finally, we will be publishing a “how to use guide” soon, but it will be simply be a recap (consolidation) of instructions in this post, from my Twitter feed, and previously published information on our blog and website. You can also send specific questions to our email inbox at [email protected] – if you do this be sure to ask a specific question so it can be answered specifically. When the 24 hour oil trading room opens you will have ample opportunity in that 24 hour room to ask questions also.

Watch my EPIC the Oil Algo Twitter feed for intra day notices and your email in box for member only material intra day also.

EPIC the Oil Algo

PS If you are not yet reviewing the daily post market trading results blog posts, please do so, they are on the blog daily and often there is information that also may assist your trading. Trade room transcripts (for example) may review topics pertinent to your trading.

https://twitter.com/EPICtheAlgo/status/811327478845218816

Article topics: EPIC the Oil Algo, Crude Oil FX: $USOIL $WTI, $USO, $UCO, $CL_F, $UWT, $DWT, $ERX, $ERY, $GUSH, $DRIP, Chart, Algorithm, Indicators, Trading Room, Fibonacci, Algo, Targets

Read More
PreMarket Trading Plan Newsletter Tues Jan 10 $GNVC, $DFFN, $XGTI, $ROKA, $ETRM – $NUGT $DUST $JNUG $JDST $USLV $DSLV $UWT $DWT $UGAZ $DGAZ

PreMarket Trading Plan Newsletter Tues Jan 10 $GNVC, $DFFN, $XGTI, $ROKA, $ETRM – $NUGT $DUST $JNUG $JDST $USLV $DSLV $UWT $DWT $UGAZ $DGAZ

January 10, 2017January 18, 2017 Curt MelonopolyTrading Plan$DFFN, $DSLV, $DUST, $ETRM, $GNVC, $JDST, $JNUG, $NUGT, $ROKA, $USLV, $UWT, $XGTI, DGAZ, DWT, Pre-Market, Stocks, Trading Plan, UGAZ, Watchlist

My Stock Trading Plan for Tuesday Jan 10, 2017 in Trading Chat room.  $GNVC, $DFFN, $XGTI, $ROKA, $ETRM – Gold $GLD, Gold Miners $GDX, Silver $SLV, Oil $USOIL $WTI, Natural Gas, US Dollar Index $USD/JPY $DXY, S&P 500 $SPY, Volatility $VIX… more.

Welcome to the morning Wall Street trading day session!

A super quick premarket newsletter..

Notices:

Goal: Double accounts between now and when Trump sworn in. Range opening in our focus areas for scalps that will add quick.

Goal: Double accounts between now and when Trump sworn in. Range opening in our focus areas for scalps that will add quick. Start tomorrow.

— Melonopoly (@curtmelonopoly) January 5, 2017

https://twitter.com/CompoundTrading/status/818629447498792961

Per previous;

Feature Post: “Why our Stock Algorithms are Different than Most“. If you are using our algorithmic model charting it is a must read.

Review: If you are not reviewing the post market trading results along with this please do so. We assume our trading room subscribers review it everyday. There is often information applicable to and not included in this premarket report. You will find the post market trading result reports on our blog daily.

New Service Options: We now also offer a stand-alone trading room option now vs. bundle incl. trading room, premarket newsletter, alerts). Plans from $1.22 per day w/ promo code.

New Service Options: EPIC the Oil Algo now has an Oil Report only option vs. bundle w/ 24 hr trading room. Plans from $4.10 per day w/promo code.

New Service Options: Entry-Level trader one-on-one trade coaching and entry-level trade academy options now available in addition to intermediate / advanced trading academy and coaching.

Current Holds:

Per previous;

$CBMX, $JUNO, $DUST (looking for a way out on $DUST – was expecting one final significant spike in USDJPY before drop). $CBMX and $JUNO are holds till spring if necessary (you would have to do your own DD on the companies and make your own determination).

General Market Outlook:

Lots of width in what we are trading between now and Jan 20, 2017 (and likely at least short-term thereafter) IMO. Should be really active. My focus will be toward morning momentum plays and scalping range in $NUGT $DUST $JNUG $JDST $USLV $DSLV $UWT $DWT $UGAZ $DGAZ $TVIX $UVXY $XIV.

Per previous;

Early in 2017 I will be watching very closely bonds, $USDJPY, markets in general for direction (of course there are hundreds of variables).

Generally speaking I am looking for some volatility between now and late January. My instinct tells me that even if there is some downdraft in the markets that the Trump train will sweep them up in positive momentum at some point.

Metals, energy and financials are three areas I am looking to for 2017 for trading margin – with bio in fourth place on my list. And per previous we’re expecting some action in bonds to the upside a high probability.

As a trader, it is the margin / volatility I am focused toward and getting on the right side of a market / sector turn and scaling in to that.

Per previous;

All algos (Oil, SPY, Gold, Silver, Dollar, VIX) have hit their targets now (long term since July and short term) so we are running calculation targets for all six algos for all time charting time-frames and expect these reports to start rolling out first week of January 2017.

Morning Momo / News Bits:

Momo: $GNVC, $DFFN, $XGTI, $ROKA, $ETRM

Pluristem gains premarket as FDA OKs trial for critical limb ischemia therapy.

Ascena Retail’s stock plunges 19% premarket after earnings outlook slashed.

DexCom sees 2016 top line up 42% to $570M.

If you are new to our trading service you should review recent blog posts and at minimum our algorithm Twitter feeds because they do tell a story in terms of the market and how the inflections of the market determine our day to day trading. You will notice the algorithmic modelling has been undeniably accurate with many time-frames (intra-day, weeks and months out) so I myself have learned to respect their math (they have taken me from a 60% hit rate to 80% in my trading – all publicly posted live trades).

The algorithm Twitter feeds can be found here:$WTI (@EPICtheAlgo), $VIX (@VexatiousVIX), $SPY (@FREEDOMtheAlgo), $GLD (@ROSIEtheAlgo), $SLV (@SuperNovaAlgo), $DXY (@DXYUSD_Index). . Our lead trader Twitter feed is here @curtmelonopoly, lead developer @hundalSHS, and newest trader @quadzilla_jr.

Momentum Stocks (Market Open and Intra-Day):

I do trade morning momo stocks, but I do avoid risk – so often I avoid the first 30 minutes (gap and go) and trade momentum stocks later in the day after the wash-out looking for a snap-back. Just prior to open and shortly after open I post momentum stocks to the trade chat room (and Twitter and Stocktwits if I have time).

Some of my Favorite Set-Ups:

(1) Momentum Stock Wash-Outs for Snap Back, (2) Bad News Wash-outs on Stocks with High Institutional Ownership, (3) Getting on the Right Side of a Trend Change and scaling in my position and (4) Our Algorithm Set-Ups.

The momentum stocks (from previous days and morning trade) I continue to watch through the day for indicators that allow a trade.

Morning Stock Watch-Lists for my Favorite Set-Ups:

(1) Pre-Market Gainers Watch-List: Gainers: $GNVC 41%, $DFFN 21%, $XGTI 21%, $ROKA 18%, $ETRM 15%, $NSPR $ILMN $MSTX $VRX $UGAZ $CUDA $VICL $ARRY $VALE $RIO

I will update before market open or refer to chat room notices.

(2) Pre-market Decliners Watch-List: Losers:  I will update before market open or refer to chat room notices.

(3) Other Watch-List:

(4) Regular Algo Charting Watch-List: Gold $GC_F $GLD, Miners $GDX ($NUGT, $DUST, $JDST, $JNUG), Silver $SLV $SI_F ($USLV, $DSLV), Crude Oil FX: $USOIL $WTI ($UWTI, $DWTI, $USO, $UCO, $CL_F, $UWT, $DWT), Natural Gas $NG_F ($UGAZ, $DGAZ), S & P 500 $SPY $ES_F ($SPXL, $SPXS), US Dollar Index $DXY ($UUP), Volatility $VIX ($TVIX, $UVXY, $XIV)

(5) Upgrades:  as time allows I will update before market open or refer to chat room notices.

(6) Downgrades:  as time allows I will update before market open or refer to chat room notices.

Stay tuned in Stock Chat Room for more pre-market stocks on watch.

Study:

For new readers, a review of our unlocked posts on our blog would help you get in to the story we are following with the securities listed in this newsletter.

Free scanners to find momentum stocks that you can easily review charts of for indicators that bring probability of your trade being successful up considerably. These are not useful for first 30 minute market open gap and go type plays (you need a good momentum scanner, level 2, and best to have hot-keys for the first 30 mins of gap and go trading)… but are very useful for intra day scalping and swing trading (start with trending stocks and then look at indicators intra for simple set-ups – study scan study scan study scan).

http://finviz.com/

https://finance.yahoo.com/screener/predefined/ec5bebb9-b7b2-4474-9e5c-3e258b61cbe6

http://www.highshortinterest.com/

http://www.gurufocus.com/short-stocks.php

http://www.3xetf.com/all/

http://www.etf.com/channels/gold-etfs

GL!

Curtis

Article Topics: $GNVC, $DFFN, $XGTI, $ROKA, $ETRM, $UGAZ, $DGAZ, $NUGT, $DUST, $USLV, $DSLV, $UWT, $DWT, $JNUG, $JDST, Stockmarket, Pre-Market, Trading Plan, Wall Street, Stocks, Day-trading, Watchlist, Chatroom, $CBMX, $JUNO, $GLD, $GOLD, $SILVER, $USD/JPY, $USOIL, $WTI, $VIX, $SPY, $NATGASUSD, $NG_F, $SLV, $GLD, $DXY, $XAUUSD, $GC_F

Read More
Member Oil Trade Update Tues Jan 10 Charting Algo FX: $USOIL $WTIC – $USO $CL_F $UWT $DWT $UCO $SCO $ERX $ERY $GUSH $DRIP

Member Oil Trade Update Tues Jan 10 Charting Algo FX: $USOIL $WTIC – $USO $CL_F $UWT $DWT $UCO $SCO $ERX $ERY $GUSH $DRIP

January 10, 2017January 18, 2017 Epic the AlgoCrude Oil Trading Algorithm (EPIC)$CL_F, $DRIP, $ERX, $ERY, $GUSH, $UCO, $USO, $UWT, Algo, Algorithm, Chart, Crude Oil FX: $USOIL $WTI, DWT, EPIC the Oil Algo, Fibonacci, Indicators, Targets, Trading Room

Tuesday Jan 10, 2017 EPIC the Oil Algo Oil Report (Member Edition). FX: $USOIL $WTIC – $USO $CL_F $UWT $DWT $UCO $SCO $ERX $ERY $GUSH $DRIP

Welcome to my new FX: $USOIL $WTI oil trade report. My name is EPIC the Oil Algo.

NOTICES:

CHARTING: The last number of posts  have been warning of an imminent price decision – it came today – more information below.

Per previous – There is a significant decision in price coming – watch notices close over coming days! And see below a very important diagonal trend-line resistance is on deck also!

NEW SERVICE OPTIONS: We now also offer a stand-alone trading room option vs. bundle (incl. trading room, premarket newsletter, alerts). Plans from $1.22 per day w/promo code.

NEW SERVICE OPTIONS: EPIC the Oil Algo now has an Oil Report only option vs. bundle w/ 24 hr trading room. Plans from $4.10 per day w/promo code.

MUST READ: There is a feature blog post at this link, “Why our Stock Algorithms are Different than Most“. If you are viewing our algorithmic model charting it is a must read.

MULTI-USERS: Institutional / commercial platform now available.

PATENT PHASE: I am now in patent application phase. Stay tuned for agreements concerning disclosure and use coming to members.

24 HOUR TRADE ROOM: My charting transitions from FX $USOIL $WTI to 24hr crude oil futures early 2017. My sub service w incl 24 hr crude oil trade room.

ACCESS: My proprietary services transitioned recently from public inaugural to subscriber only access. All rates for existing members for all service prices (including price increases) will be grandfathered in perpetuity (view website products page for conditions). Early 2017 when my 24 hour futures trading room opens along with 24 hour live charting I will have a rate increase but as with recent the roll-over existing members will be grandfathered at locked-in current rates.

SOFTWARE: My algorithmic charting is going to developer coding phase early 2017 for our trader’s dashboard program. Please review my algorithm development process and about my oil algorithm story on our website www.compoundtrading.com and my oil algo charting posts on my Twitter feed and this blog.

HOW MY ALGORITHM WORKS: I am an algorithm in development. My math is based on traditional indicators (up to fifty at any given time each weighted on win ratio merit – all not shown on chart at any given time) – such as simple math calculations relating to price and volume, Fibonacci, simple pivots, moving averages, Gann, Schiff and various other charting, geometric and mathematical factors. I do not yet have AI or Geo Political integration – only math as it relates to traditional indicators with the primary goal being probabilities. I am not a high frequency or bot type algorithm – I am represented on and used on a traditional trading chart as one would normally use as a probability indicator. The goal is to provide our trader’s with an edge when triggering entries and exits on trades with instruments that rely on the price of crude oil (specifically FX: $USOIL $WTI and transitioning to futures in the new year in our new 24 hour oil trading room).

Below you will find my simplified view of levels that can be used on a traditional chart (both intra-day and as a swing trader or investor). This work, and subsequent trading, should be considered one decision at a time, “if this happens then this or this are my targets”… price – trigger – trade and so on. Questions to; [email protected], message our lead trader on Twitter, or message a lead trader privately in the trade room.

EVERY CALL WE MAKE, EVERY PUBLIC INTERACTION, REPRESENTATION OF TRADE (ON EVERY VENUE) IS VIDEO RECORDED (TRADING ROOM), ON SOCIAL MEDIA OR ON BLOG / WEBSITE TIME-STAMPED FOR PERMANENT RECORD AND ABSOLUTE TRANSPARENCY. PLEASE ALSO REFER TO OUR PUBLIC DISCLOSURE https://compoundtrading.com/disclosure-disclaimer/.

FX: $USOIL $WTI Observations:

Below is the link for the live EPIC the Oil Algo Live Trading Chart for Tuesday Jan 10, 2017.

https://www.tradingview.com/chart/USOIL/FHlK0G4T-EPIC-the-Oil-Algo-Oil-Chart-Member-Edition-FX-USOIL-WTIC/

Intra-day Crude Oil Trading Range: At time of writing FX $USOIL $WTI is trading at 52.16 at 414 AM ET Jan 10, 2016. Some thoughts with respect to traditional charting that may help advance the trading edge:

Crude has fallen outside of the uptrend channel and in overnight trade has bounced off a horizontal support. While we recalculate based on new trading price action do your best to ignore the varoius Fibonacci levels etc on these charts and focus on the main support and resistance areas (yellow lines and blue diagonal trendlines) and trade against those margins (white arrows). More specific algorithmic modeling to follow over the next few days.

$USOIL, Chart
Crude algo intra work sheet 414 AM Jan 10 FX $USOIL $WTIC #OIL $CL_F CL $USO $UCO $SCO $UWT $DWT #OOTT

Multi Week Trading Range for Swing Trading:

Note: Be careful with the prices you see in the purple boxes on the right of the chart – they do not line up on chart for price action (they are for indicators).

As mentioned above and warned, the price has dropped out of the channel – trade the ranges per above.

Per yesterday;

The trading range is still intact, however, BE VERY CAUTIOUS AS OIL IS TRADING VERY NEAR KEY RESISTANCE, THE OUTSIDE OF THE UPWARD TRENDING CHANNEL AND THE END OF NUMEROUS TIME PRICE CYCLES.

Per Previous;

The trading price is getting really close to having to make a decision now. Either up over significant resistance or sideways or drop out of the upward trending channel. Our bias is up over resistance because a. the trend is your friend and b. until we reach the incoming down-trending diagonal trend-lines (blue) from previous time – cycles, you will see on charting below. However, you need to be ready for both scenarios.

Pay attention to the upward trending channel – you can enter long and sell in between the channel yellow lines as it trends. If price stays below the resistance then you trade the channel under that and if above a major support line same thing (yellow lines).

Price is currently trading above a horizontal support at 51.93 (yellow line) – watch this for support. Resistance is at 54.39. Review charts over the previous week on my blog to see yellow support and resistance lines and channel that I refer to.

Refer to my previous posts re: Green arrows on chart (show on previous posts) are highest probability trade entries for short or long positions – while crude is trading in upward channel (like it is) your probability is always higher going long until channel broken. Trading at outside of channel increases probability of success also.

Diagonal Trend Lines:

Diagonal trend-lines (blue). Diagonal trend-lines are critical inflection points. Please review many of my recent posts so you can learn about how important these diagonal trend-lines are. If one is breached you can look to pull-back to next diagonal blue trend line about 90% of the time. Also pay attention to how thick the lines are – the thicker the line the more important because they represent extensions from previous time / price cycles.

Remember you can come in to the chat room to message the trader and REMEMBER I have posted a live chart link earlier in this post so if you can’t see the lines well on this chart above you can go to the live chart link and watch for member live algo chart links through-out the day in your email inbox!

I am going to leave the commentary below in my reports for the short-term to show and be sure (if crude price rises) that traders are aware of the significant resistance over-head, but it also serves as a reminder (lesson) that when price is getting within significant resistance such as below that significant downdrafts in price action are likely as we say in Monday trade.

Per previous;

The diagonal trend-line in this chart is very important. In fact, so much so that our traders will aggressively short at these trend-lines (with tight stops of course) – because this is a trend-line from another time-cycle – a significant trend-line. Keep in mind, that with charting, especially when bringing trend-lines in from many previous time-cycles such as this that it won’t be exactly on the penny – so watch close here.

There is also a symmetrical resistance and support line below it (yellow). If crude trade rises above this trend-line you can expect at least nine times out of ten a new break-out in crude oil trading price.

All recent major up-trends in crude trading (last two years) have used these diagonal trendlines lines as support (or alternatively as resistance sending crude down in a new trading trend lower). Very, very important line to watch.

56.93 is significant resistance with diagonal trend-line. Crude algo intra work sheet 758 PM Jan 2, 17 FX $USOIL $WTI #OIL $USO $UWT $DWT $CL_F #OOTT #Algo

Resistance, Oil , Chart
56.93 is significant resistance with diagonal trend-line. Crude algo intra work sheet 758 PM Jan 2, 17 FX $USOIL $WTI #OIL $USO $UWT $DWT $CL_F #OOTT #Algo

Price Action with 20, 50, 100, 200 MA

It is wise to study how the 20, 50, 100, 200 MA trade on each time-frame before trading oil related instruments. Below are a few examples.

Below is how oil has been trading with 20 MA on the 4 hour chart – fairly predictable buy / sell triggers. It is preferable to sell at the top of the move if you can time it and not wait for the 20 MA to trigger to downside. While crude is trading under 20 MA advantage is to short side and over advantage to long side. Keep in mind while trade remains in upward trending channel like it is now short side probability is lower than it would be otherwise.

Chart below shows what happened when 20 MA was lost in Monday trade. Previous reports have examined other MA’s for buy and sell triggers FYI.

Crude trading well below 20 MA on 4 Hour. Crude algo intra work sheet 430 AM Jan 10 FX $USOIL $WTIC #OIL $CL_F CL $USO $UCO $SCO $UWT $DWT #OOTT

20 MA, $USOIL,, Chart
Crude trading well below 20 MA on 4 Hour. Crude algo intra work sheet 430 AM Jan 10 FX $USOIL $WTIC #OIL $CL_F CL $USO $UCO $SCO $UWT $DWT #OOTT

Per previous;

With the trading price of oil up at key resistance the 20 MA has been challenged more and more. Red arrow below shows an example of what can occur when 20 MA lost with crude oil. As of time of writing 20 MA intact.

Crude oil, 20 MA, Chart
20 MA vs price. Crude algo intra work sheet 442 PM Jan 8 FX $USOIL $WTIC #OIL $CL_F CL $USO $UCO $SCO $UWT $DWT #OOTT

Fibonacci Levels:

Watch these lines for support and resistance. Careful using them as traditional retracement levels with crude because the algo lines etc are more dominant / predictable. But the Fib lines are excellent indicators for intra-day trade support and resistance.

There are fib levels on the chart below. We are currently running calculations with our modeling on how fib levels relate to our targets and trade levels – so our fib charts may look at times more like mad science than anything.

When you get a feel for how the fib levels reflect intra trading (which we cannot explain in short here) you will always have them on your chart in a similar manner.

$USOIL, Chart
Crude algo intra work sheet 414 AM Jan 10 FX $USOIL $WTIC #OIL $CL_F CL $USO $UCO $SCO $UWT $DWT #OOTT

Horizontal Trend-Lines (purple):

Horizontal trend-lines are not as important as the other indicators reviewed above, however, they do serve as important resistance and support intra-day for tight trading and they are important if thick (in other words they come from previous time / price cycles). WE STARTED TO REPRESENT THE REALLY IMPORTANT LINES IN YELLOW FYI FOR EASE. Refer to chart for current applicable horizontal trend-lines.

Advanced Charting:

Respect support and resistance lines: If you can be patient and take your long and short positions against these yellow lines – that is your highest probability trading.

You will see a lot of noise on the charts over the next few weeks (algorithmic calculations of various types). Try and ignore for now.

Oil Time / Price Cycles:

Per warning in yesterday report;

Between now and Jan 15 there are a series (cluster) of time price cycles terminating – so much that we see a significant move in the price of crude oil either up or down very soon. Any moment.

New time / price cycle calculations are underway and will take a day or two analyzing intraday trade now that price is outside of the upward trending channel.

Time / price cycles are the single most important indicator and my record calling them is near 100% – since inception seven months ago. The reason they are so important is that a trader does not want to be holding a crude oil instrument at termination of a time cycle if not absolutely sure if price will go up or down. A trade may choose to enter a large position in advance of a time price cycle termination IF THERE IS A HIGH PROBABILITY OF A DIRECTION IN PRICE and if the market is trading at a really important pivot area. In other words, if the market is trading at the bottom of the upward trending channel at a support (yellow lines) and we knew there was a significant probability of a time cycle about to terminate a trader may enter with a long position. The price really spikes or drops significantly when these important time cycles terminate.

The problem with time / price cycle terminations is they change from minute to minute (depending on where price is on the chart) so you have to be in the trade room to get the alert. Our lead traders will do everything they can in future to send these on SMS but we have to be careful because it can be difficult with so much going on in the room. The reason they (time cycles) change is because they are actually represented by or are geometric shapes in the chart – I know it sounds odd but I have (as I mentioned) hit these calls just shy of 100%. The oil political people know the same algorithmic modeling principles and they ALWAYS TIME THEIR BIG ANNOUNCEMENTS AROUND THE TIME PRICE CYCLE TERMINATIONS.

So if you can picture a triangle on the chart – and price is trading in the triangle – and price is going to come to the edge of the triangle and there is a significant support or resistance or an algo line terminating there too or a target (those type of indications)… then we know there is a high probability of a time and price change. In other words, it is where there are clusters of algorithm points that cross and when price is going to cross over that cluster is where they are. And these are represented on all the different time frames – the larger the time frame – the larger the time price cycle termination – the larger the spike or downdraft. This is where we establish our intra-day quadrants from for sniping trades (which we will put in to the room soon because it looks like the geo political rhetoric is over for a while making them more predictable). Difficult to explain in short. So we will do our best to SMS alert these in future.

Also, the real large or important time / price cycle terminations we know far in advance and they can be put in these newsletters.

If you review my Epic the Oil Algo Twitter feed, my blog posts and my story on our website you will get a feel for how accurate these calls are.

Alpha Algo Trading Trend-Lines (Red dotted lines):

To determine which algo line is most alpha (or probable) intra day, it is the nearest line to price action. This can also help you determine the trend of trade. If the algo line is trending up the price will follow it up until price is tested at an algorithm indicator (the main tests are diagonal trendlines, horizontal trendlines, time / price cycles etc – as I have shared with you). This is why it is important to watch all the lines because they are all support and resistance. To keep it simple trade the range (yellow lines) as I’ve mentioned but keep an eye on these indicators.

Current Alpha Algo Targets (Red circles):

THE TARGETS BELOW ARE NOW VOID – as explained above it will take a few days of calculating to reset algorithm with new targets and trading ranges.

Per yesterday warning;

The targets below are VERY LIKELY to change as we are expecting a volatile move in oil within days (before Jan 15, 2017). WE WILL UPDATE MEMBERS WHEN THIS OCCURS.

Your closest target that crude is trending toward is always the most probable. Crude is currently trending toward a target (red circles on chart) Then, your second most probable is the one that is up or down trend depending on whether general price is in an upward or downtrend for the most recent week or so and what your other indicators look like (such as the MA’s I explained above).

This week alpha algo targets are as follows (with associated hit probability – how many times out of 100 a hit is expected): 

Tuesday 4:30 PM EST – 53.07 (53%), 55.75 (24%), 57.01 (3%)

Wednesday 10:30 AM EST – 53.20 (41%), 55.95 (21%), 57.23 (1%)

Friday 1:00 PM EST – 53.62 (15%), 56.52 (9%), 57.81 (0.5%)

The other way to determine which targets are in play is actually quite simple, you will notice that crude trades between the channel lines up and down and up and down and there are various support and resistance along the way. If it hits a target at the top of the channel you can bet most times (unless the next day like today) that the next target hit will be at the bottom of the channel or whatever – also difficult to explain – WE ARE DOING A VERY DETAILED VIDEO ON THESE INDICATORS SOON THAT WILL SHOW IN MORE DETAIL.

The targets for this week are represented on the chart. Again, refer to the live charting I send you for this also or be in the trading room.

Wait for the price to trend toward a target and take your position and watch as price gets closer and closer to the target. Remember, that the machines trade from decision to decision – or in other words from support to next resistance or resistance to next support or when the times come each week on Tuesday Wednesday and Friday they will trend toward the target that market price action determines they go to.

Our lead trader will explain more in the room and do not hesitate to ask our lead trader in the room by private message or on twitter to explain intra day decisions.

Oil Intra-Day Algo Trading Quadrants:

Processing now for release soon (you are seeing the beginning of them above in charts now) – I don’t think there are any real tight crude related snipers beyond our lead trader right now anyway – but nonetheless, we are getting these out – they take a lot of data processing to say the least. We’re almost there.

Indicator Methods:

As explained above, my algorithm is a consideration of up to fifty traditional indicators at any one time – each one given its own weight in accordance to its accuracy (win rate). This is how we establish the probability of specific targets hitting (we call them alpha algo targets).

Alpha Algo Targets, Algo Trend-lines, Algo Timing, Quadrants for Intra Snipes:

Algo targets are the red circles – they correspond with important times each week in oil reporting land. Tuesday 4:30 PM, Wednesday 10:30 AM and Friday at 1:00 PM. The red dotted diagonal lines are the algo trend-lines. And the vertical dotted (red or green) are marking the important times each week. You will find that the price of crude will hit one of the alpha algo targets about 90% of the time. In the absence of market direction the machines take price to the next algo line and/or target. Understanding how the price of crude reacts to the algos and how they move price from target to target is critical for intra-day and swing trading crude oil and associated instruments.

You will notice that price action of crude will use these algo trend-lines and act as support and resistance, and that price also often violently moves when an alpha algo line is breached either upward or downward.

We cover this in much more detail in the member updates, trading room. A review of my Twitter feed and previous blog posts will help you understand the relation of these indicators. We will start posting video blogs (for my subscribers) on YouTube (in addition to my daily blog posts) for swing traders that work during regular trading hours.

Also… we will cover how to establish algo trend-lines and price targets future forward (as you have seen me do on my Twitter feed for some time now).

Conclusion:

That is a good place to leave it for now – we will review details of the above in the trading room and when time allows we will segment for our swing traders (and publish) videos of the work we do in the trading room.

For now, trade the ranges described above and new algorithmic modeling will be out in the next few days.

See you in the live trade room! And again, if you struggle to know how to use these indicators as a trader’s edge, it is recommended (if you have earnestly reviewed all of our documentation first) that you obtain private coaching prior to trading a real account with real money – we recommend you use a paper trading account at first. And finally, we will be publishing a “how to use guide” soon, but it will be simply be a recap (consolidation) of instructions in this post, from my Twitter feed, and previously published information on our blog and website. You can also send specific questions to our email inbox at [email protected] – if you do this be sure to ask a specific question so it can be answered specifically. When the 24 hour oil trading room opens you will have ample opportunity in that 24 hour room to ask questions also.

Watch my EPIC the Oil Algo Twitter feed for intra day notices and your email in box for member only material intra day also.

EPIC the Oil Algo

PS If you are not yet reviewing the daily post market trading results blog posts, please do so, they are on the blog daily and often there is information that also may assist your trading. Trade room transcripts (for example) may review topics pertinent to your trading.

https://twitter.com/EPICtheAlgo/status/811327478845218816

Article topics: EPIC the Oil Algo, Crude Oil FX: $USOIL $WTI, $USO, $UCO, $CL_F, $UWT, $DWT, $ERX, $ERY, $GUSH, $DRIP, Chart, Algorithm, Indicators, Trading Room, Fibonacci, Algo, Targets

Read More

Posts navigation

Older posts
Newer posts
Proudly powered by WordPress | Theme: sharksdesign by reviewexchanger.
 

Loading Comments...