Good morning traders!
In lieu of algorithmic model charting we opted to run simple charts in the lab last evening because the machines (as far as it applies to our work) may as well of shut down at around 4:30 EST yesterday. Why? Oil, black gold caused everything we model to skew. So there’s no reason to run updates until tonight, and it doesn’t hurt to take a simple look at our charts once in a while.
So I already posted most of this to my personal twitter feed but some of our members either don’t use Twitter or would prefer data in a file / blog format. On my Twitter feed are other simple charts and links to live charting FYI.
We’ll return to algorithmic modeling charts this evening for tomorrow’s open and in the meantime we’ve unlocked this for the general public also because there is obviously no proprietary data involved.
Have a great day and keep it simple until the market sorts this one out. Below are our simple charting thoughts.
Simple Chart Updates for Feb 8, 2017 for Compound Trading.
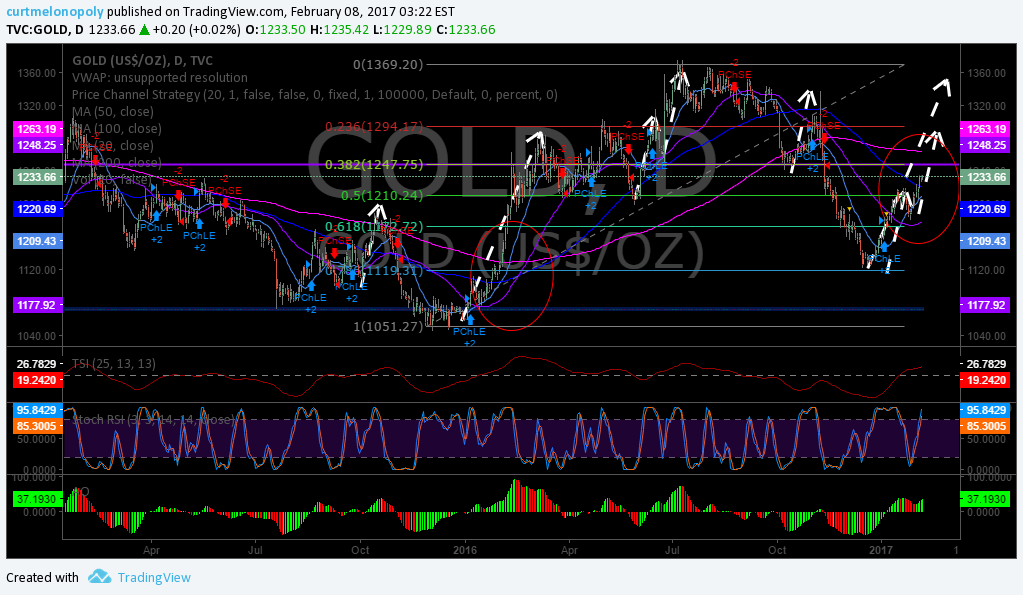
Gold. Simple chart perspective. $GLD $XAUUSD $GC_F $DGLD $UGLD

Two red circles – 20 MA crossed 50 MA. 20 near to cross 100 MA. Purple horizontal – Decent resistance 1248.00 area.
Stoch RSI revved. But stayed revved during upswing in Jan 2016. OA looks almost identical to Jan 16 as does the TSI. #GOLD
Simple symmetry (white arrows) says 1289.00-1349.00 ish is extension. 200 MA 1264.84 intra – historical res at times. #GOLD
Gold. Simple Fibonacci says 1247.75 is 382 resistance. $GLD $XAUUSD $GC_F $DGLD $UGLD #GOLD
@ROSIEtheAlgo has resistance areas similar. Should be interesting. Jury is out imo.

Gold MACD. Gold vs. USDJPY. USDJPY 200 MA. $GLD $XAUUSD $GC_F $DGLD $UGLD #GOLD $USDJPY
MACD has a lot of RPM available.

GOLD Ground hog year? Same dates. $GLD $XAUUSD $GC_F $DGLD $UGLD #GOLD

US Dollar Index $DXY I wonder if Trump has seen this chart? $UUP

Kinda the elephant in the room no? US Dollar Index $DXY $UUP

US Dollar Index $DXY $UUP with #GOLD – See no evil, hear no evil… $GLD $XAUUSD $GC_F $DGLD $UGLD $GDX

US Dollar Index $DXY Houston! We have… gone… d i v e r g e n t.? I’m sure it will sort itself out… $UUP

We found Gold Gump or wrong road? I’m sure its nothing.

Crude Oil. MACD crossed back up but… 20 50 MA and 52.00 – 52.20 area resistance. $USOIL $WTIC #OIL $CL_F $USO $UCO $SCO $UWT $DWT #OOTT
Could pull itself back out of dungeon but I’d wait for 20 50 cross and 52.20.

$SPY I know its the obvious…. but where’s the volume and can this trajectory be healthy no QE and the MACD hmm Suspicious chart IMO #alien

$SPY Should we not be returning to that 200 MA sometime? Soon? And again, that MACD.

So simple my bulldog could do it. Until its not. Long at the arrows.

$SPY Long at the green arrow short at the red arrow. Hows the MACD doing now?

$VIX The 50 100 200 MA seem reasonable targets if it ever again gets lift. MACD says aliens have taken over. Just saying. Very odd.

$VIX I know its the obvious, but may want to long at the green and short at the red. $TVIX $UVXY $VIX $VXX

Hope that helps you center in your trades – at least for our coverage!
Cheers!
Curtis
Article Topics: $SPY, $VIX, US Dollar, Volatility, $DXY, Gold, $GLD, Silver, $SLV, $WTI, $USOIL, Oil, Stocks, Trading, Market, Update
