Rosie the Gold Algorithm Model Charting Update Monday Mar 19, 2018 #GOLD $GC_F $XAUUSD $GLD, $UGLD, $DGLD with Gold Miner Observations: $GDX, $GDXJ ($NUGT, $DUST, $JDST, $JNUG)
Good day! My name is Rosie the Gold Algo. Welcome to my new member edition Gold trade report for Compound Trading.
Like EPIC our Oil Algorithm chart model, I am an algorithm chart model in development and trader testing for coding phase to be used as an intelligent assistant for our traders (not HFT). My charting model is specifically suitable for the use and purpose of Gold and Gold Miner related.
The charting models are best used decision to decision. In other words, each line on the algorithmic model charts are support and resistance. As trade progresses, weighing algorithmic charting model against conventional charting observations provides an edge over using only conventional charts.
If you need assistance at anytime contact my developers at info@compoundtrading.com.
Updates:
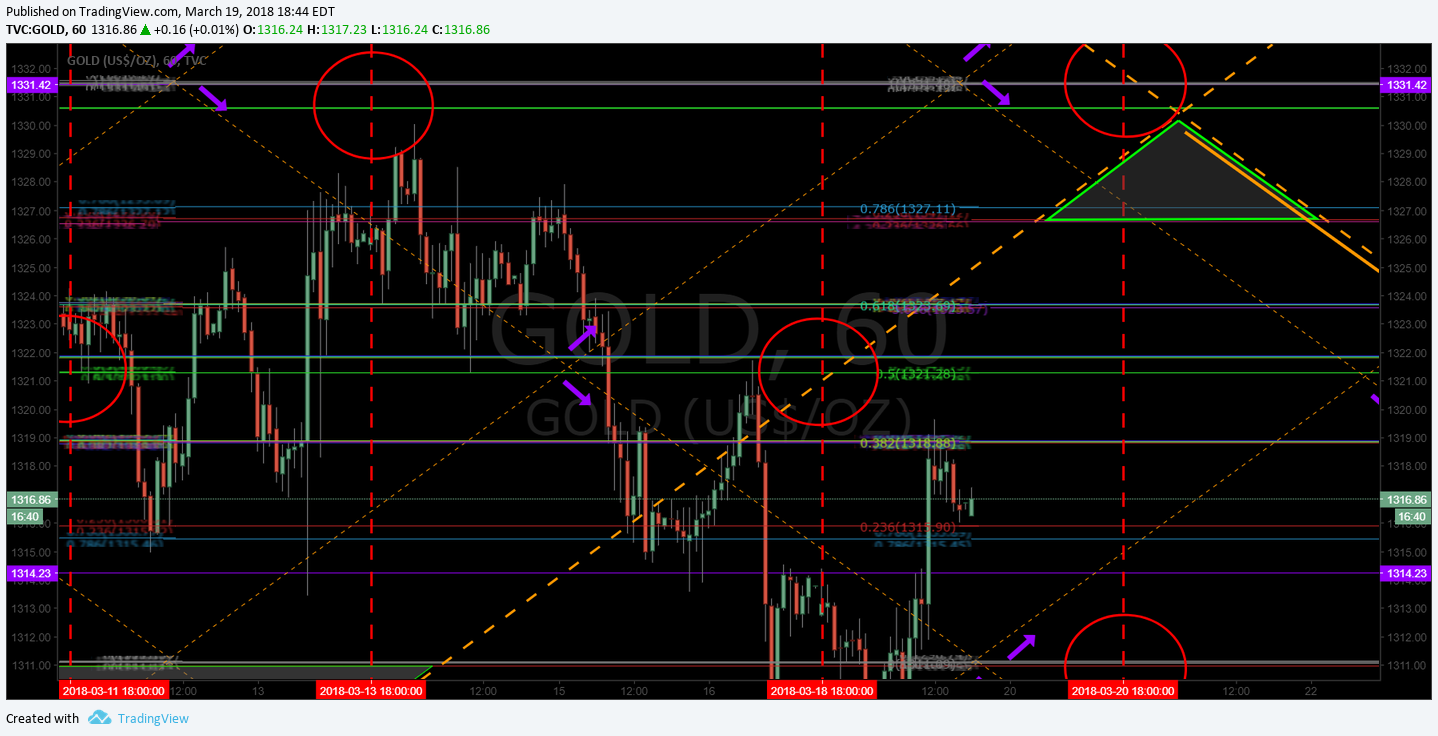
The charting below for Gold now has prospective channel support and resistance, considerable wider time frame quad walls highlighted (thicker orange dotted lines) and key channel direction decision areas noted with purple arrows.
How to Use the Charting Model:
How to Use ROSIE Gold Algorithm: #GOLD, $GLD, $XAUUSD, $GDX, $GDXJ, $NUGT, $DUST, $JNUG, $JDST
Gold / Gold Miner Trade Coaching
Users of this algorithm model charting may opt for private one-on-one coaching with our lead trader and / or an experienced trader that has worked under our lead trader.
On our website there are standard one-on-one online coaching packages you can order (coaching via Skype) or you can request a customized package (reflecting the time you are wanting to invest in your learning).
To request a custom package most suited to your needs email us at info@compoundtrading.com or click here for a standard private trade coaching package. Other options for coaching include online webinars for members (from time to time), private on location and in-person coaching sessions at our new trading location(s) and organized trading conference events.
Primary Trade Indications:
Live Twitter Alert Feed for Gold / Miner Trades: @GoldAlerts_CT
Gold Trade Buy / Sell Short Term Swing Triggers
For short term trading the following are support and resistance areas for trade that can be used as buy / sell triggers for Gold.
1300.96
1311.07
1321.30
1331.51
1341.61
1351.86
1362.03
1372.72
1383.43
1384.79
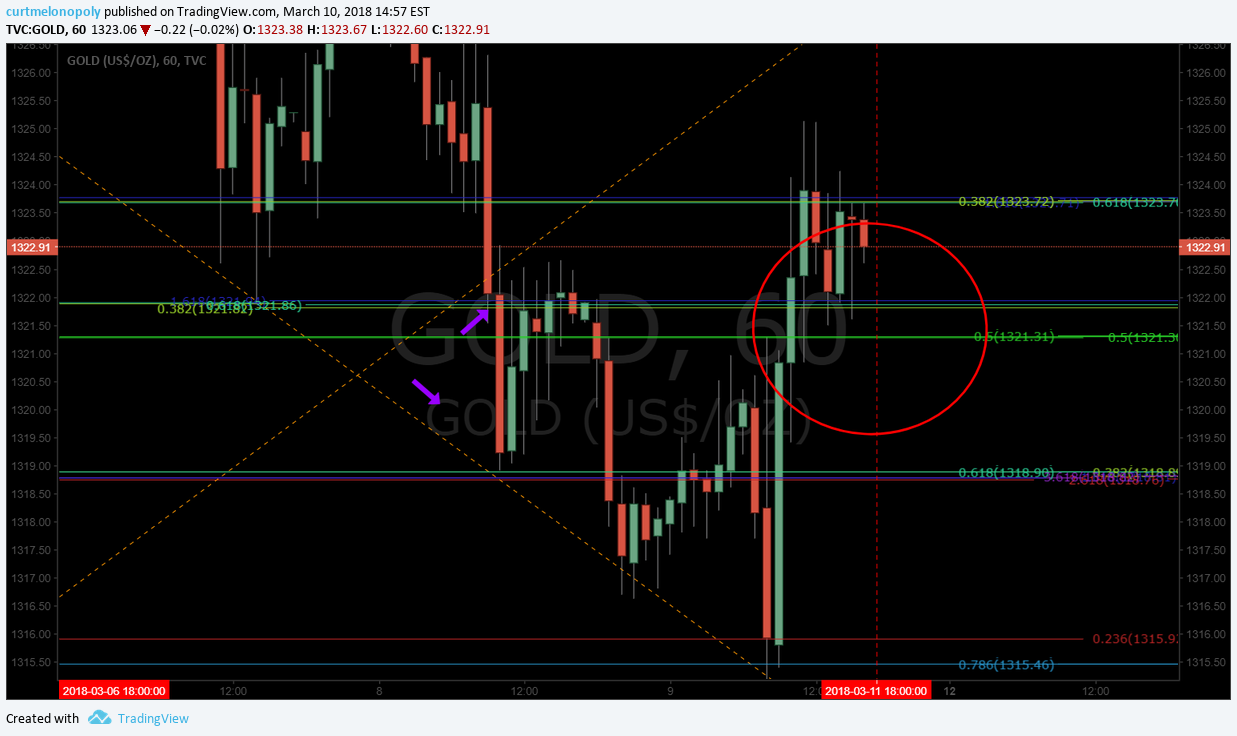
The primary method of trade our traders are reporting works with the most predictability is to wait for Gold to breach the trading range (grey lines marked with arrows) up or down and then have it confirm as it leaves the corresponding trading quadrant to the up or downside. See video above.
As it is a model in development, if you find more predictable methods please report same.
Resistance and Support Clusters: Blue and Yellow horizontal (may be sloped) lines (marked with arrows). The thicker they are the more significant they are. Blue are conventional indicators and Yellow are calculated historical algorithmic points of significance. If the cluster is significant our charting techs will shade the area in white to bring this to your attention. The most recent cluster has proven to be significant resistance in recent trade.
Trading Range: Grey Lines (marked with grey arrows). Trade above or below creates bias and bias is confirmed to a high probability when trade then leaves a quadrant (geometric diamond shape formed with diagonal Fib trend lines for time – frame) after gaining or losing a trading range horizontal support / resistance line (grey horizontal line).
Quadrants: Diagonal Orange Lines that form diamond shapes. Based on diagonal Fibonacci trend lines act as important support and resistance. The wider the time frame the thicker the line.
Channel Decisions: Purple arrows note critical uptrend and downtrend channel decisions.
Fibonacci Support and Resistance: Horizontal lines on charting (various colors).
Targets: Red circles on charting. The least of the indicators and should be used for observation purpose only. The targets are in very early stage development / testing. Two are provided for each quadrant time frame – the upper scenario targets should be considered if trend is up and likewise for the lower. Only either are expected to hit (if at all – very low probability of a hit is expected at this point).
Conventional Charting: All decisions should be weighed against conventional charting (as may be provided below also).
Gold Algorithm Live Charting Link: Click on share button bottom right (beside flag) and then click on “Make it Mine”.
Gold Live Chart Link Mar 19, 2018:
Rosie Gold Algorithm Chart Model – Current trading area. Mar 19 645 PM #Gold $GLD $GC_F $XAUUSD $NUGT $DUST

Rosie Gold Algorithm Chart Model – Up trend channel scenario. Mar 19 634 PM #Gold $GLD $GC_F $XAUUSD $NUGT $DUST

Rosie Gold Algorithm Chart Model – Down trend channel scenario. Mar 19 630 PM #Gold $GLD $GC_F $XAUUSD $NUGT $DUST

Conventional Charting Considerations:
Gold failed 50 MA test last week, targets in play. Chart notes. – $GOLD chart
Targets are in play and a decision should be made soon now for broader directional trade in to the targets.
Will update as the trade plays out. Per the Gold -0.07% member report there is a significant time price cycle peak Mar 21 at 3:00 AM so I suspect the near term trend decision will come out the other side of that time price cycle peak.

Per recent;
Gold under 50 MA coming in to compressed part of quad – targets in play. $XAUUSD #Gold $GLD $GC_F
Gold against underside of 50 MA on Daily Chart. Decision coming… $XAUUSD #Gold $GLD $GC_F

Per recent;
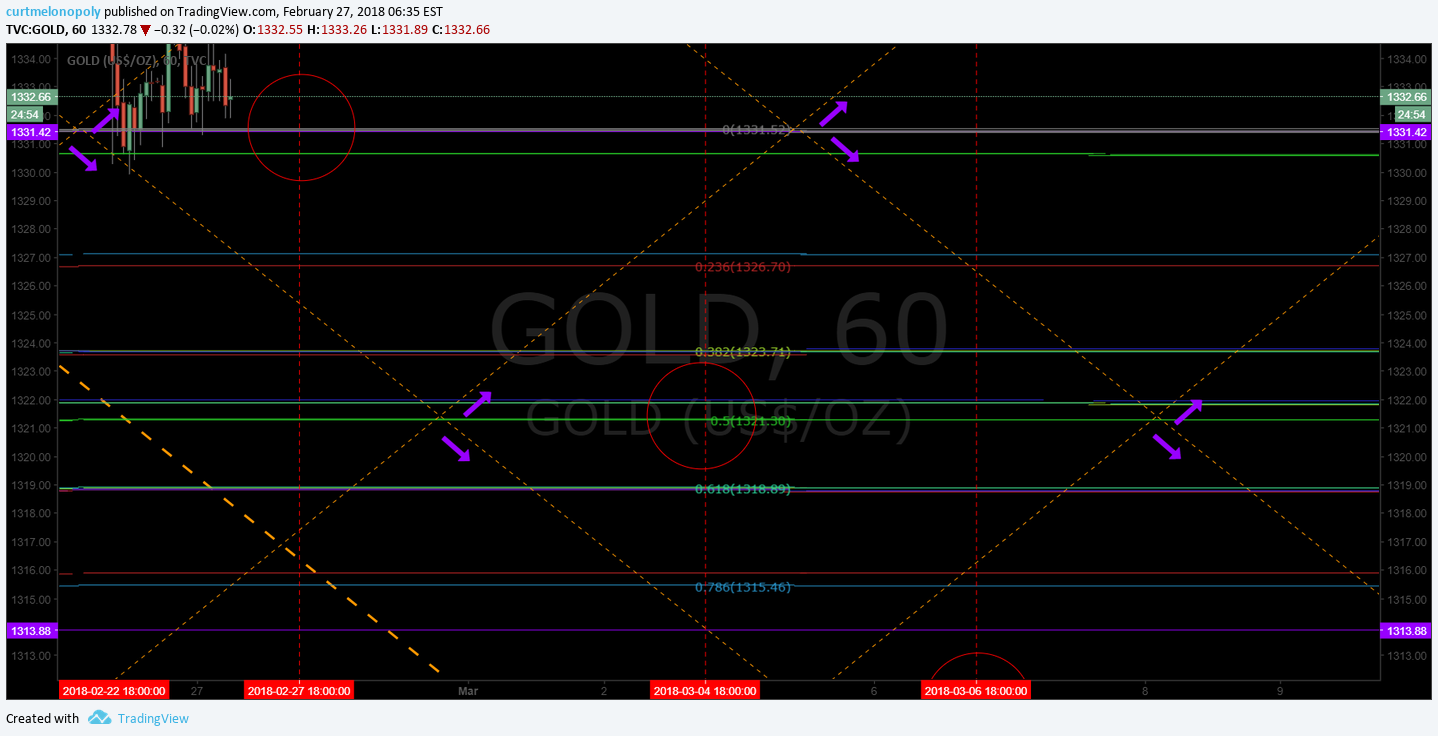
Feb 27 – Gold trade continues to form a consolidated bull flag – the previous charting below does not need to be updated as there is not change to the formation / pattern.
Conventional Gold charting puts 1386.00 in play for May 4, 2018 – highly probable.

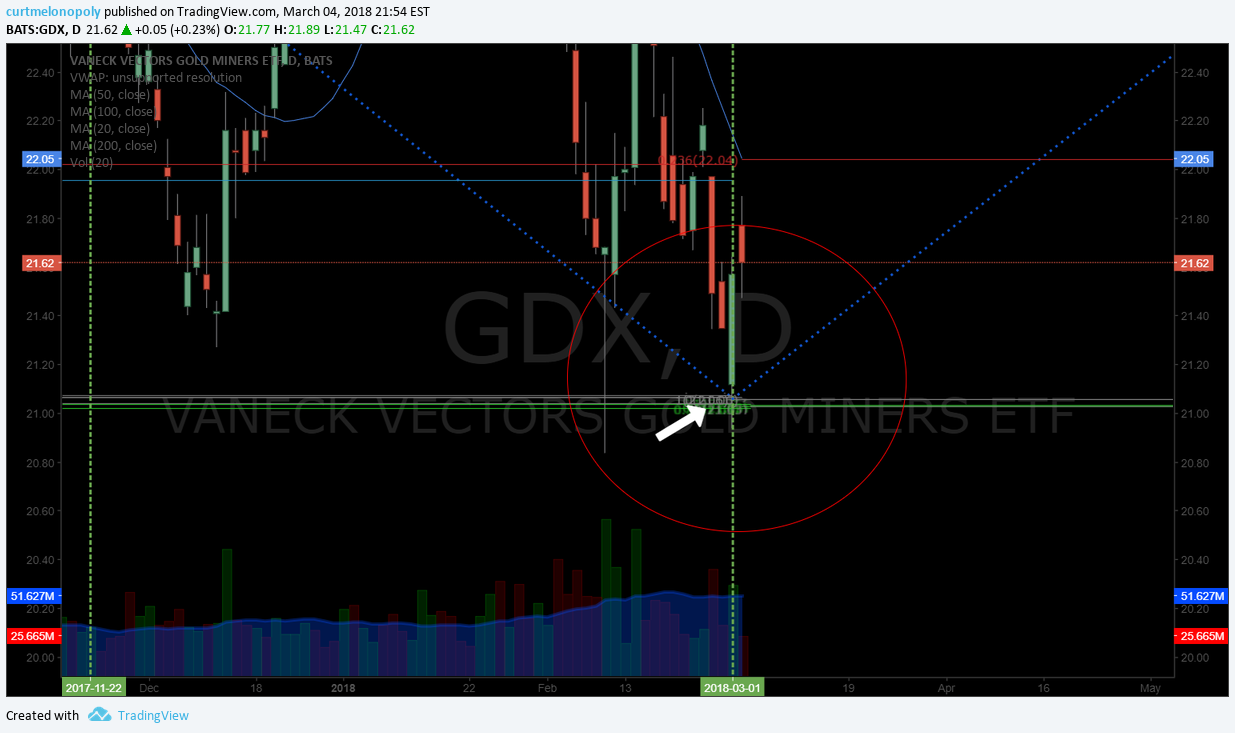
Gold Miner $GDX:
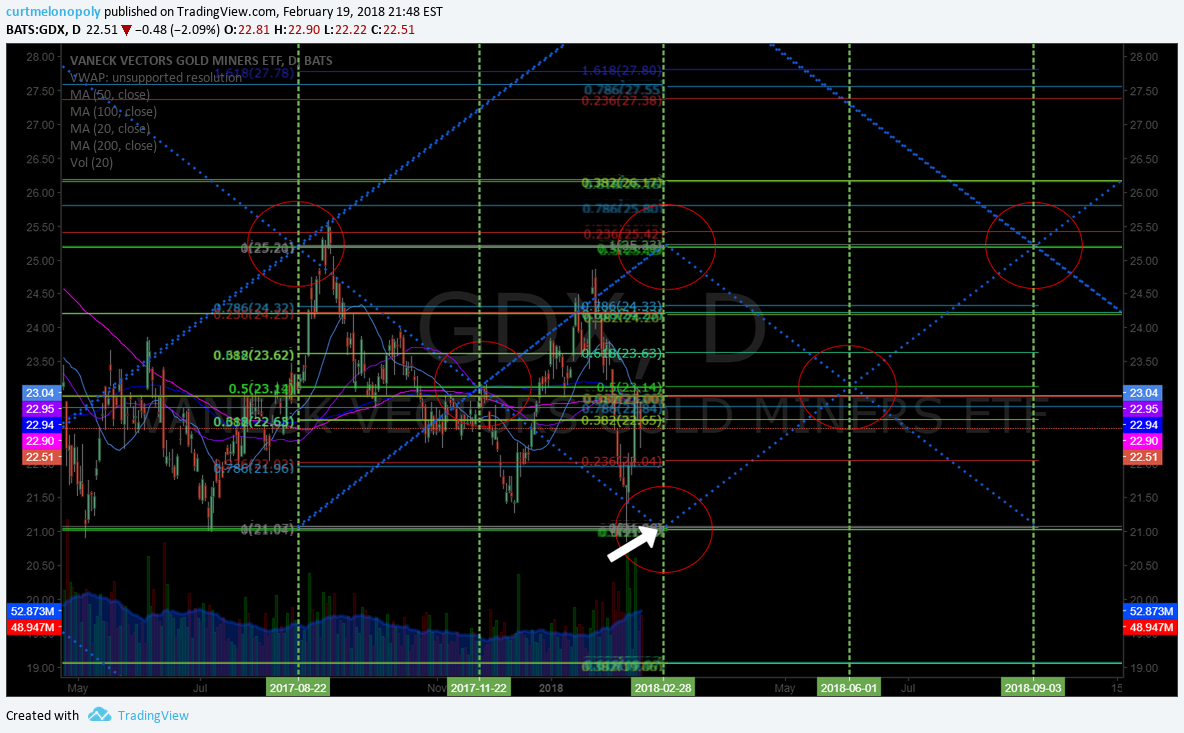
Gold Miners $GDX break down of recent monthly lows possible here in to lower target. $NUGT $DUST $JDST $JNUG

$GDX Gold Miner PT in play – price above 21.06 targets 2315 below 21.06 targets 18.90 June 4. $NUGT $DUST $JDST $JNUG

Per recent;
$GDX Gold Miner price above 21.06 targets 2315 and below 21.06 targets 18.90 June 4. $NUGT $DUST $JDST $JNUG

$GDX Gold Miner perfect hit to price time target published to reports weeks prior. $NUGT $DUST $JDST $JNUG

Per recent;
$GDX miner price path of least resistance is 21.00 on Feb 28. $NUGT $DUST $JNUG $JDST #Gold

Per recent;
$GDX miner trade somehow held the all important support area on the chart again. $NUGT $DUST $JNUG $JDST

Gold Price Targets:
Gold price target 1800 Sun lined up to price target time and price provided on report 6 days prior. $GC_F $GLD $XAUUSD $DUST $NUGT

Per recent;
Gold price target 1800 Mar 4 hit perfect to time and price provided on report 6 days prior. $GC_F $GLD $XAUUSD $DUST $NUGT

Per recent;
Gold price target 1800 Feb 4 hit perfect to time and price provided on report 7 days prior. $GC_F $GLD $XAUUSD $DUST $NUGT

All the best with your trades and look forward to seeing you in the room!
Rosie the Gold Algo
Article Topics: Rosie, Gold, Algorithm, Chart, Trading, Gold, $XAUUSD, $GOLD, $GLD, $UGLD, $DGLD, Miners, $GDX, $NUGT, $DUST, $JDST, $JNUG