Tag: $STUDY
Premarket Trading Note: #OPEC, #OOTT, $CL_F, $USO, Gold, Silver, $VIX, $SPY, $NG_F, $BTC, Themes, Swing Trading, $STUDY, Webinar, P&L
Good morning Traders!
Crude oil topped out yesterday in its run up from lows April 28 – now (at time of writing I see price is spiking in premarket and bulls may take another run at highs). The OPEC pump is on.
OPEC PRESIDENT CALLS ON GROUP TO EXCEED 100% CUTS COMPLIANCE
— RedboxGlobal (@RedboxWire) May 1, 2020
We wrote a two part article on the time cycle work we are doing in crude oil trade specifically to the one hour time frame, we called the intra-week top tick almost to the penny and time, days in advance. You can read the article that includes the oil trading room minute by minute with trade alerts here.
https://twitter.com/EPICtheAlgo/status/1255927696447737858
It is important for all instruments of trade if you’re going to trade the future markets to understand what the machines are doing, they do drive price along with other reasons of course.
Our machine coding to equities, commodities, currencies and crypto are all rooted in the discipline of the analysis you will find in that article I reference (it is a two part article that is thick and difficult to read but if you put aside an hour you will understand the concept and it will help you in any trading of any instrument for daytrading and swingtrading).
Our timing with the recent profit trims in Gold $GC_F $GLD $XAUUSD was excellent in the 1720s. Gold is now trading 1678.00 in premarket and we are looking at adds long at bottom of chart structure in your reports.
Natural Gas is up nicely this morning, we’re looking for adds to the long starter we have, however, I’m not sure where we are going to add, watch the alert feed.
Our profit trims in SP500 $SPY long positioning was executed quite well, we knew there was a high probability of time cycle inflections in to end of week (considering the Thursday afternoon oil time cycle peak) as alerted, so this worked out really well. Here also we’re looking for adds to the positioning, watch the alerts.
The Volatility long trade in to peak last cycle was near perfect with $VIX and $OVX (20s to 330s) and the alert last few days surrounding supports near was also spot on, we haven’t added to our long positioning yet, but it shouldn’t be far out.
The Bitcoin $BTC long positioning and recent trims on resistance are good but it’s still in bull mode this morning at time of writing 8938.00, so it’s an excellent swing trade no doubt, we’re watching for top of structure on model charting you have to see more profit trims.
Silver $SLV as expected is still under pressure and we’re just looking for adds to long positioning at chart model supports (see your reports).
Equities this recent cycle, timing was almost perfect, it was a great start to the cycle. I had called the cycle to start April 10, 2020 and the our models had it about 10 days prior (the models were closer than my call) but it couldn’t have been better. Timing cycles have been fantastic. Market highs we got, the down turn we nailed really hard and now this recent run up has been a good start. And even this week calling an interim rest in the cycle was spot on. Now we’re in $STUDY mode as we took our profits in to last few days.
I’ve received a number of personal notes from our Swing Trading Alerts platform users recently (on email mostly) and I think I’ll be asking you folks if I can post them anonymously to our website as swing trade reviews for other traders looking in to swing trading services. I appreciate hearing from you, it does make the work we do worthwhile when you hear about traders becoming disciplined consistently profitable traders. It will be good to meet as many of our new trading members as can make it out in the near future. Eventually most end up visiting the island.
Don’t miss the Sunday Swing Trade $STUDY Webinar series restarting this Sunday at 7 pm. If you’re not a registrant there are still 4 spots for this Sunday. If you can’t attend live the videos are sent out thereafter.
I will be in a location this weekend again where high speed stable internet is 100% as we know the area well.
Next week will be very active in the live trading room and we start daytrading the swing trade set-ups on lower time frames also soon (this requires us updating the swing trade charting to lower time-frames for daytrading, coming soon).
EPIC V3.1.1 crude oil trading alerts have been firing very well post Black Swan code updates. Last night taking a short side trade that was almost to the minute perfect. Huge range in that short so it worked out well for our oil traders.
Beauty of a short sequence EPIC V3.1.1 started at 1:00 AM, see article(s) pinned on my account.#OOTT $CL_F $USO $USOIL pic.twitter.com/fkT4U49HGY
— Melonopoly (@curtmelonopoly) May 1, 2020

Themes will be the power of returns in the next time cycles in to the election and beyond, we’re working at these every day and you can expect a lot more swing trade set-ups over the weekend and in to next week.
this is the big risk management, sizing bias Q 💯🎯
imo add some critical thought toward who / which narratives are taking hold in the information war and you can size your themed trades within the cycles for best ROI https://t.co/kYO4pwr0or
— Melonopoly (@curtmelonopoly) May 1, 2020
Today my advice is to go very easy, put your time in to $STUDY, every hour invested in preparation for markets pays massive dividends.
I wouldn’t expect super active trade in the live room today, but you never know. I would however expect such next week to be extremely active as I’ll have my high speed line to work with and there are a number of videos I need to do, like a $STUDY on how to scan for swing trade set-ups, how to trade the one hour crude oil model we’ve recently locked in for our oil traders and various others.
back to surfer class living this weekend
a month behind the wall all i could muster… security of armed guards, tranquility, conveniences, pool were all nice but…
i love the ocean 🐳🌊🍉🧉⛱️💙🤿🍍🌴🐙
internet already installed and ready, and stable (we know the area)
— Melonopoly (@curtmelonopoly) May 1, 2020
Oh, and I have the most recent time cycle swing trade profit and loss in my hands, I’ll review and add study notes and send out this weekend. This will also help those looking for a current trade position listing. Blow out performance, it’s getting better as we go, which is good of course!
If you want direct access to me on Whatsapp send your request on email and I’ll connect on there with you. It works well as sometimes I am away from my trading desk and if you need a hand with a trade I’m right there right now.
As always if you need anything be sure to email [email protected] and have a great weekend!
Thanks
Curt
Article Topics; Premarket, Trading Room, #OPEC, #OOTT, $CL_F, $USO, Gold, Silver, $VIX, $SPY, $NG_F, $BTC, Themes, Swing Trading, $STUDY, Webinar, machine trading, time cycles, positioning, P&L
Swing Traders $STUDY Guide “Trading Down Trend-Line Break-Outs” ARCUS BIOSCIENCES Set-Up (Premium Part 2 of 2) #swingtradingreviews
Part 2 of 2: Swing Trade $STUDY Review on ARCUS BIOSCIENCES (RCUS) Swing Trade Alert Trading Strategy.
“Down Trending Resistance Trend Line Break-out Swing Trade”.
Below there are so many secrets to our swing trading success, in this article we look at the following areas of trading discipline for your trading plan:
- Determining bias according to market time-cycles,
- How to scan for swing trading set-ups,
- How to determine price extensions for realistic price targets,
- Support and resistance diagonal trend-lines, horizontal trend-lines, Fibonacci levels,
- How to manage execution of the swing trade set-up,
- How to manage trading stops, trade sizing, ebb and flow trade executions at support and resistance.
Part 2 of this analysis (below) is a Premium Member Only article and Part 1 can be found here;
Determining Time Cycle Bias for Your Trades.
Recently I wrote a few articles on the topic of time cycles in the markets using the Volatility (VIX) structured time cycles, this is a great place to start when determining first your bias of being bullish or bearish. In other words, should you be more focused on swing trades to the long or short side?
You can find Part 1 of the two part article here: How to Swing Trade Volatility $VIX Time-Cycles (UNLOCKED PT 1): Achieve Higher Gains in Stocks, Commodities, Indices, Crypto, Currencies and Theme Trades.
If the trajectory of market volatility is down (compressed) and you are more confident that volatility will be lower as you approach the next time cycle inflection then in most cases you would be bullish equities – this of course is just one example.
Alternatively you would be bias to the down-side for trading volatility so you may short $TVIX in this instance.
There are many ways to take advantage of the time cycles with various swing trades from Indices, Currencies, Crypto, Sectors, Stocks and more.
Just because the volatility is expected to rise or fall doesn’t mean however this should be the only determining factor when choosing theme trade set-ups, below is an example of just that with the ARCUS stock trade.
First, lets look at how stock scanning works.
How to Scan For Stock Swing Trading Set-Ups.
Good stock technical analysis knows before the news hits more often than not what the likely trade on each stock will be.
Technical analysis knows before the news hits because the stock will start to provide “tells” within the trade action of the stock and various technical points become clear.
So if you can know the TA of a specific stock better than most you have an advantage over other traders at all times because you can usually be ahead of the main part of the move.
Anyone, even the best fundamental traders would do better if they were also experts at technical analysis.
If the technical structure of the chart is suggesting a bullish move for example, you can then start to take small entries and build a position in expectation of a move.
The technical “tells” develop when insiders know something about upcoming news or even as geopolitical narratives are changing.
And then as you start to see specific technical trade patterns set-up in more and more equities you will find that this is a manifestation of the expert traders all beginning to bias their trades toward a theme usually within a sector, whether it be for a technical reason or a geo-political reason or perhaps some other fundamental or market sentiment reason.
If you get in “the pocket” right, you will find many set-ups during a period of time that will be almost identical and will provide excellent returns one after another.
This is what happened with our trading of the technical set-up in RCUS, many others were very similar during this time period in the markets and our returns increased rapidly.
I keep it simple and use Trading View for my scans.
On any given day, usually sometime after lunch I will open Trading View and click on the fire emblem on top right side of screen – this is your hot-lists of hot stocks on the day (see screen shot of my Trading View below). You can set the scanner in Trading View for various levels and parameters. I scan the running stocks with large gains, the losers and the OTC markets.

Then I simply open each chart (primarily scanning the hot stocks on the day) and I start with the weekly time-frame.
I’m looking for chart history or patterns of trade, chart memory or some semblance of chart history with some order. The simpler the chart patterns the better. Anyway, as you learn all the different set-ups this gets much easier and faster.
Every financial instrument I trade I make sure that it has a structure, some order is required or your trading edge is not increased.
When I find a chart set-up I like I open the chart and take a look at it on various time-frames and consider how to trade the stock, price targets and various support and resistance levels.
Then I look at things like incoming volume, company news, sector themes, geopolitical type things, look at insider buying or selling and various other research.
During the period of time we took the swing trade in ARCUS the trend-line resistance break-out trade was happening regularly and was providing excellent returns for 2 – 6x and even more in some cases wins.
When I Used the Scanner and Isolated the ARCUS Swing Trade Set-Up It Was Yet Another Trend-line Resistance Set-Up That Was Likely to Explode.
Below is the chart I found when scanning, it shows clearly the trend-line resistance set-up. The chart below is from one of the earlier swing trade alerts we sent out to members for this set-up. You can see the spike through the trend-line resistance (which occurred after the original alert).
You can clearly see the down-sloping trend-line in the chart on the alert.
This set-up was on high alert because this specific trade set-up was hitting one after another, if this was not the case I wouldn’t have been so keen on taking these trades.
you want to be where the wolf pack is
It is the theme that is important, you want to be where the wolf pack is, where all the other winning traders are. Just a winning set-up isn’t enough. Just a news event or a fundamental set up on its own is not the optimal scenario, you want to be where the flow is. This is critical.

And then as the trade progressed (after alerting the swing trade sometime earlier) the structure of trade was clear and it was just a matter of trading risk in ebb and flow (see chart below).
It is important to note that we cannot alert every pull back and add and trim, it isn’t possible, what we do is get our members started in a swing trade and then endeavor to alert the key trades (especially key areas of resistance) as it progresses. Our trader’s platform (automation for alerts) will solve this manpower issue, but really every trader should be planning their sizing and support and resistance adds and trims for profit based on their own account risk, risk tolerance, style and more. If you are just blindly following another trader this will not work for you.

Charting Price Extensions for Price Targets and Timing.
This can be more art than science and your price extensions and price targets may change as the price or timing of the stock price movements move along.
In the chart below you will see diagonal white arrows (3 of them). The angle is just a reflection of the down-slope (a mirror of the angle). The length of the price extension is simply a mirror of the down-slope trend from previous. So each of the 3 arrows trending up are equal in duration and price.
These are a simple way of taking a shot at the most probable price extensions.
One key note here is that often you will get 1.5 extensions or 3. Why I don’t know. If you look at the chart below that is how I determined my price target from 15.00 to 30.00 and in last weeks trade the price target was hit early.
You will also notice (in blue on chart) I drew in an Elliott Impulse Wave, but I do that more for fun to see if I can tell the exact future of the play, you can see in this instance I was close, but the bulls were more aggressive than I even thought they would be.

Support and resistance diagonal trend-lines, horizontal trend-lines, Fibonacci levels.
In the chart above the diagonal trend-lines (charted in advance of trend-lines being there) are determined by taking the down trending price action of prior and extending the the tops of each lower high as the stock traded down in trend. the angle of the trend-lines was simply determined by historical trade.
The horizontal trend-lines (thin grey ones on the chart) were determined by simply drawing horizontal rays at the highs in the previous downtrend then duplicating to create a grid. These are not that important, I use them to see if there is a grid to be had. Why? Because I’m looking for order or structure.
And then the Fibonacci levels are simply done using your Fibonacci retracement drawing tool between the key support (or bottom of chart) and the price extension top. And then you copy and paste it up for each key leg in possible future trade. I always chart the low and high as horizontal key support and run them straight across horizontally on the chart as grey or green as these represent key areas of support and resistance.
How to Swing Trade It – manage execution of the swing trade set-up: Starter positioning, trading stops, trade sizing, ebb and flow trade executions at support and resistance.
Usually, when price breaks the trend-line resistance to the upside this is your trigger to be at least on watch for your initial entry.
You need to determine how many entries you are prepared to take. Hopefully it is more than one and preferably up to 10. Here is why;
When price breaks out upside the trend-line you want to be able to take at least a starter right away because most traders will wait until price returns to the previous resistance now support for the test of support and then go.
Some will even wait for it to bounce and get higher than the previous candle. All methods are fine but if you’re in it to win it then I would suggest taking 1/10 size at each of those three triggers I just explained.
Why? Because sometimes price doesn’t come back to you. The stronger the theme, the stronger the market, the stronger the stock set-up the less chance it’s coming back to you and then you’re chasing it.
Now if you’re in 3/10 size or 30% size and your trade breaks down, you’re down on your trade but if you are winning 80% or better you can lose 10% 2 out of 10 times and win 30% or more 8 out of 10 times.
In the ARCUS example price never came back.
I look at every trade like a chess board, the more dot plots or entries and trims of profit the better, this is how we’re coding the 200 equities to trade under the machine trading program and how we’re coding the trader’s digital platform so members of our swing trade alerts will be able to see this real time. Until then, there is myself and three staff managing the numerous trades in various equities along with coding, alerts, newsletter publications and various other duties – hence the reason for coding automation.
Now, in the ARCUS example above you would have taken your starter 10 – 20% in size and it didn’t come back, what it did is it hit the first key resistance and then came back.
AT THAT RESISTANCE you need to trim 50% of your profit and then add to the trade at key supports in bits until it bounces and then continue with taking profits along the way at each key resistance.
Managing your trade size is critical. If you’re only going to be a one hit wonder, taking one entry for the win then you need to learn how to bring your charting down to a daytrading time frame so that you can execute your position on a lower time-frame of charting like a 5, 15 or 30 minute chart. I have an article coming on this discipline but in the meantime if you need to know how I do this ask me for a coaching session and I’ll show you.
Setting your stops is based on many things and this is why I don’t like publishing alerts with stops. This is determined by your experience (newer traders have to take more cuts because they don’t know what a prime set up is) so newer traders have to use hard stops religiously, I don’t because I know I can dot plot my way out of any trade as long as the stock isn’t destroyed by some black swan event.
In a black swan (market wide) I don’t worry because I’m in structured strong set-ups 90% of the time. If it’s not a strong set-up I’ll usually alert that or if its risky etc.
newer traders have to use hard stops religiously, I don’t because I know I can dot plot my way out of any trade as long as the stock isn’t destroyed by some black swan event
All of our trades we are sizing adds at support and trimming at resistance areas. There are many things that determine this also, such as market time cycles, market sentiment, sector sentiment, perhaps the technical set up is no longer being run by the bulls and many other factors.
False break-outs happen so you need to be prepared to take a loss, but when you get better at being able to determine key set-ups for all the reasons above and more you won’t be as concerned about that.
Other considerations technically speaking;
Most traders will wait for the current chart candle to close beyond the down-sloping trend-line resistance so they have a confirmed break-out, but remember, sometimes this won’t happen and a really bullish stock will just leave you in the dust.
Most traders will take their initial long starter position in the trade when the stock price has retraced back near or at the original trend-line, but again, this does not always happen and you can get left behind.
Most traders will set their stop just beyond failure of the trend-line but this can cause a trader’s account balance to be dwindled due to death by a thousand cuts.
The secret here is to not be most traders.
In this game if you are like most you will have like most (at best) returns, around 15% a year if you are lucky.
The traders that consistently post returns of 3, 4, 5 x or more per year are using a strategy that most do not.
What is that?
How did Wayne Gretzky explain how he played hockey? He had a knack at knowing where the puck was going to be so he went there.
“Skate to where the puck is going, not where it has been.”
— Wayne Gretzky
“Skate to where the puck is going, not where it has been.”
— Wayne Gretzky
— Melonopoly (@curtmelonopoly) April 26, 2020
Same thing here.
Below is one of many of my rants on the subject, on my personal twitter feed;
Great question RE: Bitcoin $BTC trade bull or bear cycles within the next two global market time cycles. #timecycles #trading https://t.co/2CAQIOjvxL
— Melonopoly (@curtmelonopoly) April 25, 2020
If you get good at what I am describing above you will always know in advance (with high probability) when the price of the stock is going to move that you are trading, so manage the risk between where it is and where it is going like a chess board and you will see returns of 3, 4, 5 x or more per year.
Any questions email me anytime at [email protected].
Thanks
Curt
Current List of Available P&Ls (remaining dates are in progress now to be released soon):
- Swing Trading Performance Summary (Q4 2019, Q1 2020 Interim): Return %, Gain/Loss, Win/Loss Rate, Number of Trades.
- Swing Trading Alert Profit Loss – Annualized ROI 1543.93% Feb 1-Feb 21, 2020. $200,000.00 – $230,051.00 #swingtrading #tradealerts
- Swing Trading Profit Loss – Annualized ROI 64.45% Jan 1 – Jan 31, 2020. $200,000.00 – $208119.00. #swingtrading #tradealerts
- Swing Trading Profit Loss – Annualized ROI 246.31% Dec 1 – Dec 31, 2019. $200,000.00 – $220,898.50. #swingtrading #tradealerts
- Swing Trading Profit Loss – Annualized ROI 315.32% Nov 1 – Nov 30, 2019. $200,000.00 – $224,130.16. #swingtrading #tradealerts
- Swing Trading Profit Loss – Annualized ROI 62.69% October 2019. $100,000.00 – $103,970.20. #swingtrading #tradealerts
- Swing Trading Profit Loss Annualized 355.22%. March 26 – June 28, 2017. $204,616.60 – $303,443.60. #swingtrading #tradealerts
- Swing Trading (Short Term Trades) Profit Loss Annualized 2,437.96%. April 3 – June 28, 2017. $17,354.69 – $37,713.16 . #swingtrading #tradealerts
- Swing and Day Trading Profit Loss – Annualized 957.90% Dec 26, 2016 – March 26, 2017. $100,000.00 – $180,347.88 . #swingtrading #tradealerts
Subscribe to Swing Trading Service:
Swing Trading Bundle (Swing Trading Newsletter, Live Swing Trading Alerts, Study Guides).
Swing Trading Newsletter (Weekly Newsletter Published for Traders).
Real-Time Swing Trading Alerts (Private Member on Twitter Feed and more recently by way of Email).
Swing Trading Study Guide Newsletters (After Trade In-Depth Reviews Including Set-Up Identification, Trading Plan, Sizing, Risk Management, ROI and more).
One-on-One Trade Coaching (Via Skype or In-Person).
Free Mailing List(s):
Join Email List for Free Trade Charting Trade Set-ups, Deals, Podcasts and Public Webinars.
Free Swing Trading Periodical Contact Form (Complimentary Swing Trade Set-Ups to Email)
Public Chat:
Visit our Free Public Chat Room on Discord.
Free Mailing List(s):
Join Email List for Free Trade Charting Trade Set-ups, Deals, Podcasts and Public Webinars.
Free Swing Trading Periodical Contact Form (Complimentary Swing Trade Set-Ups to Email)
Public Chat:
Visit our Free Public Chat Room on Discord.
Follow:
Article Topics; swing trading, swing trade review, study, stocks, alerts, set-ups, patterns, break-outs, themes, support, resistance, trendlines, sizing, stops, risk, technical analysis, Fibonacci, price targets, price extensions, strategy.
How to Swing Trade Time-Cycles (Unlocked PT #3): Theme Trading Strategies – How the US Dollar Should Bias Trade Positioning. $USDCAD $DXY #FX
How to Swing Trade Time-Cycles (Unlocked PT #3)
Theme Swing Trading Strategies – How US Dollar Should Bias Trades in Indices, Commodities, Currencies, Crypto and Stocks.
Below is a copy of a $USDCAD Trading View chart idea I just posted open to the public (unlocked) that shows the time cycle peak for USDCAD in to Jan/Feb of 2021 warning shorts of the potential for significant volatility in to that time period, it is advantage bulls in USDCAD.
Any other investing or swing trading a trader does should take this time cycle and strength of the US Dollar in to consideration.
Time cycle peaks can go either way so it is important to be flexible in your trading bias, however, this particular set-up is unusually strong and it is a LARGE TIME-CYCLE, this is charted on a Weekly Time-Frame which should be given great consideration by a trader in strategic theme trade planning.
The second part to this public facing unlocked post will be part 3B at which time I will unlock the theme swing plays our members will want to consider for swing trading various financial instruments (as listed above in sub title) in to this time cycle peak.
I will also expand on the US Dollar charting and various algorithmic models to consider in the US Dollar (DXY) for trading it and themes surrounding the US Dollar.
For now, a copy of my Trading View Post on USDCAD chart structure is below with some comment.
Very Dangerous for Shorts – USDCAD Time Cycle Peak Jan-Feb 2021 – #USDCAD chart

Time Cycle Peaks and Inflections
Time cycle inflections can go either way, they are an area of great volatility , but for now this is significantly weighted to advantage bulls as it relates to the time cycle in currency trade for USDCAD #USDCAD $USDCAD.
What makes this potentially even more volatile is the work we do in volatility $VIX timecycles and Oil volatility ( OVX ) etc. They are all signalling this time period as extreme.
………………………………………………………………………………………………………………………….
How to Swing Trade Volatility $VIX Time-Cycles (UNLOCKED PT 1): Achieve Higher Gains in Stocks, Commodities , Indices, Crypto, Currencies and Theme Trades.
Protected: How to Swing Trade Volatility Time-Cycles (PREMIUM PT 2): Entering Eye of The Storm – Indices, Commodities , Currencies, Crypto and Stock Theme Trades.
And coming in this series of Swing Trading $STUDY GUIDES (after we review current trade alerts and profit loss statement updates) you will see a series of articles from me to prepare our swing trades that will slowly focus us down deeper and deeper in the rabbit hole of the cycle.
You’ll see review of current trade positions, swing trade alert reviews and on to indices, sectors, commodities, currencies and then themes will start to show themselves in stocks etc.
So now it is all about $STUDY of trade set-ups and watching for inflections, themes, sentiment, trajectory of trade and much more.
This is why the Sunday $STUDY sessions are so important. THEY ARE CRITICAL.
Just following along with our swing trade alerts is fine – we have many traders that do very well with simply just that, but it doesn’t help teach you to learn to fish on your own.
If you are in the Swing Trade $STUDY sessions you can bring set-ups forward, you can then plan your sizing and ebb and flow of trade in advance. This is key to trading success. A plan in advance.
We charge 100.00 for non-members and 50.00 for members for 10 session blocks at 4 hours each held once a week and if you can’t be in session online we email a video copy to you.
You can register online here to the Swing Trade Sunday $STUDY Sessions.
Stay awake, we’re entering the cycle now, it reminds me of being in the two hurricanes on the north shore of the Dominican Republic a few years back, it is an amazing experience.
If you need help with a trade set-up email me at [email protected].
Thanks,
Curt
Look for “Swing Trading Time Cycles Part 4: Swing Trade Alert Reviews – Current Trades” in your member email inbox shortly.
Current List of Available P&Ls (remaining dates are in progress now to be released soon):
- Swing Trading Performance Summary (Q4 2019, Q1 2020 Interim): Return %, Gain/Loss, Win/Loss Rate, Number of Trades.
- Swing Trading Alert Profit Loss – Annualized ROI 1543.93% Feb 1-Feb 21, 2020. $200,000.00 – $230,051.00 #swingtrading #tradealerts
- Swing Trading Profit Loss – Annualized ROI 64.45% Jan 1 – Jan 31, 2020. $200,000.00 – $208119.00. #swingtrading #tradealerts
- Swing Trading Profit Loss – Annualized ROI 246.31% Dec 1 – Dec 31, 2019. $200,000.00 – $220,898.50. #swingtrading #tradealerts
- Swing Trading Profit Loss – Annualized ROI 315.32% Nov 1 – Nov 30, 2019. $200,000.00 – $224,130.16. #swingtrading #tradealerts
- Swing Trading Profit Loss – Annualized ROI 62.69% October 2019. $100,000.00 – $103,970.20. #swingtrading #tradealerts
- Swing Trading Profit Loss Annualized 355.22%. March 26 – June 28, 2017. $204,616.60 – $303,443.60. #swingtrading #tradealerts
- Swing Trading (Short Term Trades) Profit Loss Annualized 2,437.96%. April 3 – June 28, 2017. $17,354.69 – $37,713.16 . #swingtrading #tradealerts
- Swing and Day Trading Profit Loss – Annualized 957.90% Dec 26, 2016 – March 26, 2017. $100,000.00 – $180,347.88 . #swingtrading #tradealerts
Subscribe to Swing Trading Service:
Swing Trading Bundle (Swing Trading Newsletter, Live Swing Trading Alerts, Study Guides).
Swing Trading Newsletter (Weekly Newsletter Published for Traders).
Real-Time Swing Trading Alerts (Private Member on Twitter Feed and more recently by way of Email).
Swing Trading Study Guide Newsletters (After Trade In-Depth Reviews Including Set-Up Identification, Trading Plan, Sizing, Risk Management, ROI and more).
One-on-One Trade Coaching (Via Skype or In-Person).
Free Mailing List(s):
Join Email List for Free Trade Charting Trade Set-ups, Deals, Podcasts and Public Webinars.
Free Swing Trading Periodical Contact Form (Complimentary Swing Trade Set-Ups to Email)
Public Chat:
Visit our Free Public Chat Room on Discord.
Free Mailing List(s):
Join Email List for Free Trade Charting Trade Set-ups, Deals, Podcasts and Public Webinars.
Free Swing Trading Periodical Contact Form (Complimentary Swing Trade Set-Ups to Email)
Public Chat:
Visit our Free Public Chat Room on Discord.
Follow:
Article Topics; US Dollar, USD/CAD, DXY, swing trading, time cycles, trading, currencies, study, charting, setups, FX
Important Notice: Swing Trade Sunday $STUDY Session Scheduling, Market Time Cycles, P&Ls
Important Notice: Swing Trade Sunday $STUDY Session Scheduling, Market Time Cycles, P&Ls
Good afternoon traders!
The weekly Swing Trade Sunday $STUDY session scheduled for tonight will not take place and will resume at the regular time of 7 PM each Sunday starting next Sunday.
To register for the Weekly Swing Trading $STUDY Webinar Sessions to prepare for your trading week register here. They are 100.00 for 10 sessions (10 weeks) at 4 hours each (running perpetually now) and if you cannot attend in person online in the webinar you receive a video report thereafter also.
With the COVID-19 internet challenges with usage (internet itself but more importantly Click Meeting server space) we expect by this time next week this will not be an issue.
In lieu of, I will be preparing my own personal swing trade set-ups and will prepare them in a written report (charting etc) and send this to our members prior to premarket open Monday.
If you have any trade set-ups you would like me to review and include in the report please email them today (even if you have already previously through-out last week).
Below are some of the recent swing trade reports – the email sent earlier to members contains the whole list with passwords and webinar $STUDY videos recently done, $STUDY of the reporting historically will prepare you to trade the future also. For passwords please refer to the member only email sent earlier today.
Jen is completing the most recent Swing Trade P&L’s also and working on a current open trade wall posting system to make that more real-time for members (until then the swing trade alert feed and historical P&Ls are available). The historical Swing Trade Profit and Loss Reports are available on the main home page of the Compound Trading website at www.compoundtrading.com.
We expect this to be yet again another significant time cycle and this week should start to show that true.
As always, anything I can do to help please let me know.
Peace and best,
Curt
Swing Trading Performance Summary (Q4 2019, Q1 2020 Interim): Return %, Gain/Loss, Win/Loss Rate, Number of Trades.
https://compoundtrading.com/
https://compoundtrading.com/
…………………………
More Active Intra-Day Trading is Near (Time Cycle Inflection) RE: Live Trading Room, Oil & Swing Trade Alerts. Stocks, $SPY, OIL, $CL_F, $USO, GOLD, $GLD, SILVER, $SLV, $BTC, $VIX, $DXY)
Protected: Swing Trading ALIBABA (BABA): Technical, Sentiment, Risk-Reward Strategies. Why ALIBABA Over Other China Stock Trades. #swingtrading $BABA
Protected: Swing Trading APPLE (AAPL): Charting and Trade Strategies. Why I Took Apple Trade over SP500 and QQQ. #swingtrading $AAPL
Protected: Swing Trading SP500 $SPY Levels: Charting and Trade Strategies #swingtrading #SPY
Protected: Key Crude Oil Swing Trade and Geo Political Set-Up #OOTT $CL_F $USO #oilswingtrading #tradealerts
NOTICE: Location Move, Market Outlook, Sunday Swing Trade $STUDY, Trading Room, Alerts, Reporting, P&L’s, White Paper EPIC v3 Machine Trade, Trader’s Conference.
Morning Note | Crude Oil, $CL_F, $USO, Gold, $GLD, $GC_F, SP500, $SPY, Volatility, $VIX #premarket #trading
Protected: Live Trading Trading Room Review (Premium) Crude Oil, SPY, Gold, VIX. Silver, Bitcoin, Natural Gas, US Dollar #swingtrading #daytrading
Protected: Trading the White House Briefing, COVID, Etc: #Daytrading, #Swingtrading – Equities, Oil, $USO, $CL_F, #OOTT, SP500, $SPY, Gold, $GLD, $GC_F, Bitcoin, $BTC, Silver, $SLV, Volatility, $VIX, USD, $DXY
Protected: Swing Trading Set-Ups (Premium) UPDATE with VIDEO April 6, 2020 $STUDY Webinar Series : Time Cycles, Trade Alerts, Charting, Price Targets
Protected: Swing Trading Set-Ups (Premium) April 3, 2020 : Time Cycles, Trade Alerts, Charting, Price Targets ZOOM, SPY, VIX, GOLD, SILVER, BTC, Oil
Current List of Available P&Ls (remaining dates are in progress now to be released soon):
- Swing Trading Performance Summary (Q4 2019, Q1 2020 Interim): Return %, Gain/Loss, Win/Loss Rate, Number of Trades.
- Swing Trading Alert Profit Loss – Annualized ROI 1543.93% Feb 1-Feb 21, 2020. $200,000.00 – $230,051.00 #swingtrading #tradealerts
- Swing Trading Profit Loss – Annualized ROI 64.45% Jan 1 – Jan 31, 2020. $200,000.00 – $208119.00. #swingtrading #tradealerts
- Swing Trading Profit Loss – Annualized ROI 246.31% Dec 1 – Dec 31, 2019. $200,000.00 – $220,898.50. #swingtrading #tradealerts
- Swing Trading Profit Loss – Annualized ROI 315.32% Nov 1 – Nov 30, 2019. $200,000.00 – $224,130.16. #swingtrading #tradealerts
- Swing Trading Profit Loss – Annualized ROI 62.69% October 2019. $100,000.00 – $103,970.20. #swingtrading #tradealerts
- Swing Trading Profit Loss Annualized 355.22%. March 26 – June 28, 2017. $204,616.60 – $303,443.60. #swingtrading #tradealerts
- Swing Trading (Short Term Trades) Profit Loss Annualized 2,437.96%. April 3 – June 28, 2017. $17,354.69 – $37,713.16 . #swingtrading #tradealerts
- Swing and Day Trading Profit Loss – Annualized 957.90% Dec 26, 2016 – March 26, 2017. $100,000.00 – $180,347.88 . #swingtrading #tradealerts
Subscribe to Swing Trading Service:
Swing Trading Bundle (Swing Trading Newsletter, Live Swing Trading Alerts, Study Guides).
Swing Trading Newsletter (Weekly Newsletter Published for Traders).
Real-Time Swing Trading Alerts (Private Member on Twitter Feed and more recently by way of Email).
Swing Trading Study Guide Newsletters (After Trade In-Depth Reviews Including Set-Up Identification, Trading Plan, Sizing, Risk Management, ROI and more).
One-on-One Trade Coaching (Via Skype or In-Person).
Free Mailing List(s):
Join Email List for Free Trade Charting Trade Set-ups, Deals, Podcasts and Public Webinars.
Free Swing Trading Periodical Contact Form (Complimentary Swing Trade Set-Ups to Email)
Public Chat:
Visit our Free Public Chat Room on Discord.
Free Mailing List(s):
Join Email List for Free Trade Charting Trade Set-ups, Deals, Podcasts and Public Webinars.
Free Swing Trading Periodical Contact Form (Complimentary Swing Trade Set-Ups to Email)
Public Chat:
Visit our Free Public Chat Room on Discord.
Follow:
Article Topics; swing trading, $STUDY, Webinars, Profit Loss
PreMarket Trading Plan Tues Feb 6 $VIX, $VVIX, $XIV, $GSUM, $WKHS, $ROKU, $JP, $SLCA, $INSY, $SPXL, $SPY, $BTC.X, Bitcoin, Gold, $DUST, $WTI, OIL
Compound Trading Chat Room Stock Trading Plan and Watch List Tuesday Feb 6, 2018 $VIX, $VVIX, $XIV, $XNET, $GSUM, $WKHS, $ROKU, $JP, $SLCA, $INSY, $SPXL, $SPY, $BTC.X, Bitcoin, Gold, $DUST, $WTI, OIL – Gold Miners $GDX, Silver $SLV, $USOIL, US Dollar Index $USD/JPY $DXY, S&P 500, Volatility … more.
Welcome to the morning Wall Street trading day session at Compound Trading!
Notices:
Notes in red text below are new comments entered specifically today (or recently important).
$XIV news is pending per below.
The obscure volatility security that’s become the focus of this sell-off is halted after an 80% plunge http://cnb.cx/2BemWWn
Credit Suisse is said to consider redemption of volatility note https://www.bloomberg.com/news/articles/2018-02-06/credit-suisse-is-said-to-consider-redemption-of-volatility-note …
Updated charting will be sent today to members for… charts that are unusually affected due to significant volatility. Any outstanding charting / reports before Wed market open at latest (Crypto, Swing, Silver).
A Quick Member Update – 2018 Plans and Current Status
https://twitter.com/CompoundTrading/status/951798787521089543
Today’s Live Trading Room Link:
http://compoundtrading1.clickmeeting.com/livetrading
Live Alerts for Oil, Gold, Swing Trading, Day Trading, Bitcoin are now available by following specific alert Twitter feeds.
Disclaimer / disclosure: Every subscriber must read this disclaimer.
Private Capital Fund / Personal Trading Going Forward:
The private capital fund will bring slight changes.
The financing of our business build-out was planned to occur by way of either retail memberships, institutional memberships or private fund trading. The retail market is still early and slow on the uptake of the requirement toward #IA intelligent assisted trade (within six years our estimation is that most retails traders will all need it, but until then we’re not waiting and we’ll just be ready on the other side of that awareness curve). The institutional membership growth has been strong and to be sure we meet our growth trajectory goals (development completion timeline targets for launch of digital “intelligent assistance” #AI algorithm models) we are engaging the implementation of a private capital fund.
A few things of consideration:
- Following my trades is never condoned. Trade alerts are for the purpose of alerting awareness to something important occurring so that a member can form a thesis of trade and they are also for the purpose of learning when I win and win I fail. This (following trades) will be more difficult going forward because my frequency of trade will increase also.
- Trade Alerts. The trade alerts (swing and day) are not guaranteed at any time (in and/or out) however, it is important to note that with a much higher frequency of trade I will be alerting only those trades I expect to last a few hours or longer. If you ask me for targets or thesis type questions on the alert feeds or otherwise it is unlikely you will receive a response. Trade review videos will be posted for that purpose as required.
- Type of Trades. We will be trading the algorithm models (the seven we have), day trading and swing trading for the fund.
- Trade Sizing. When I alert to the trading room or on a feed I will be alerting the size only specific to the membership base trading. In other words, the size of trade in our private fund is not disclosed.
- ROI Objective. We are trading under the goal / target of returning 100% per month. 50% would be very good and 25% is the minimum goal. So at minimum we are looking for 25% ROI per month compounded over 24 months.
- Term of Project. The term is 24 months (as mentioned above). Others we train as we progress will continue the legacy fund thereafter (as will they continue with our trading services at large).
- Trading Platform on Screen. When I trade my accounts (any of them) they may or may not be connected to various other private fund accounts (at different percentages etc).
- Sizing Considerations. Because we are / will also be trading a private fund, there will be trades we cannot take that I may otherwise take because the fund trade size will make it difficult for me to chip in and out of and other related liquidity issues.
Reporting and Next Gen Algorithms:.
BE SURE to get in to each private Discord server specific to your subscription as many of the updates as we go forward will be posted in there. This includes the SWING TRADING platform also.
IF YOU NEED A LINK / INVITE email or DM Sartaj!
Master Class Charting Series Webinars:
All members received a copy in their email inbox as we progress. Full series will be posted to website at a cost of 2999.99. Early adopter members receive it free.
Attendees to next Master Classes being held in Dominican, Columbia, Brasil, and Panama attendees will receive 50% credit to off-set travel costs. Limited space FYI. We are currently planning 2018 master class sessions and will advise.
Connect with me on Discord.
https://twitter.com/CompoundTrading/status/880670140454637569
Recent Blog / Video / Social posts:
#BitcoinTrading 101: A Beginner’s Guide to Getting Started $BTCUSD $XBTUSD $BTC https://compoundtrading.com/bitcointrading-101-beginners-guide-getting-started-btcusd-xbtusd-btc/ …
https://twitter.com/CompoundTrading/status/927397024315662336
How to Use EPIC Oil Algorithm: $USOIL, $WTI, $CL_F, $USO, $UCO, $SCO, $UWT, $DWT, #OIL, #OOTT: http://youtu.be/hawVV31G9bg?a via @YouTube
https://twitter.com/CompoundTrading/status/889148655785177088
How to Use ROSIE Gold Algorithm: #GOLD, $GLD, $XAUUSD, $GDX, $GDXJ, $NUGT, $DUST, $JNUG, $JDST
https://twitter.com/CompoundTrading/status/889147527278333952
Recent Mid Day Chart / Trade Set-Ups:
See You Tube for other recent video posts.
Swing trading setups Jan 18 $FB, $SPY, $CNTF, $CTIC, $RIOT, $AES ….
Swing trade stock setups Jan 19 $SPY, $GSUM, $DXY, $MIND, $XPO, $ICPT…
Swing trade / daytrade set-ups for wk of Jan 22 $SPY, $FB, $ROKU, $DXY, $JUNO, $BTC.X, $FATE …
CRITICAL time cycle decisions SP500 $SPY, Gold $GLD, Oil $WTI, USD $DXY, Bitcoin $BTC.X and more…
Swing trading ideas & how I am managing $SPY $SPXL trade, structural trading $XNET, $SQ, $GDX …
Technical charting lessons here at market open $HMNY, $XNET, $SPY, $SEII, $INSY, $SLCA
Jan 9 Swing trading set-ups $XNET mid trade technical review, $GSUM, $SLCA, $SPY, $TESS….
Live $XNET trade $4267.00 gain. Swing trade entry and chart set-up at 40:00 – 54:00 min on video.
Jan 8 Swing Trading Set-Ups $AYI, $SPY, $SQ, $VRX, $AXON, $BTC.X….
Market Open Jan 8 Live Chart Model “On the Fly” $VRX, $SPY, $BTC, $LITD, $MYSZ, $INSY
Jan 3 Swing Trading Set Ups $SPY, $SPXL, $LTCUSD, $GLD, $APRI, $MNKD, $INSY, $TEUM, $NTEC, $LEDS …
Jan 2 Swing Trading Set-Ups $BTC.X, $SPY, $GDX, $XOMA, $JP, $INSY, $MNKD, $NTEC, $SKT, $RENN …
Recent Profit and Loss Performance:
Q3/4 results will be published soon.
Q2 2017 Swing Trading Results are available here: P/L Realized Gains: $99,452.00 Percentage Portfolio Gain 105.74% (~35% per month)
https://twitter.com/CompoundTrading/status/896897288798392320
https://twitter.com/CompoundTrading/status/895492181699571712
Recent Educational Videos:
Want to learn how to trade stocks for a consistent profit? Raw trading footage video library. https://www.youtube.com/channel/UCxmgJ3CfWHRBFFMpoHumZ8w … … #freedomtraders
Visit the Trading Educational and Analysis Play List at this Link on our YouTube Channel
Trading Plan (Buy, Hold, Sell) Watch Lists. Morning Momentum / Gap / News / PR / IPO / SEC Filings / Earnings Stocks on Watch:
Caution. Watching close the sell-off for direction.
Per recent:
Market observation / on watch:
US Dollar $DXY up from yesterday’s report – pressure has slowed (broadening bottom on model) trading 89.65, Oil FX $USOIL ($WTI) down trading 63.24, Gold / Silver moderate – Gold intra day trading 1336.50 down slightly from yesterday, $SPY significant pressure trading 257.94, Bitcoin $BTC.X $BTCUSD $XBTUSD trading 6830.00 under significant pressure, and $VIX trading 49.2 up significantly from yesterday.
Recent Momentum Stocks to Watch:
News:
Recent SEC Filings:
Recent IPO’s:
Some Earnings On Deck:
#earnings for the week
$NVDA $TSLA $TWTR $SWKS $SNAP $DIS $ATVI $GILD $GM $CMG $BMY $AGN $TEVA $TTWO $BP $COHR $SYY $REGN $NTES $FEYE $ARNC $CVS $EXPE $SKX $HES $BAH $CMI $OCLR $GOLD $CHD $IRBT $LITE $GRUB $CTLT $GOOS $HAS $KORS $MCY $TRVG $ONVO $PM
#earnings for the week$NVDA $TSLA $TWTR $SWKS $SNAP $DIS $ATVI $GILD $GM $CMG $BMY $AGN $TEVA $TTWO $BP $COHR $SYY $REGN $NTES $FEYE $ARNC $CVS $EXPE $SKX $HES $BAH $CMI $OCLR $GOLD $CHD $IRBT $LITE $GRUB $CTLT $GOOS $HAS $KORS $MCY $TRVG $ONVO $PM https://t.co/lObOE0dgsr pic.twitter.com/SZzp8UrZ88
— Earnings Whispers (@eWhispers) February 3, 2018
Recent / Current Holds, Open and Closed Trades
New position $XNET 1/10 size long from Monday. Holding $XIV 1.5/10 sizing (per above awaiting news decision), $SPXL 1/10 size, small sizing golds $WKHS, $GE, $XBTUSD $BTC Bitcoin 9700.00 1/40 size, $DUST 1/20 size recently close 50% for win, $ROKU, $GSUM, $JP, $SLCA, $INSY (all small size) and very small on $AAOI, $SPPI and micro size $OMVS. Short 1/10 Gold short.
Per recent;
Holding $XIV 1.5/10 sizing, $SPXL 1/10 size, small sizing golds $WKHS, $GE, $XBTUSD $BTC Bitcoin 9700.00, $DUST, $ROKU, $GSUM, $SPXL, $JP, $SLCA, $INSY and very small on $AAOI, $SPPI and micro size $OMVS. Short 1/10 Gold short.
Closed $FB position yesterday for win, closed $XIV for win and re entered $XIV. Holding $XIV, $SPXL, $WKHS, $GE, $XBTUSD $BTC Bitcoin 9700.00, $DUST, $ROKU, $GSUM, $SPXL, $JP, $SLCA, $INSY small on $AAOI, $SPPI and micro size $OMVS. Short 1/10 Gold short.
Trimmed at highs and then added heavy $XIV yesterday, added $SPXL near lows, traded $WYNN for win and held some and some other minor trades (all wins). Holding $SPXL, $FB, $WKHS, $GE, $XBTUSD $BTC Bitcoin 9700.00, $DUST, $ROKU, $FB, $GSUM, $SPXL, $JP, $SLCA, $INSY small on $AAOI, $SPPI and micro size $OMVS. Short 1/10 Gold short.
Added Monday 1/10 size $SPXL, 1/10 $GE, 1/10 $DUST. Traded short oil for a small win on swing from Friday to Monday early the traded again Monday morning for a loss 1/10 size. Friday trimmed $SPXL to 1/20 size hold, trimmed $FB to 1/20 size hold, holding long $WKHS, $GE, $XBTUSD $BTC Bitcoin 9700.00, $DUST, $ROKU, $FB, $GSUM, $SPXL, $JP, $SLCA, $INSY small on $AAOI, $SPPI and micro size $OMVS. Short 1/10 Gold short.
Trade short oil for a small win on swing from Friday to Monday early. Friday trimmed $SPXL to 1/20 size hold, trimmed $FB to 1/20 size hold, holding new entries $WKHS, $GE. Holds on Bitcoin at 9700.00, trimmed 50% of $ROKU hold, $FB, $GSUM, $SPXL, $JP, $SLCA, $INSY small on $AAOI, $SPPI, Gold short, $DUST and $OMVS micro size.
Added $SPXL, new add $WKHS, $GE. Holds on Bitcoin at 9700.00, $ROKU, $FB, $GSUM, $SPXL, $JP, $SLCA, $INSY small on $AAOI, $SPPI, Gold short, $DUST and $OMVS micro size.
The USD Dollar is the most oversold since before the financial crash of 2008
Trimmed $FB and $ROKU Tuesday and entered $DUST 1/10 starter size. Holds on Bitcoin at 9700.00, $ROKU, $FB, $GSUM, $SPXL, $JP, $SLCA, $INSY small on $AAOI, $SPPI, Gold short, $DUST and $OMVS micro size.
The USD Dollar is the most oversold since before the financial crash of 2008
Long $ROKU on Monday (still long – good trade so far), added to $SPXL and $GSUM. Holds on Bitcoin at 9700.00, $FB, $GSUM, $SPXL, $JP, $SLCA, $INSY small on $AAOI, $SPPI, Gold short and $OMVS micro size
I added 1/10 to $GSUM and $FB late Friday and trimmed 25% of $SPXL for a nice win and still hold 25%. Holds on Bitcoin at 9700.00, $FB, $GSUM, $SPXL, $JP, $SLCA small on $AAOI, $SPPI, Gold short and $OMVS micro size.
$ROKU daytrade yesterday for a win https://twitter.com/DayAlerts_CT/status/953636447889784832, also an oil daytrade for a win, and new long in Bitcoin at 9700.00. Holds on $FB, $GSUM, $SPXL, $JP, $SLCA small on $AAOI, $SPPI, Gold short and $OMVS micro size.
Opened 1/10 long $FB on Friday going well, 1/10 long $GSUM also (currently near flat) and per previous closed 50% of $SPXL long 2/10 sizing position and hold 50% for win, entered $JP long (1/10) and holding $SLCA, and in some accounts $AAOI, $SPPI, Gold short (all small) and $OMVS micro size.
Closed 50% of $SPXL long 2/10 sizing position and hold 50% for win, entered $JP long (1/10) and holding $SLCA, $AAOI, $SPPI, Gold short (all small) and $OMVS micro size.
Chart Set-ups on Watch:
Per recent;
$VIX over upper bollinger band creates excellent short side risk-reward. Use additional MACD signal. $TVIX $UVXY $XIV #volatility

Don’t look now but MACD turning up on $DXY US Dollar Index $UUP #swingtrading

$GDX in dangerous territory on 200 MA on Daily with MACD and SQMOM turned down. Bearish. $NUGT $DUST $JDST $JNUG

Gold hit mid quad resistance, broke thru, lost retest to downside, targets in play. MACD turn down. $GC_F $GLD $XAUUSD Feb 4, 2018

Oil resistance check. 50% Fibonacci, mid quad on monthly chart.. $USOIL $WTI $CL_F #OIL #OOTT $USO $UWT $DWT

$ARRY Weekly chart suggests long term structure needs price over 14.89 on weekly now thru after June 3 time cycle. If so, it is up. #swingtrading https://www.tradingview.com/chart/ARRY/EZbQb5F4-ARRY-Weekly-chart-suggests-long-term-structure-needs-price-over/ …
$ARRY Weekly chart suggests long term structure needs price over 14.89 on weekly now thru after June 3 time cycle. If so, it is up. #swingtrading https://t.co/CA9E9zdGU0 pic.twitter.com/fkUJzMFe9Q
— Melonopoly (@curtmelonopoly) February 1, 2018
$CDNA Had a significant pivot created on long term charting the week of Nov 6, 2017 at 5.80. Below is very bearish – bullish if it holds. Tested, held, testing again now. https://www.tradingview.com/chart/CDNA/f0zgaiG1-CDNA-Had-a-significant-pivot-created-on-long-term-charting-the/ … #swingtrading #charting
$CDNA Had a significant pivot created on long term charting the week of Nov 6, 2017 at 5.80. Below is very bearish – bullish if it holds. Tested, held, testing again now. https://t.co/rtxs7AGCSO #swingtrading #charting pic.twitter.com/jpfj7a3y3D
— Melonopoly (@curtmelonopoly) February 1, 2018
$AAOI The stock is trading 64% below last summer’s 52-week highs with earnings in 21 days I will be looking for a bounce. #earnings #trading

Buy sell trading triggers on simple $SNAP chart model have worked well. #swingtrading #charting https://www.tradingview.com/chart/SNAP/qJ0gRCyt-Buy-sell-trading-triggers-on-simple-SNAP-chart-model-have-worke/ …

$AMMJ Ammerican Cannabis buy sell triggers at white arrows for your swing trade. Triggers and targets have been spot on. #swingtrading

$AMD important levels to watch for trading earnings. Bull scenario targets first 14.95 and bearish 12.25 first #premarket

$AMBA on watch for short set-up in play premarket – under pressure here #swingtrading https://www.tradingview.com/chart/AMBA/U5yggomh-AMBA-on-watch-for-short-set-up-in-play-premarket-under-pressu/

Market Outlook:
Stock futures point to Dow drop of about 550 points at the open, S&P drop of nearly 50 points and Nasdaq drop of 85 points http://cnb.cx/2nGfgoo
Stock futures point to Dow drop of about 550 points at the open, S&P drop of nearly 50 points and Nasdaq drop of 85 points https://t.co/ErtDja9VdQ pic.twitter.com/kO178liK1L
— CNBC Now (@CNBCnow) February 6, 2018
What global policy makers are saying about the stock slide https://bloom.bg/2BGYqyd
What global policy makers are saying about the stock slide https://t.co/1BocZqtV1X pic.twitter.com/EMLPKtykfa
— Bloomberg (@business) February 6, 2018
#5things
-Stocks fall
-Volatility surges
-Bonds bid
-Commodities hit
-Cryptocrunch
https://bloom.bg/2BGtZsf
#5things
-Stocks fall
-Volatility surges
-Bonds bid
-Commodities hit
-Cryptocrunchhttps://t.co/6XXbff5j2Z pic.twitter.com/jF2gBtJ92x— Bloomberg Markets (@markets) February 6, 2018
Market News and Social Bits From Around the Internet:
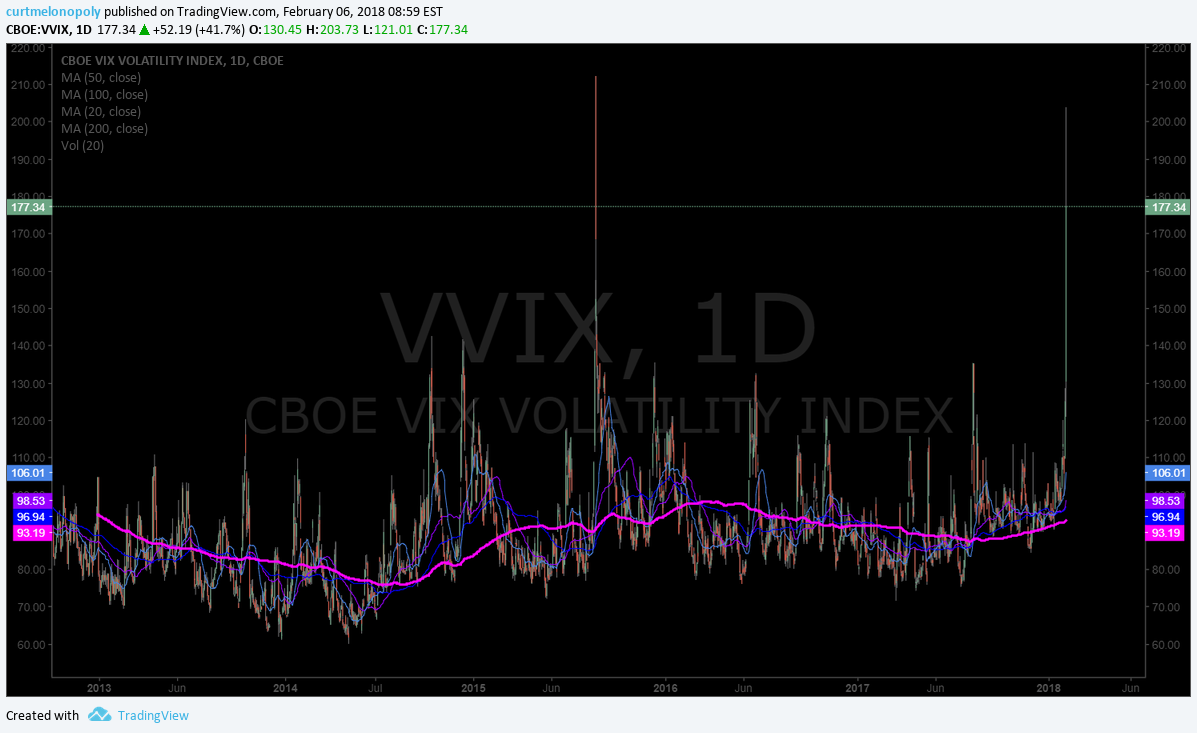
ChOTD-2/6/18 #3) Volatility Of VIX $VVIX: Highest Reading Ever
ChOTD-2/6/18 #3) Volatility Of VIX $VVIX: Highest Reading Ever https://t.co/UnDUUmeyIf
— Melonopoly (@curtmelonopoly) February 6, 2018
Stocks making the biggest moves premarket: GM, AGN, TPR, CNC, WCG, BDX & more http://cnb.cx/2BHwTN5
Stocks making the biggest moves premarket: GM, AGN, TPR, CNC, WCG, BDX & more https://t.co/og6l9T3vB9 pic.twitter.com/l2HGjpKFxq
— The Exchange (@CNBCTheExchange) February 6, 2018
Key measure of market volatility — the VIX — jumps above 50, highest level since Aug 2015 http://cnb.cx/2BK9Np6
Key measure of market volatility — the VIX — jumps above 50, highest level since Aug 2015 https://t.co/9QNCWfG4cs pic.twitter.com/CedPeP8JKY
— The Exchange (@CNBCTheExchange) February 6, 2018
Wall Street relearns a lesson as a favorite bet on volatility blows up http://cnb.cx/2BG3YsQ
Wall Street relearns a lesson as a favorite bet on volatility blows up https://t.co/ahmOGlx7pq pic.twitter.com/0C7YG0Du5n
— The Exchange (@CNBCTheExchange) February 6, 2018
If you are new to our trading service you should review recent blog posts, the Compound Trading YouTube Channel and at minimum our algorithm Twitter feeds because they do tell a story in terms of the market and how the inflections of the market determine our day to day trading. You will notice the algorithmic modelling has been undeniably accurate with many time-frames (intra-day, weeks and months out) so I myself have learned to respect their math (they have taken me from a 60% hit rate to 80%+ in my trading – all publicly posted live trades).
Momentum Stocks (Market Open and Intra-Day):
I do trade morning momo stocks, but I do avoid risk – so often I avoid the first 30 minutes (gap and go) and trade momentum stocks later in the day after the wash-out looking for a snap-back. Just prior to open and shortly after open I post momentum stocks to the trade chat room (and Twitter and Stocktwits if I have time).
Some of my Favorite Intra-day Trading Set-Ups:
(1) Momentum Stock Wash-Outs for Snap Back, (2) Bad News Wash-outs on Stocks with High Institutional Ownership, (3) Getting on the Right Side of a Trend Change and scaling in my position and (4) Our Algorithm Set-Ups.
The momentum stocks (from previous days and morning trade) I continue to watch through the day for indicators that allow a trade.
Morning Stock Watch-Lists for my Favorite Set-Ups:
(1) Pre-Market Gainers Watch-List: $UVXY, $TVIX, $VIIX $VXX $VIXY $SDOW $TZA $YANG $SOXS $LITE $SPXS $SPXU $DRIP $SQQQ $LABD $FAZ $DXD $SDS $DGAZ $QID $MU $DWT $OILD $SH $SCO $QCOM $NOK $GM
(2) Pre-market Decliners Watch-List :
(3) Other Watch-List:
(4) Regular Algo Charting Watch-List: Gold $GC_F $GLD, Miners $GDX ($NUGT, $DUST, $JDST, $JNUG), Silver $SLV $SI_F ($USLV, $DSLV), Crude Oil FX: $USOIL $WTI ($UWTI, $DWTI, $USO, $UCO, $CL_F, $UWT, $DWT), Natural Gas $NG_F ($UGAZ, $DGAZ), S & P 500 $SPY $ES_F ($SPXL, $SPXS), US Dollar Index $DXY ($UUP), Volatility $VIX ($TVIX, $UVXY, $XIV), $BTCUSD Bitcoin.
(5) Recent Upgrades: $ZG, $SWKS, $MU, $GRUB, $MTCH, $SWN, $RDFN
(6) Recent Downgrades:
Stay tuned in Stock Chat Room for more pre-market stocks on watch.
Study:
For new readers, a review of our unlocked posts on our blog would help you get in to the story we are following with the securities listed in this newsletter.
Free scanners to find momentum stocks that you can easily review charts of for indicators that bring probability of your trade being successful up considerably. These are not useful for first 30 minute market open gap and go type plays (you need a good momentum scanner, level 2, and best to have hot-keys for the first 30 mins of gap and go trading)… but are very useful for intra day scalping and swing trading (start with trending stocks and then look at indicators intra for simple set-ups – study scan study scan study scan).
http://finviz.com/
https://finance.yahoo.com/screener/predefined/ec5bebb9-b7b2-4474-9e5c-3e258b61cbe6
http://www.highshortinterest.com/
http://www.gurufocus.com/short-stocks.php
http://www.3xetf.com/all/
http://www.etf.com/channels/gold-etfs
GL!
Curtis
Algorithm Twitter feeds can be found here: $BTC (@CryptotheAlgo) $WTI (@EPICtheAlgo), $VIX (@VexatiousVIX), $SPY (@FREEDOMtheAlgo), $GLD (@ROSIEtheAlgo), $SLV (@SuperNovaAlgo), $DXY (@DXYUSD_Index). Our Swing Trading Twitter feed is found here: https://twitter.com/swingtrading_ct. Our lead trader Twitter feed is here @curtmelonopoly and lead tech developer @hundalSHS.
Article Topics: Premarket, Watchlist, Stocks, Trading, Plan, $VIX, $XIV, $VVIX, $XNET, $GSUM, $WKHS, $ROKU, $JP, $SLCA, $INSY, $SPXL, $SPY, $BTC.X, Bitcoin, Gold, $DUST, $WTI, OIL