Tag: Support
Oil Trading Room 200 Tick Intra Day Trading Strategy – How It Was Traded and Alerted (Video) Part 1 #OOTT $CL_F $USO $USOIL
Part 1 – Crude Oil Day Trade Strategy For 200 Ticks Win From Our Oil Trading Room – Step by Step Tips on How We Traded It and Alerted it Live
The main question for oil traders reading this and /or watching the instructional video should be, “How did we know that oil intra-day would most likely reverse where it did on the chart?”
The oil trading alert went out at 6:37 AM EST and the one prior to that was at 4:09 PM the day prior (Monday June 8, 2020), so it isn’t that we send out many alerts every day, we send our alerts only out when it is the most highly probable area of intra day trade for a win.
So why then at that time of day? What was happening with intra-day trade, the charting, time of day and with other signals that caused us to trade in size long at 6:37 AM EST today?
In short it was the only trade entry alert of the day, the trade was in size and it happened to be at the low price of trade on the day also.
Below are the secrets of this time tested oil trading strategy.
Important Tips for this Simple Intra-Day Crude Oil Trading Strategy
- Time of Day is Important – Today’s 200 tick oil day trade was started in the morning prior to US regular market open and after many traders around the world in different time zones (and overnight Futures traders) have finished their trading day.
- Chart Trend Lines – I teach students to always have classical charting trend lines for support and resistance ready at all times on all time-frames.
- Key Algorithmic Charting Levels – Not all oil traders have this at their disposal, but this was one key reason for our trade success today..
Time of Day.
Time of day when day trading crude oil is very important. In this trade example it was the time of day where overnight futures traders (as far as USA traders are concerned) usually finish their day as well as some traders from around the world also (depending on time zone) and day traders in the U.S. start their day.
When traders start and stop their trading day is not the only time of day consideration.
There are other time of day considerations such as regular U.S. open premarket, regular U.S. market open at 9:30 AM EST, daily settlement at 2:30 PM EST, weekly inventory statistics from the American Petroleum Institute at 4:30 PM EST Tuesday’s and U.S. Energy Information Administration (EIA) at 10:30 AM EST on Wednesdays.
Specifically as it applies to this intra-day oil trading strategy, this trade was taken when the overnight futures traders were typically finished “taking profits or losses” on their day trade sessions and the new batch of day trader liquidity was entering the market. VERY KEY. Again, today’s oil trade was first entered and alerted at 6:37 AM EST, in size.
Below is a screen capture image from our Oil Trading Room with the day trade execution at 6:37 AM for 6 contracts entered – adding to existing 6 contracts in the long position sequence of trade.
Also in the image are some of the alerts in the trading room as the trade progressed (this is the private member oil trade chat room in Discord, there is a live charting and mic broadcast room also).
You can also see in the image the lead trader discussing another time of day coming at 9:00 AM and to be prepared to watch the possible signals of oil trade at that specific time. Time of day in oil trading is one of the best signals oil day traders can use in their strategies.

Oil trading alerts screen capture of today’s oil trade that was first entered and alerted at 6:37 AM EST, in size.
Below is a screen capture of the actual oil trading alerts feed showing the lead tech alerting the buy in crude oil.

The broker platform trade executions by our oil machine trading algorithm are shown (screen shots) in this tweet:
Crude oil trading alert feed today, deep dive early in premarket for a great 200 point rally through the day.
#OOTT $CL_F $USO $USOIL
#oiltradingalerts #machinetrading
https://twitter.com/EPICtheAlgo/status/1270435771615510531
Trading Trend Line Support and Break Outs.
In today’s trading action there was a trend line support signal on the charting for the long position at 6:37 AM and the a trend line break later in the day for a break out to continue the rally.
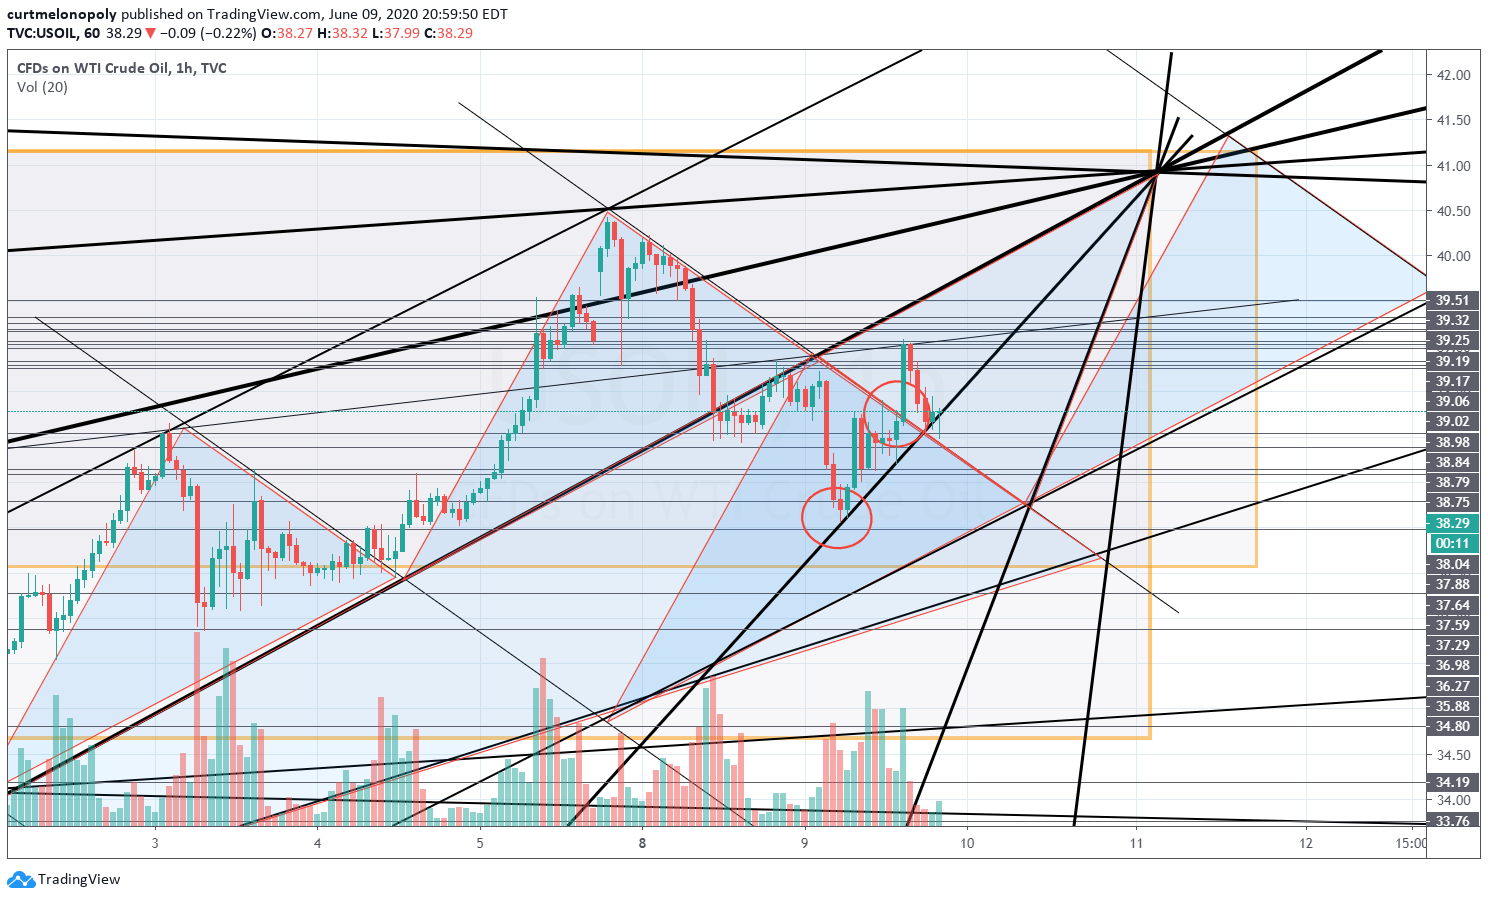
First, below see the initial support area of the trend line chart for the long trade entry. This signal is from a classical 1 hour oil chart with trend lines that included the mirrored fractal trading trend lines. This “mirrored fractal trend line” is where the signal was to enter the trade.
The one hour trading time frame is a significant oil trading signal because it is a larger than say a 1 minute, 5 minute, 15 or 30 minute chart timeline for daytrading. The one hour timing can be used also for intra-week trading signals.
The mirrored trend line fractal is a bit more than basic oil charting 101 in that it takes some technical analysis experience to learn, but not much and if you are an oil day trader it is a good skill to learn because the machine liquidity in the markets use mirrored fractals greatly.
You can see this technical charting skill helped garner a 200 point rally oil trade win today.
Crude Oil Trend line Chart, oil hit key support on the chart and this was one key signal for taking and alerting the trade.

And then later in the day came the trend Line resistance break out.
I marked the intra day oil trend line resistance break out area on the chart below with a second red circle.

I recently did a video instructional on oil trend line resistance break outs that explains the rules and tips for how to trade intraday break outs above a trend line resistance. It was identical to today’s set up and signals that produced this excellent win.
Here is an excerpt from that article:
Three Possible Trade Scenarios When Price Breaks Out;
1. The break out fails. This is possible so be sure to use stops or reverse your trade if the break out of resistance fails.
2. The break out succeeds and price keeps running without a retest of previous resistance (now support). If price does not come back to test support of the trend line then you have to be prepared to take the trade long and go with price action.
3. And finally, price breaks out of resistance and then comes back to retest the new support (which was previously the resistance of the trendline structure).
You can find Part 1 to the article with video tutorial here:
and
Part 2 for our premium members is here:
Trend line break outs, especially on larger time frame charting such as the one hour like with today’s trading are very powerful signals.
I even publicly gave my Twitter followers a bit of a heads up intra-day because I could see the trend line breach set up coming. My tweet went out at 11:30 AM and shortly after noon oil was in break out mode above the trend line resistance.
oil shorties could get wrecked here
oil shorties could get wrecked here
— Melonopoly (@curtmelonopoly) June 9, 2020
In Part 2 of this article we will take a look at how the swing trading strategies played in to this set up for our Swing Trade Alert service members.
In Part 3 for our Pro Oil Day Traders (Oil Trade Subscribers) we will look at the algorithmic charting structures that enabled this successful trade.
The video tutorial for this specific article (Part 1) is below.
As always, any questions please send me a note via email [email protected].
Thank you.
Curt
< Updated June 10 7:41 AM EST >
There is another classical charting reason possible for crude oil’s 200 Point reversal rally intra-day, Fibonacci level 50% was hit perfectly.
Nonetheless, there were strong algorithmic charting reasons for the reversal rally intra-day that I will go in to in more detail for our oil trader members in Part 3. Considering the machine trading liquidity in the oil trading markets I would weigh those indicators / signals much more greatly than the chart below.

Further Learning:
If you would like to learn more, click here and visit our Crude Oil Trading Academy page for complimentary oil trading knowledge – posts from our top crude oil traders that includes learning systems, blog posts and videos.
Welcome to NYMEX WTI Light Sweet Crude Oil Futures.
Subscribe to Oil Trading Platform:
Standalone Oil Algorithm Newsletter (Member Charting Reports sent out weekly at times in report form or updated on email regularly).
Real-Time Oil Trading Alerts (Private Twitter feed and Discord Private Server Chat Room).
Oil Trading Room Bundle (includes Weekly Newsletter, Trading Room, Charting and real-time Trading Alerts on Twitter and private Discord Chat Room Server).
Commercial / Institutional Multi User License (for professional trading groups).
One-on-One Trade Coaching (Via Skype or in person).
Article Topics; Oil, Trading, Alerts, Oil Trading Room, Strategies, Day Trading, Intra Day, Trend Lines, Break – Outs, Support, Time of Day
Swing Traders $STUDY Guide “Trading Down Trend-Line Break-Outs” ARCUS BIOSCIENCES Set-Up (Premium Part 2 of 2) #swingtradingreviews
Part 2 of 2: Swing Trade $STUDY Review on ARCUS BIOSCIENCES (RCUS) Swing Trade Alert Trading Strategy.
“Down Trending Resistance Trend Line Break-out Swing Trade”.
Below there are so many secrets to our swing trading success, in this article we look at the following areas of trading discipline for your trading plan:
- Determining bias according to market time-cycles,
- How to scan for swing trading set-ups,
- How to determine price extensions for realistic price targets,
- Support and resistance diagonal trend-lines, horizontal trend-lines, Fibonacci levels,
- How to manage execution of the swing trade set-up,
- How to manage trading stops, trade sizing, ebb and flow trade executions at support and resistance.
Part 2 of this analysis (below) is a Premium Member Only article and Part 1 can be found here;
Determining Time Cycle Bias for Your Trades.
Recently I wrote a few articles on the topic of time cycles in the markets using the Volatility (VIX) structured time cycles, this is a great place to start when determining first your bias of being bullish or bearish. In other words, should you be more focused on swing trades to the long or short side?
You can find Part 1 of the two part article here: How to Swing Trade Volatility $VIX Time-Cycles (UNLOCKED PT 1): Achieve Higher Gains in Stocks, Commodities, Indices, Crypto, Currencies and Theme Trades.
If the trajectory of market volatility is down (compressed) and you are more confident that volatility will be lower as you approach the next time cycle inflection then in most cases you would be bullish equities – this of course is just one example.
Alternatively you would be bias to the down-side for trading volatility so you may short $TVIX in this instance.
There are many ways to take advantage of the time cycles with various swing trades from Indices, Currencies, Crypto, Sectors, Stocks and more.
Just because the volatility is expected to rise or fall doesn’t mean however this should be the only determining factor when choosing theme trade set-ups, below is an example of just that with the ARCUS stock trade.
First, lets look at how stock scanning works.
How to Scan For Stock Swing Trading Set-Ups.
Good stock technical analysis knows before the news hits more often than not what the likely trade on each stock will be.
Technical analysis knows before the news hits because the stock will start to provide “tells” within the trade action of the stock and various technical points become clear.
So if you can know the TA of a specific stock better than most you have an advantage over other traders at all times because you can usually be ahead of the main part of the move.
Anyone, even the best fundamental traders would do better if they were also experts at technical analysis.
If the technical structure of the chart is suggesting a bullish move for example, you can then start to take small entries and build a position in expectation of a move.
The technical “tells” develop when insiders know something about upcoming news or even as geopolitical narratives are changing.
And then as you start to see specific technical trade patterns set-up in more and more equities you will find that this is a manifestation of the expert traders all beginning to bias their trades toward a theme usually within a sector, whether it be for a technical reason or a geo-political reason or perhaps some other fundamental or market sentiment reason.
If you get in “the pocket” right, you will find many set-ups during a period of time that will be almost identical and will provide excellent returns one after another.
This is what happened with our trading of the technical set-up in RCUS, many others were very similar during this time period in the markets and our returns increased rapidly.
I keep it simple and use Trading View for my scans.
On any given day, usually sometime after lunch I will open Trading View and click on the fire emblem on top right side of screen – this is your hot-lists of hot stocks on the day (see screen shot of my Trading View below). You can set the scanner in Trading View for various levels and parameters. I scan the running stocks with large gains, the losers and the OTC markets.

Then I simply open each chart (primarily scanning the hot stocks on the day) and I start with the weekly time-frame.
I’m looking for chart history or patterns of trade, chart memory or some semblance of chart history with some order. The simpler the chart patterns the better. Anyway, as you learn all the different set-ups this gets much easier and faster.
Every financial instrument I trade I make sure that it has a structure, some order is required or your trading edge is not increased.
When I find a chart set-up I like I open the chart and take a look at it on various time-frames and consider how to trade the stock, price targets and various support and resistance levels.
Then I look at things like incoming volume, company news, sector themes, geopolitical type things, look at insider buying or selling and various other research.
During the period of time we took the swing trade in ARCUS the trend-line resistance break-out trade was happening regularly and was providing excellent returns for 2 – 6x and even more in some cases wins.
When I Used the Scanner and Isolated the ARCUS Swing Trade Set-Up It Was Yet Another Trend-line Resistance Set-Up That Was Likely to Explode.
Below is the chart I found when scanning, it shows clearly the trend-line resistance set-up. The chart below is from one of the earlier swing trade alerts we sent out to members for this set-up. You can see the spike through the trend-line resistance (which occurred after the original alert).
You can clearly see the down-sloping trend-line in the chart on the alert.
This set-up was on high alert because this specific trade set-up was hitting one after another, if this was not the case I wouldn’t have been so keen on taking these trades.
you want to be where the wolf pack is
It is the theme that is important, you want to be where the wolf pack is, where all the other winning traders are. Just a winning set-up isn’t enough. Just a news event or a fundamental set up on its own is not the optimal scenario, you want to be where the flow is. This is critical.

And then as the trade progressed (after alerting the swing trade sometime earlier) the structure of trade was clear and it was just a matter of trading risk in ebb and flow (see chart below).
It is important to note that we cannot alert every pull back and add and trim, it isn’t possible, what we do is get our members started in a swing trade and then endeavor to alert the key trades (especially key areas of resistance) as it progresses. Our trader’s platform (automation for alerts) will solve this manpower issue, but really every trader should be planning their sizing and support and resistance adds and trims for profit based on their own account risk, risk tolerance, style and more. If you are just blindly following another trader this will not work for you.

Charting Price Extensions for Price Targets and Timing.
This can be more art than science and your price extensions and price targets may change as the price or timing of the stock price movements move along.
In the chart below you will see diagonal white arrows (3 of them). The angle is just a reflection of the down-slope (a mirror of the angle). The length of the price extension is simply a mirror of the down-slope trend from previous. So each of the 3 arrows trending up are equal in duration and price.
These are a simple way of taking a shot at the most probable price extensions.
One key note here is that often you will get 1.5 extensions or 3. Why I don’t know. If you look at the chart below that is how I determined my price target from 15.00 to 30.00 and in last weeks trade the price target was hit early.
You will also notice (in blue on chart) I drew in an Elliott Impulse Wave, but I do that more for fun to see if I can tell the exact future of the play, you can see in this instance I was close, but the bulls were more aggressive than I even thought they would be.

Support and resistance diagonal trend-lines, horizontal trend-lines, Fibonacci levels.
In the chart above the diagonal trend-lines (charted in advance of trend-lines being there) are determined by taking the down trending price action of prior and extending the the tops of each lower high as the stock traded down in trend. the angle of the trend-lines was simply determined by historical trade.
The horizontal trend-lines (thin grey ones on the chart) were determined by simply drawing horizontal rays at the highs in the previous downtrend then duplicating to create a grid. These are not that important, I use them to see if there is a grid to be had. Why? Because I’m looking for order or structure.
And then the Fibonacci levels are simply done using your Fibonacci retracement drawing tool between the key support (or bottom of chart) and the price extension top. And then you copy and paste it up for each key leg in possible future trade. I always chart the low and high as horizontal key support and run them straight across horizontally on the chart as grey or green as these represent key areas of support and resistance.
How to Swing Trade It – manage execution of the swing trade set-up: Starter positioning, trading stops, trade sizing, ebb and flow trade executions at support and resistance.
Usually, when price breaks the trend-line resistance to the upside this is your trigger to be at least on watch for your initial entry.
You need to determine how many entries you are prepared to take. Hopefully it is more than one and preferably up to 10. Here is why;
When price breaks out upside the trend-line you want to be able to take at least a starter right away because most traders will wait until price returns to the previous resistance now support for the test of support and then go.
Some will even wait for it to bounce and get higher than the previous candle. All methods are fine but if you’re in it to win it then I would suggest taking 1/10 size at each of those three triggers I just explained.
Why? Because sometimes price doesn’t come back to you. The stronger the theme, the stronger the market, the stronger the stock set-up the less chance it’s coming back to you and then you’re chasing it.
Now if you’re in 3/10 size or 30% size and your trade breaks down, you’re down on your trade but if you are winning 80% or better you can lose 10% 2 out of 10 times and win 30% or more 8 out of 10 times.
In the ARCUS example price never came back.
I look at every trade like a chess board, the more dot plots or entries and trims of profit the better, this is how we’re coding the 200 equities to trade under the machine trading program and how we’re coding the trader’s digital platform so members of our swing trade alerts will be able to see this real time. Until then, there is myself and three staff managing the numerous trades in various equities along with coding, alerts, newsletter publications and various other duties – hence the reason for coding automation.
Now, in the ARCUS example above you would have taken your starter 10 – 20% in size and it didn’t come back, what it did is it hit the first key resistance and then came back.
AT THAT RESISTANCE you need to trim 50% of your profit and then add to the trade at key supports in bits until it bounces and then continue with taking profits along the way at each key resistance.
Managing your trade size is critical. If you’re only going to be a one hit wonder, taking one entry for the win then you need to learn how to bring your charting down to a daytrading time frame so that you can execute your position on a lower time-frame of charting like a 5, 15 or 30 minute chart. I have an article coming on this discipline but in the meantime if you need to know how I do this ask me for a coaching session and I’ll show you.
Setting your stops is based on many things and this is why I don’t like publishing alerts with stops. This is determined by your experience (newer traders have to take more cuts because they don’t know what a prime set up is) so newer traders have to use hard stops religiously, I don’t because I know I can dot plot my way out of any trade as long as the stock isn’t destroyed by some black swan event.
In a black swan (market wide) I don’t worry because I’m in structured strong set-ups 90% of the time. If it’s not a strong set-up I’ll usually alert that or if its risky etc.
newer traders have to use hard stops religiously, I don’t because I know I can dot plot my way out of any trade as long as the stock isn’t destroyed by some black swan event
All of our trades we are sizing adds at support and trimming at resistance areas. There are many things that determine this also, such as market time cycles, market sentiment, sector sentiment, perhaps the technical set up is no longer being run by the bulls and many other factors.
False break-outs happen so you need to be prepared to take a loss, but when you get better at being able to determine key set-ups for all the reasons above and more you won’t be as concerned about that.
Other considerations technically speaking;
Most traders will wait for the current chart candle to close beyond the down-sloping trend-line resistance so they have a confirmed break-out, but remember, sometimes this won’t happen and a really bullish stock will just leave you in the dust.
Most traders will take their initial long starter position in the trade when the stock price has retraced back near or at the original trend-line, but again, this does not always happen and you can get left behind.
Most traders will set their stop just beyond failure of the trend-line but this can cause a trader’s account balance to be dwindled due to death by a thousand cuts.
The secret here is to not be most traders.
In this game if you are like most you will have like most (at best) returns, around 15% a year if you are lucky.
The traders that consistently post returns of 3, 4, 5 x or more per year are using a strategy that most do not.
What is that?
How did Wayne Gretzky explain how he played hockey? He had a knack at knowing where the puck was going to be so he went there.
“Skate to where the puck is going, not where it has been.”
— Wayne Gretzky
“Skate to where the puck is going, not where it has been.”
— Wayne Gretzky
— Melonopoly (@curtmelonopoly) April 26, 2020
Same thing here.
Below is one of many of my rants on the subject, on my personal twitter feed;
Great question RE: Bitcoin $BTC trade bull or bear cycles within the next two global market time cycles. #timecycles #trading https://t.co/2CAQIOjvxL
— Melonopoly (@curtmelonopoly) April 25, 2020
If you get good at what I am describing above you will always know in advance (with high probability) when the price of the stock is going to move that you are trading, so manage the risk between where it is and where it is going like a chess board and you will see returns of 3, 4, 5 x or more per year.
Any questions email me anytime at [email protected].
Thanks
Curt
Current List of Available P&Ls (remaining dates are in progress now to be released soon):
- Swing Trading Performance Summary (Q4 2019, Q1 2020 Interim): Return %, Gain/Loss, Win/Loss Rate, Number of Trades.
- Swing Trading Alert Profit Loss – Annualized ROI 1543.93% Feb 1-Feb 21, 2020. $200,000.00 – $230,051.00 #swingtrading #tradealerts
- Swing Trading Profit Loss – Annualized ROI 64.45% Jan 1 – Jan 31, 2020. $200,000.00 – $208119.00. #swingtrading #tradealerts
- Swing Trading Profit Loss – Annualized ROI 246.31% Dec 1 – Dec 31, 2019. $200,000.00 – $220,898.50. #swingtrading #tradealerts
- Swing Trading Profit Loss – Annualized ROI 315.32% Nov 1 – Nov 30, 2019. $200,000.00 – $224,130.16. #swingtrading #tradealerts
- Swing Trading Profit Loss – Annualized ROI 62.69% October 2019. $100,000.00 – $103,970.20. #swingtrading #tradealerts
- Swing Trading Profit Loss Annualized 355.22%. March 26 – June 28, 2017. $204,616.60 – $303,443.60. #swingtrading #tradealerts
- Swing Trading (Short Term Trades) Profit Loss Annualized 2,437.96%. April 3 – June 28, 2017. $17,354.69 – $37,713.16 . #swingtrading #tradealerts
- Swing and Day Trading Profit Loss – Annualized 957.90% Dec 26, 2016 – March 26, 2017. $100,000.00 – $180,347.88 . #swingtrading #tradealerts
Subscribe to Swing Trading Service:
Swing Trading Bundle (Swing Trading Newsletter, Live Swing Trading Alerts, Study Guides).
Swing Trading Newsletter (Weekly Newsletter Published for Traders).
Real-Time Swing Trading Alerts (Private Member on Twitter Feed and more recently by way of Email).
Swing Trading Study Guide Newsletters (After Trade In-Depth Reviews Including Set-Up Identification, Trading Plan, Sizing, Risk Management, ROI and more).
One-on-One Trade Coaching (Via Skype or In-Person).
Free Mailing List(s):
Join Email List for Free Trade Charting Trade Set-ups, Deals, Podcasts and Public Webinars.
Free Swing Trading Periodical Contact Form (Complimentary Swing Trade Set-Ups to Email)
Public Chat:
Visit our Free Public Chat Room on Discord.
Free Mailing List(s):
Join Email List for Free Trade Charting Trade Set-ups, Deals, Podcasts and Public Webinars.
Free Swing Trading Periodical Contact Form (Complimentary Swing Trade Set-Ups to Email)
Public Chat:
Visit our Free Public Chat Room on Discord.
Follow:
Article Topics; swing trading, swing trade review, study, stocks, alerts, set-ups, patterns, break-outs, themes, support, resistance, trendlines, sizing, stops, risk, technical analysis, Fibonacci, price targets, price extensions, strategy.
Part 2. Deep Dive Day Trading Signals Crude Oil Sell-Off, Reversals, Trend Trade | 1 Min Strategies (Premium)
Part Two: Deep Dive in to Day-Trading The One Minute Crude Oil Time-Frame. Short Selling Chart Structure, Price Reversal Intra-Day for Up Trend.
Part One of this Article is here Day Trading Signals for Crude Oil Sell-Off Shorting & Bullish Reversal | 1 Minute Chart | Oil Trading Strategies.
For this premium member post we will use this video (from part one) as a guide:
A Quick Explanation of Our Discipline.
We chart financial instruments using both conventional and algorithmic charting methods. Charted on all time-frames, we use up to fifty conventional indicators and back test charting up to sixty months. When complete, the algorithmic models then provide a structure of trade representing primary support and resistance areas, time cycle considerations and more. The process is ongoing with real-world testing and models are updated regularly.
Specific to crude oil, we now utilize eighteen proprietary algorithmic models (representing various time-frames). The models / data are used in our personal trading, distributed to internal members and commercial enterprise clients on regular rotation, broadcast live to our oil trading room, timely set-ups are shared to the private member Discord oil chat room and coded to our machine trading software.
This post deals specifically with one of eighteen models – the one minute time frame. And more specifically the sell off structure and reversal points that signal a trend change intra-day with crude oil trade.
The Structure of a Crude Oil Intra-Day Sell Off.
As explained in Part 1 of this post, crude oil sells off within a structure that is often very precise. Understanding the structure of trade can assist a daytrader in many areas of his/her trade management. This can include trade sizing, working the ebb and flow of trade up and down in price, setting stop orders, determining where, when and why to size in and hold and where to be cautious or not trade at all.
Learn From Our Machine Trade Development Process and Prior Trade Experience.
We, in our own development are dealing with these trade management considerations within intra-day trade. I myself as a day-trader can assess these indications or signals drawing on decades of prior experience, but this process becomes much different when you start coding software to trade crude oil.
When I am trading (as a person mechanically executing trades) I am using what I think is instinct and experience. But what exactly is that process? This is complicated to assess but is required when coding software to trade for you and is also important for any human trader to consider.
What I have learned is that I didn’t know anything about how crude oil really trades. I thought I knew, but I didn’t. And as we continue to develop software we continue to discover areas within trade on various time frames where machine liquidity has or is creating other points of structured trade that can be modeled. It is a very manually intensive process.
When you code software to trade a financial instrument such as crude oil futures it becomes an absolute discipline. It has to have an absolute rules-based system to execute trades (in our case our oil software now has near 4000 rules or instructions that it weighs against to make trade decisions). It is ones and zeros. There is no room for cognitive dissonance – no room for fooling oneself (more on this in a future post).
The main point is this, oil trade is very structured (there are times of day or week when it is loose but for the most part it is structured). It is structured because it is (in large part) machine liquidity that is trading crude oil intra-day – estimated to be well over 80%.
Commodity trading enters the age of digitisation.
Commodities Traders Increasingly Adopt Algorithms.
We are sharing our experience in the development of such software to assist human traders to be able to compete with that machine driven trade in oil (and we are providing data to other enterprise groups).
You will find that crude oil trades like no other and it does not trade the way conventional traders think it trades. The rules are in large part very different than what the average retail trader thinks.
We have recently completed coding software of the eighteen oil trade algorithm models (and our proprietary IDENT order flow software is fully in the code also). Last week we ran the software in real-world trade and finished cleaning the bugs from the code (we encountered ten and they weren’t nice to deal with – we had some intra-day draw-downs). We are now simply adding set-ups to the software (which equates to small updates vs large model code development) and we are also tweaking the software as we observe it trading real-time.
In other words, our development is largely done because all the models are in the software now and the trading sequences have all run which has allowed us to de-bug the software. Here forward we expect a much smoother ride with the software and I suspect that I as a human trader in crude oil will have a hard time competing with the software’s performance. In fact I would bet my life on it.
Why do I ramble on about this? Because a human trader has no other choice but to accept this reality if they are wanting to compete with the machines. Accepting this reality is step one. Step two is then developing a trading strategy based on what the machines are doing (the structure of the software) to compete and profit off the trade of crude oil.
I suspect that I as a human trader in crude oil that I will have a hard time competing with the software’s performance. In fact I would bet my life on it.
Back to Your Strategy. Lets Look at the Crude Oil Sell-Off Structure, Intra-Day Price Action and How to Trade the Signals Within the One Minute Chart Model.
Be sure you have read part one of this article, many of the intra-day oil trading strategy points of reference are explained in more detail at that post also.
Structure of the Financial Instrument is Key. Knowing the algorithmic structure (and conventional charting) for the time-frame you are trading (and preferably for all time-frames) is key to your success. This structure then becomes your point of reference (map / GPS / playing field) for developing your strategy (it is the structure that the machines are trading within).
The one minute model structure – the support and resistance lines and indicators include;
- The trading range is shown on the chart as a thick horizontal dotted line with a red dotted line and a blue dotted line on either side of the white. When trade is very predictable this becomes important for support and resistance, especially in a squeeze set-up.
- The other horizontal white lines are support and resistance points to consider – the thicker the line the more important they are in trade strategy consideration.
- The down-sloping (down-trending) yellow dotted lines (thin) are the least in consideration, but are often included on the chart for our reference.
- The up-sloping (up-trending) yellow lines are to be considered as support and resistance during predictable (high volume) trading periods as support and resistance in sell-offs.
- The up-sloping (up-trending) white lines are decision lines, or you could look at it as indecision areas of trade. When trade is deciding to continue down (the yellow lines) or continue or reverse up (the blue down-trending) lines (see next point below).
- The down-sloping (down-trending) blue lines are to be used as support and resistance when trade is bullish (again, as with all, these are more predictable in high volume periods of trade).
- It is important to note that the lines are proprietary algorithmic calculated trend-lines (calculated based on historical trade).
- And also of note, the lines are hand drawn “on-the-fly” by our lead trader or a staff member as time allows and sent out to clients, be aware that errors are common. We expect to have proprietary software in future for our clients that will minimize these issues.
- Indicators include the 20 MA, 50 MA, 100 MA, 200 MA, VWAP, price and volume. You can double tap the field area of the chart to access Stochastic RSI, MACD and Squeeze Momentum Indicator.
Below is a screen shot of the one minute crude oil day-trading algorithmic model.
Direct links to the chart models are emailed to members in small group batches or for individual or commercial use. Please let us know if you are using more than one device to access the charting to assist us in dissemination of the model links.

Other Chart Time-Frame Support and Resistance Matter. You need to be aware of all primary time-frames. You need the conventional charting trade set-ups that are in play at your disposal and the algorithmic structured models. The primary time frames we use are the one minute, 5 minute and 30 minute charting. We also use 15 minute, 60, 240, daily, weekly and monthly – often.
Knowing where the primary support and resistance are on the other time frames will provide clues to possible points of intra-day price reversal and / or points to trim your short or long positions.
Below is a recent example showing a close up of the one month oil model. Trade was recently near an important area of resistance on the one month model. The trader should then to develop a sound strategy look to the weekly, daily, 240 minute, one hour, 30 minute, 15 minute and 5 minute models to confirm price is breaking down at that resistance level and trade it on the one minute time-frame intra-day.

And below on the thirty minute chart (as another example) trade was testing key resistance and then systematically sold off through the model. It continued below and a deep sell off ensued.
This resistance area (as shown) as being key could be confirmed as such on all the models.
For us in the back-office this was very frustrating because we had just finished coding the eighteen models to the new version of software and the old version was 20% short crude oil and when we loaded the new software the old was shut down and the positions were closed.
The old software (had we left it to trade the sequence) would have had a considerable gain trading the full range of the sell-off because the full range of the sell off was coded to the prior software. But unfortunately that is how it goes when you are developing. Thankfully the eighteen model version is our last for crude oil and only small tweaks and set-up updates will occur.

One other example, and there are many (a simple screen shot from my Trading View account), is a 15 model chart provided to members on May 19 before the massive sell-off started showing the key resistance and the full trading range for their trading strategy – this was a premium set-up.
It wasn’t long after this the sell off took the oil price even lower than key support.
This was also when we loaded the new software (prior to the sell off), frustrating to say the least because we were de-bugging very large new version software instead of enjoying the harvest of the set-up (never again).

Increased Volatility Within Intra-Day Trade Structure. The price action of an intra-day crude oil sell-off is volatile (actually, the price action at certain points within the model has more velocity) and yet price is more precisely structured than at most other areas of trade.
When price falls out of the yellow line support you can short to the next yellow line support. However, the better or preferred method is to short in the sequence of trade as price bounces in to resistance.
Either method is okay (the shorting in to resistance is better) and both need to be harnessed in discipline. Discipline to cut your position when you are wrong.
Knowing where / when you are wrong is key – close your position fast and take a small loss.
In the image below of the one minute model during recent sell off trade action you see the following;
- First trade fell through the blue bullish buy trade signal (top left of screen burgundy arrow) signalling no intra-day reversal in play yet and you can continue in a short selling position.
- Price of oil then fell through the yellow line support (pink arrow) which is used as support in a sell-off for your trade strategy. So if you did trim your short in to that yellow line support from your previous short you could now add some again (below the yellow line) and look toward the next yellow line as a possible support in the sequence.
- Price then continued in the trade sequence right through the next blue line (bull buy line signal) and in to the next sell-off sequence support area (signalling time to trim and cover or close), shown with the down trending green arrow on chart.
- Price then bounced at the yellow line (white arrow) and went straight to the resistance line (just under the previous short confirmation line) and was also a resistance test of the 20 MA (blue arrow) – this was an ideal area to short again. Knowing that you are wrong is if price did not stop there and continued up to breach the previous yellow support / resistance line (pink arrow).
- Price then sold off again dropping two floors to the 57.30 s – it then over shot the support of the yellow line (which often signals a near term trend reversal). Whenever price over shoots a key resistance or support line during active trade be sure to use caution because this is often a near term reversal point.
- The area circled in white is the consolidation area of trade (hitting all kind of trend lines) before confirming the reversal in trade intra-day in crude oil.
- The red arrow shows a clear confirmation bull buy bounce at a buy trigger for uptrend and the yellow arrow shows price breach a bullish part of the sequence for further confirmation that an intra day reversal in price is now in play. Additionally all the moving averages have now been breached by price action.

Precise Support, Resistance and Decision Areas. When the price of oil sells off it drops violently but stops at the next algorithmic support (yellow lines) with near precision almost every time. The opposite is true when it is trading in an intra-day uptrend (the blue lines). When price is indecisive it will use the white trend lines more and also perhaps the other support and resistance lines on the chart model. You can see example of this in the chart above.
Various Decisions at Support in Trade. When the sell-off stops at support it then will possibly bounce testing a variety of resistance points, stall and trade near support or violently drop to the next support in the sell-off sequence.
Determining Trend-Reversal and/or Low of Day Price. At points in the sell-off there are then indications of a near term bottom or trend reversal that may develop.
Some clues for a near term bottom and possible intra-day price reversal include (as noted above) overshooting support with immediate buy programs kicking in sending price higher, inter trend bounces in price that may become higher and higher or price may predictably start firing off (or respecting) decision areas of the model or bullish support and resistance decisions within the model (this is also shown in the oil chart above).
Time of day and time cycle decisions become important (see below) as does order flow volume (and more specifically who is in the trade, the velocity of the volume, when the volume is coming in and where on the model the volume is).
There are other signals to watch for also when expecting that an intra-day low has been put in or a trend reversal in price has occurred (more in a near future post specific to this topic).
Sell-Off Trends, Bullish Trends, Indecision Areas of Trade. The structure in sell-offs intra-day, in bullish trends and during decisions is different. Each use their own area of support and resistance points of structure (as explained above).
Time of Day Considerations and Important Dates. When trading crude oil you need to know when the various global regular market exchange sessions start (how premarket and open price action typically affects the price of oil) and how these various markets affect price action.
For example, during early futures trading, very little machine trade is active. This causes machine trade predictability to be “sloppy” or “loose”. Conventional indicators should be weighted heavier until machine liquidity starts to increase (normally around 3 am Eastern time).
Holidays such as the US Memorial Day holiday is another example of low liquidity in the crude oil futures markets – machine trade and model precision can be less than optimum also.
Machine liquidity will however “kick-in” if there is a news event that causes considerable action in trade. Holidays can be very “loose” also and “slippage” within models is common.
The daily US crude oil settlement at 2:30 Eastern, Tuesday 4:30 crude oil API report, Wednesday API report are also important times of trade to understand. Volatility can be extreme during these events and unless you are sizing your trade minimally or are an expert you may want to close out well before and re-enter any intra-day trading after the event (swing trades and longer term trend trades may not have consideration toward these times of the week).
Regular premarket action and market open action is important if you are daytrading crude oil. Understanding how the regular market price action works, where important support and resistance areas are and where important time cycle decisions are on various time-frames becomes very important for a day trader.
In all scenarios, especially in active trade, the one minute model can be used to assess and deploy your trading strategy minute by minute.
Time Cycles. Time cycles are critical. There are time cycles on all time frames of trade. For example, on the 5 minute model you will notice as trade nears a time cycle peak (represented on the 5 minute chart as a vertical green line) that trade will usually more aggressively trend toward a support or resistance.

On the 30 minute crude oil EPIC model the time cycles are highlighted as Tuesday 4:30 API, Wednesday 10:30 EIA Report and Friday 1:00 Est Rig Count.
In Part One of this report I highlighted the time cycle on the one minute chart (pointing out where two or more trendlines meet price) and you could see the result of that price target (or time cycle). A time cycle is a commonly used area of price target trade for the machine programming to use in probabilities of crude oil trade.

There are many, many examples of time cycles in trade (so many I cant include them all in this article). I will endeavor to continue sharing such information as time allows in the oil trading chat room on Discord (as I have for some time, reviewing previous signals and guidance in the chat room is wise for newer members). I will also continue to post what we learn about the time cycles as they apply to crude oil trade on the various models in future articles.
Members / clients can also review previous EPIC Oil Algorithm posts on our website by clicking on the blog section and then selecting the EPIC posts link.
Know When to Trade a Bounce at Support or Resistance. Knowing how to time your entry specific to probability of success is very important. For example, when trade is selling off you would watch each bounce very carefully. How many ticks was the bounce and is the range increasing? Is the volume / order flow increasing at each support? Is there evidence of a final take-out of stop orders? A final slam down of price under the support and a vicious reversal is a common reversal trade set up in crude oil.
Machine Price Targets. Knowing where (and why) the price targets are for machine trade is on each time frame can help with your trading strategy. Where two or meet price.
Moving Averages. We often cover in the live oil trading room how moving averages determine price action during trade each day. Moving averages affect trade action differently on different time frames and at different areas of each structure. Here also more articles coming. For now, the most important consideration is that moving averages should be considered in your trade strategy as support and resistance within the time frame you are trading. You should also be aware of moving average support and resistance on various time frames (more than just the time frame you are trading) so that you are aware of any critical decisions on the near term horizon when daytradingc crude oil.
Trade Sizing. Obviously trade sizing should be more considerable at range area support and resistance. You can leg in to these moves and typically find considerable profit for your annual returns in these areas of trade. Daytrading should find your sizing to be on the low side. I will be writing very detailed articles soon on this topic as we refine our machine trade software. I also intend to share some of this information live in the oil trading room on a regular basis near terms.
Sizing your daytrading orders should be small as I mentioned, however, if you get good at timing the reversals in trend this can allow you to size in to those intr-day trends. I highly encourage daytraders to focus on the reversals. I have written some posts on the topic but intend to focus on reversals and trade sizing in the very near term both in writing and in the main trading room (posting videos etc also).
Daily Trend Signals (Following the Trend Intra-Day).
Intra-day trend for daytraders in crude oil is critical to lock in (it is also for our machine trade coding).
We have recently (as I mentioned) finished coding the 18 models (which was the biggest part of the heavy lifting – we have the structured models designed, tested in real world and coded). Also critical was order flow, we have that done. Next critical are the “set-ups” so that a daytrader or the software then knows what set-up intra-day is in play.
More specifically (for this post) the intra day trend of trade signal is critical. Knowing where the reversals are likely to take place, when they have occurred (confirmation) or even where continuation is taking place and then being able to size in to that trend in a predictable yet low risk way is really, really important for an oil daytrader.
This specifically will be our near term focus for our members, enterprise clients and our software development “tweaks” as one of the primary main focus set ups to be coded. I can’t over-emphasize its importance to your ROI.
You will find our focus specific to this over the coming days in the trading room, on Discord and in articles I provide members.
Below is an image that provides a clear example from today’s trade action in crude oil futures (on the Memorial Day Holiday Monday). The price moved 100 points from 58.22 at 9:00 AM this morning to 59.22 at near 2:30 as of time of writing.
Our machine software did not fire on the trade for numerous reasons (even though the trend was clear, it was confirmed structure on the 30 min EPIC model, it was firing off the blue support and resistance on the one minute model etc).
The software primarily did not fire because the liquidity was not in trade today for the software to confirm the trade.
So this is a clear example of the importance of having the trade set-ups also programmed to the software and giving the set-ups appropriate weight in the code vs. model structure and order flow. This is also very important for the human daytrader executing manual trades.
You will find that most days, at important support and resistance areas of the primary models confirmed at important time of day of trade that a trend for an excellent intra-day trade within your daytrade strategy is not only possible, but we believe highly probable to execute on a high percentage of days.
Trend following intra-day will be (as I’ve said) a very very high focus point for us near term (and the subsequent sizing etc).

In closing I’ll say that we’ve come a long way, it hasn’t been an easy grind up but we’re doing it one step at a time. I really appreciate you coming along with us on this journey.
If you have any other ideas or things you have learned in your own trading regarding this article please send me an email at [email protected] or shoot me a note if you have any questions etc. As I mentioned earlier in this post I will email the links for models independent of this article and the weekly EPIC reporting (in case you didn’t know) will be out Tuesday due to the Memorial Day Holiday to allow for the chart data to reset for the week before we run the chart models.
Have a great week traders!
Curt
Further Learning:
If you would like to learn more, click here and visit our Crude Oil Trading Academy page for complimentary oil trading knowledge – posts from our top crude oil traders that includes learning systems, blog posts and videos.
Welcome to NYMEX WTI Light Sweet Crude Oil Futures.
Subscribe to Oil Trading Platform:
Standalone Oil Algorithm Newsletter (Member Charting Updates Distributed Weekly).
Real-Time Oil Trading Alerts (Oil Trade Alerts via Private Twitter Feed and Discord Private Chat Room).
Oil Trading Room / Algorithm Newsletter / Alert Bundle (Weekly Newsletter, Trading Broadcast Room, Chat Room, Real-Time Trade Alerts).
Commercial / Institutional Multi User License (for professional trading groups).
One-on-One Trade Coaching (Via Skype or in person).
Click here to find all information and pricing on Oil Newsletter, Trading Chat Room, Oil Alerts and more.
Curtis Melonopoly (@curtmelonopoly) is rated Top 250 Stock exchanges authority, covering also Mathematical finance and Economy of the United States
Article Topics: Day Trading, Crude, Oil, Trading, Trading Room, Strategy, Signals, Shorting, Support, Resistance, Reversals, Trend Following, Trending, USOIL, WTI, CL_F, USO
Follow:
How to Trade the Tesla Move | Price Targets | Buy Sell Triggers | Time Cycles $TSLA #swingtrading #daytrading
Here’s How We Are Trading The Impending Tesla Stock Move in the Markets
Tesla stock has been a wild ride lately and with earnings scheduled after market May 2, 2018 this should be an excellent trade (either way).
Below is a trading plan for trading Tesla up or down with price targets, support and resistance levels, buy sell triggers and time cycle peaks. But first… a few announcements on what’s new at Compound Trading!
What’s New!
April Sale On Now! 10 Promo Codes Per Select Items Only – 30% Off. Sale items end April 30, 2018 or if the Promo Code limit for the specific item has been reached (10). If there is no sale price beside the item listed the maximum promo codes have been used. Click here for available Promo Codes.
Interested in free swing trading setups? Click here to sign up for the Complimentary Swing Trading Report Mailing List.
Information about our next trade coaching event May 4, 5, 6 can be found here Trade Coaching Boot Camp.
Now available for serious traders – Legacy All Access Membership.
24 Hour Crypto Trading Desk opens May 2018 along with our Coding Algorithm Models for Machine Trading. Formal announcements to follow.
Tesla Trading Plan
I have been posting this trade set-up for some time, and we have done well with the trades since. But here forward it could get even better. Here’s a post from April 4, 2108 on Trading View that details the Tesla trading chart structure.
Earnings catalyst:
Here’s the Nasdaq website link for Tesla earnings: Tesla, Inc. is expected* to report earnings on 05/02/2018 after market close. The report will be for the fiscal Quarter ending Mar 2018.
About Tesla:
For those that need to know a little about the company Tesla, here is the Wikipedia Tesla page link: Tesla, Inc. (formerly Tesla Motors) is an American company that specializes in electric vehicles, energy storage and solar panel manufacturing based in Palo Alto, California.
And Here is Why Tesla Could Be A Historic Trade Opportunity.
Tesla is bar none the most hated stock on Wall Street.
Tesla has the highest short interest of any major company. As I write, more than 30% of Tesla’s float is being shorted – up significantly in the last two weeks. That’s an utterly massive level of shorting for a stock with a $47 billion market capitalization. Simply put, being short Tesla is a very crowded trade right now.
And shorts are making a very big mistake.
That is a quote from this article; The Biggest Mistake Tesla Short Sellers Are Making Right Now.
And the writer could be right!
And there is a never ending array of news coverage on the Tesla story as we lead up to earnings…
Musk’s ‘no new capital’ promise faces scrutiny when Tesla reports results
Either way, our job as traders is to trade price action, so below is your technical chart set-up to trade Tesla either way for massive profit!
Here’s your technical chart set-up for trading Tesla $TSLA.
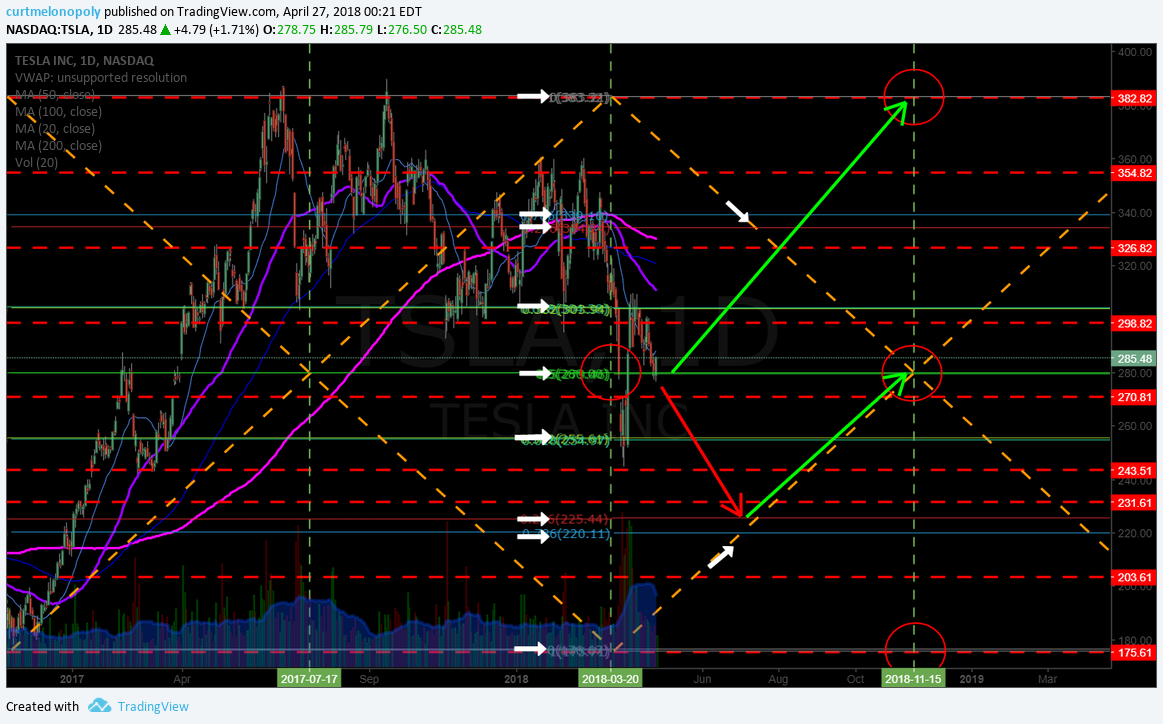
$TSLA closed April 26 at 285.48.
This set-up is a long over 280.00.
Your next major resistance is at 303.90 so be sure to trim longs in advance of that and then if resistance is breached add over that to the next resistance and then rinse and repeat. The horizontal fib lines on the chart show you support and resistance points. Also of note are the red dotted horizontal lines, they are also support and resistance lines, they represent historical support and resistance levels that can affect trade – pay some note to them also.
If 280.00 support (which is the main pivot in this trading range… mid trading quad support) then look to support at 255.60. If you’re short you will want to start covering in advance of trade getting to 255.60. If that is breached to the downside then add to your short and trim in advance of the next support on the chart.
I’ve made the chart easy to manage visually by adding white arrows to each major support and resistance level. The white arrows are your primary buy sell triggers. Note also the white arrows at the “trading quad walls”. These are Fibonacci based trend-lines that form a trading structure “quadrants”. They also act as support and resistance.
The red circles are price targets. The price targets for Nov 15, 2018 are 383.00 (bullish), 280.00 (moderate), 175.00 (bearish). Trade in accordance to price action toward the appropriate target. It is paint by numbers trading – just follow the rules and if your trade fails be sure to cut losses quickly and be ready to turn with price as needed. Trust the plan.
Here’s your technical chart set-up for trading Tesla $TSLA.

Here’s your technical chart set-up for trading Tesla $TSLA. by curtmelonopoly on TradingView.com
In Closing:
A few hours of trade coaching or study on exactly how to trim in to resistance and how to add to your positions on winners and how to cut losses properly and quickly will return huge dividends.
You can subscribe to our Weekly Swing Trading Newsletter service here, use temporary Promo Code “30P” for 30% off Reg 119.00 Sale Price 83.30.
Or click here to subscribe and get 30% off Real-Time Swing Trading Alerts Reg 99.00 Sale Price 69.37 use temporary Promo Code “Deal30” for 30% off.
I personally guarantee our swing trading service is one of the best in the business and it’s very reasonably priced considering the technical expertise invested in the platform.
Good luck with your Tesla trade and if you need any help message me anytime!
Peace.
Curt
Recent Trading Set-Up Review Webinars and Blog Posts
Oil Member Trade Alert Blog Post. Password “LONG” – Protected: Overnight Oil Trade | Trading Plan in Detail | EPIC Oil Algorithm $USOIL $WTI $CL_F #OIL $USO #Alerts
Swing Email Subscriber Blog Post – Trade Set-Ups $SPY, Gold, $GC_F, $GDX, Bitcoin, $GOOGL, $EVLV, $HEAR, $CHEK, $MARA, $PRTA, $ZDGE
Trade Set-ups $SPY, $NFLX, OIL, $WTI, $ESPR, $GOOGL, Bitcoin, $BTC, $FEYE, $AAPL and more.
Trading Set-Ups $SPY, Gold, $GC_F, $GDX, Bitcoin, $GOOGL, $EVLV, $HEAR, $CHEK, $MARA, $PRTA, $ZDGE
Trading Set-Ups $NETE, $TSG, $ETH Ethereum, $BTC Bitcoin, $TAN, $HEAR, $AMMJ, $SNAP, $VLRX
Trade Set-Ups OIL, $WTI, $SPY, $GOOGL, $FSLR, $AXP, $GREK, $CELG, $AAOI, $SDRL, $WFT
Register to free email list for trade set-ups, webinars, special events: https://compoundtrading.com/contact/
Website: https://compoundtrading.com
Free chat room: https://discord.gg/2HRTk6n
Subscribe: https://compoundtrading.com/overview-…
Twitter: https://twitter.com/CompoundTrading
Lead Trader: https://twitter.com/curtmelonopoly
Tradingview: https://www.tradingview.com/u/curtmel…
Facebook: https://www.facebook.com/compoundtrad…
StockTwits: https://stocktwits.com/compoundtrading
Email: https://[email protected]
Compound Trading Platform: Algorithm model charting for $SPY, $VIX, #OIL, #GOLD, #SILVER, #Crypto ($BTC Bitcoin, $ETH, $LTC, $XRP,) $DXY US Dollar and Swing Trading Newsletter. Live trading rooms for daytrading and oil traders. Private coaching and live alerts.
Article Topics; TESLA (TSLA) CHART. How to Trade TESLA, $TSLA, #swingtrading #daytrading