Part 1 – Crude Oil Day Trade Strategy For 200 Ticks Win From Our Oil Trading Room – Step by Step Tips on How We Traded It and Alerted it Live

The main question for oil traders reading this and /or watching the instructional video should be, “How did we know that oil intra-day would most likely reverse where it did on the chart?”

The oil trading alert went out at 6:37 AM EST and the one prior to that was at 4:09 PM the day prior (Monday June 8, 2020), so it isn’t that we send out many alerts every day, we send our alerts only out when it is the most highly probable area of intra day trade for a win.

So why then at that time of day? What was happening with intra-day trade, the charting, time of day and with other signals that caused us to trade in size long at 6:37 AM EST today?

In short it was the only trade entry alert of the day, the trade was in size and it happened to be at the low price of trade on the day also.

Below are the secrets of this time tested oil trading strategy.

Important Tips for this Simple Intra-Day Crude Oil Trading Strategy

  • Time of Day is Important – Today’s 200 tick oil day trade was started in the morning prior to US regular market open and after many traders around the world in different time zones (and overnight Futures traders) have finished their trading day.
  • Chart Trend Lines – I teach students to always have classical charting trend lines for support and resistance ready at all times on all time-frames.
  • Key Algorithmic Charting Levels – Not all oil traders have this at their disposal, but this was one key reason for our trade success today..

Time of Day.

Time of day when day trading crude oil is very important. In this trade example it was the time of day where overnight futures traders (as far as USA traders are concerned) usually finish their day as well as some traders from around the world also (depending on time zone) and day traders in the U.S. start their day.

When traders start and stop their trading day is not the only time of day consideration.

There are other time of day considerations such as regular U.S. open premarket, regular U.S. market open at 9:30 AM EST, daily settlement at 2:30 PM EST, weekly inventory statistics from the American Petroleum Institute at 4:30 PM EST Tuesday’s and U.S. Energy Information Administration (EIA) at 10:30 AM EST on Wednesdays.

Specifically as it applies to this intra-day oil trading strategy, this trade was taken when the overnight futures traders were typically finished “taking profits or losses” on their day trade sessions and the new batch of day trader liquidity was entering the market. VERY KEY. Again, today’s oil trade was first entered and alerted at 6:37 AM EST, in size.

Below is a screen capture image from our Oil Trading Room with the day trade execution at 6:37 AM for 6 contracts entered – adding to existing 6 contracts in the long position sequence of trade.

Also in the image are some of the alerts in the trading room as the trade progressed (this is the private member oil trade chat room in Discord, there is a live charting and mic broadcast room also).

You can also see in the image the lead trader discussing another time of day coming at 9:00 AM and to be prepared to watch the possible signals of oil trade at that specific time. Time of day in oil trading is one of the best signals oil day traders can use in their strategies.

oil trading room, alert for trade

Image from Oil Trading Room with day trade execution for 6 contracts added to existing 6 contracts long #oiltradingroom

Oil trading alerts screen capture of today’s oil trade that was first entered and alerted at 6:37 AM EST, in size.

Below is a screen capture of the actual oil trading alerts feed showing the lead tech alerting the buy in crude oil.

oil trading alert

Oil trading alert screen capture of today’s oil trade that was first entered and alerted at 6:37 AM EST, in size. #oiltradingalerts

The broker platform trade executions by our oil machine trading algorithm are shown (screen shots) in this tweet:

Crude oil trading alert feed today, deep dive early in premarket for a great 200 point rally through the day.

#OOTT $CL_F $USO $USOIL

#oiltradingalerts #machinetrading

Trading Trend Line Support and Break Outs.

In today’s trading action there was a trend line support signal on the charting for the long position at 6:37 AM and the a trend line break later in the day for a break out to continue the rally.

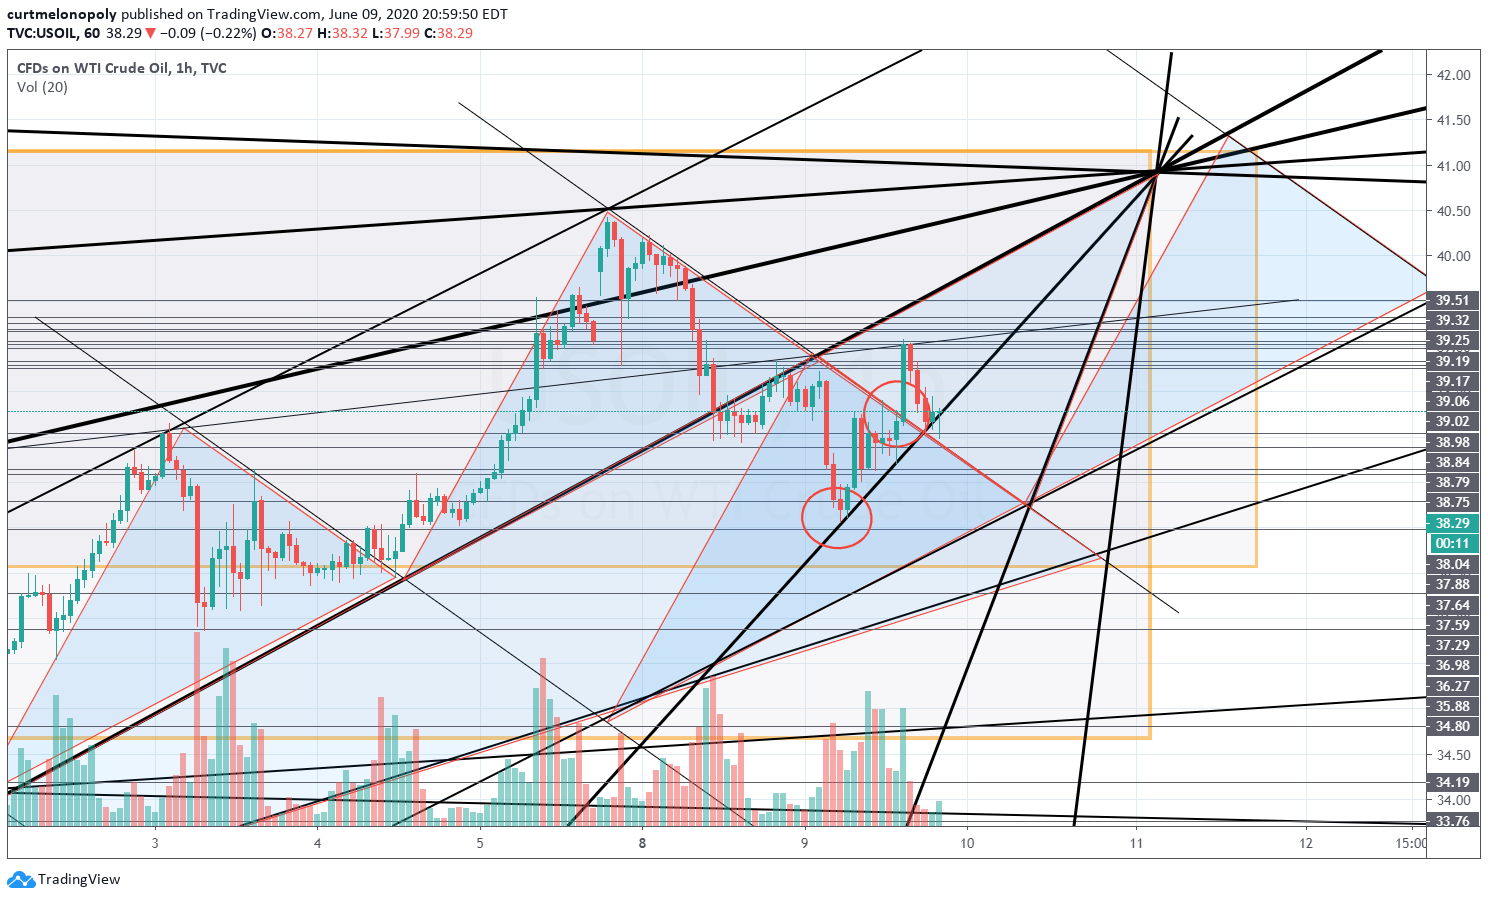
First, below see the initial support area of the trend line chart for the long trade entry. This signal is from a classical 1 hour oil chart with trend lines that included the mirrored fractal trading trend lines. This “mirrored fractal trend line” is where the signal was to enter the trade.

The one hour trading time frame is a significant oil trading signal because it is a larger than say a 1 minute, 5 minute, 15 or 30 minute chart timeline for daytrading. The one hour timing can be used also for intra-week trading signals.

The mirrored trend line fractal is a bit more than basic oil charting 101 in that it takes some technical analysis experience to learn, but not much and if you are an oil day trader it is a good skill to learn because the machine liquidity in the markets use mirrored fractals greatly.

You can see this technical charting skill helped garner a 200 point rally oil trade win today.

Crude Oil Trend line Chart, oil hit key support on the chart and this was one key signal for taking and alerting the trade.

oil trade alert, chart, trading room

Crude Oil Trend Line Chart, oil hit key support on the chart and this was one key signal for taking and alerting the trade #oiltradealerts

And then later in the day came the trend Line resistance break out.

I marked the intra day oil trend line resistance break out area on the chart below with a second red circle.

trendline, resistance, oil trading strategy

I marked the intra day oil trend line resistance break out area on the chart below with a second red circle.

I recently did a video instructional on oil trend line resistance break outs that explains the rules and tips for how to trade intraday break outs above a trend line resistance. It was identical to today’s set up and signals that produced this excellent win.

Here is an excerpt from that article:

Three Possible Trade Scenarios When Price Breaks Out;

1. The break out fails. This is possible so be sure to use stops or reverse your trade if the break out of resistance fails.
2. The break out succeeds and price keeps running without a retest of previous resistance (now support). If price does not come back to test support of the trend line then you have to be prepared to take the trade long and go with price action.
3. And finally, price breaks out of resistance and then comes back to retest the new support (which was previously the resistance of the trendline structure).

You can find Part 1 to the article with video tutorial here:

Simple Crude Oil Intraday Trading Strategy – Trading Bullish Trend Line Resistance Break-Out. #OOTT $CL_F $USO #CrudeOilTradingStrategies

and 

Part 2 for our premium members is here:

Protected: What’s Next? Crude Oil Trading Strategy – Trading Trend Line Resistance Break-Outs (PREMIUM, Part 2) #CrudeOil #TimeCycles #OOTT $CL_F $USO

Trend line break outs, especially on larger time frame charting such as the one hour like with today’s trading are very powerful signals.

I even publicly gave my Twitter followers a bit of a heads up intra-day because I could see the trend line breach set up coming. My tweet went out at 11:30 AM and shortly after noon oil was in break out mode above the trend line resistance.

oil shorties could get wrecked here

In Part 2 of this article we will take a look at how the swing trading strategies played in to this set up for our Swing Trade Alert service members.

In Part 3 for our Pro Oil Day Traders (Oil Trade Subscribers) we will look at the algorithmic charting structures that enabled this successful trade.

The video tutorial for this specific article (Part 1) is below.

As always, any questions please send me a note via email [email protected].

Thank you.

Curt

< Updated June 10 7:41 AM EST >

There is another classical charting reason possible for crude oil’s 200 Point reversal rally intra-day, Fibonacci level 50% was hit perfectly.

Nonetheless, there were strong algorithmic charting reasons for the reversal rally intra-day that I will go in to in more detail for our oil trader members in Part 3. Considering the machine trading liquidity in the oil trading markets I would weigh those indicators / signals much more greatly than the chart below. 

crude oil, intraday, reversal, trade

There is another classical charting reason possible for crude oil’s 200 Point reversal rally intra-day, Fibonnaci level 50% was hit perfectly.

Further Learning:

If you would like to learn more, click here and visit our Crude Oil Trading Academy page for complimentary oil trading knowledge – posts from our top crude oil traders that includes learning systems, blog posts and videos.

Welcome to NYMEX WTI Light Sweet Crude Oil Futures.

Subscribe to Oil Trading Platform:

Standalone Oil Algorithm Newsletter (Member Charting Reports sent out weekly at times in report form or updated on email regularly).

Real-Time Oil Trading Alerts (Private Twitter feed and Discord Private Server Chat Room).

Oil Trading Room Bundle (includes Weekly Newsletter, Trading Room, Charting and real-time Trading Alerts on Twitter and private Discord Chat Room Server).

Commercial / Institutional Multi User License (for professional trading groups).

One-on-One Trade Coaching (Via Skype or in person).

Article Topics; Oil, Trading, Alerts, Oil Trading Room, Strategies, Day Trading, Intra Day, Trend Lines, Break – Outs, Support, Time of Day


How to Day Trade Crude Oil – Price Range (Low & Highs), Trends / Channels, Reversals, Sizing (Trims, Adds, Stops) and Timing – Crude Oil Day Trading Strategy (Part 2 Premium).

Introduction:

This article is part 2 of the previous public post, “How to Know & How We Alerted (In Advance) Crude Oil Intra-Day Bottom Price, Day High, Trend (PT 1)“.

I apologize for the detail in these posts, but the reality is that it takes a detailed systematic rules-based process to day trade crude oil.

You want to win in a way that provides the highest probability of win rate and return? It takes skill. Skill requires knowledge and refinement of execution.

We have been developing machine trade software for some time – this has taught us a lot, and I’m not talking about a simple trading bot kind of development.

The process of development had us trading and back testing in every time frame, every structure, every set up, every range, sequence within all, trend, order flow and more.

As we learned we shared much of this information with our clients (yes learning, after 30 years of experience).

You can read a recent client memo that explains the multi-month process we embarked on, where we are at now with development and where we are going in future here, “Crude Oil Machine Trade Software Complete | Rule-Set Strategies, Alerts, Accounts Traded, What’s Next?

The goal now is to simplify the processes (the most probable crude oil trading set-ups) and provide our clients with the most simple, clear, systematic how-to documents, videos, coaching, trading room guidance etc so that traders can duplicate what we are doing to achieve success in day to day trade.

In short, we have coded our machine trade software to trade only that which we know has the highest probability of win rate success and we will endeavor to share this with our community.

We know where we can and where we cannot win, and going forward we will only be trading that which we know with high probability that we will win.

Our machine trading software will now consistently improve its win rate (we are not experimenting going forward, we are done).

Our machine trading software will now consistently improve its return rate and over all success.

We expect this process to take about 90 trading days. After this, we expect to only be doing maintenance to the software.

So how do you duplicate what we learned? See below.

General Requirements of a Successful Oil Day Trader:

Strategy is Mandatory: When you sit down to day trade crude oil futures you need a clear plan.

  • Your trading plan has to be based in reality.
  • Reality is the nature of the instrument you are trading.
  • You can have all the plans you want, but if you do not know the nature of the instrument you are trading, you will lose.

Trading Edge: This article is a study of the nature of crude oil intra-day price action and how to execute trades so that you maintain the highest probability of success – your trading strategy edge.

  • When you acquire a trading edge for a specific instrument of trade then you become profitable. This requires knowing the nature of the instrument better than your competition, refining your process and then executing the process without thinking.
  • This is not unlike a professional tennis, football, hockey or whatever player. Think warrior, think training, think skills.You have to be able to execute – pull the trigger, without thinking. After all, your primary competitors are now machines, more specifically many are AI, and they don’t hesitate to pull the trigger.

Nature of the Instrument of Trade and Associated Returns: Crude oil embodies one of the most complicated (abstract) natures of trade (structure of instrument) – but also possesses one of the most profitable opportunities for a trader.

  • The structures of trade on various time-frames for crude oil are complicated but at the same time they are not, they are logical, mathematical, geometric and follow a natural order. You just need to know what that order / structure is and what the nature of trade is within each time-frame of structure.
  • Oil trading provides significant return potential because it is so structured (yet complicated for the casual observer or trader). Trade set-ups can be repeated over and over again on each time-frame daily, weekly, monthly and so on.
  • Crude oil can be traded with CL futures contracts, ETN’s on the regular equity markets (leveraged instruments of trade such as DWT and UWT) and with various other FX products and instruments. Most of which provide opportunity for leverage.

Welcome to the World Cup: I often say that if you can trade crude oil successfully, you can trade anything.

  • I am instantly bored day trading equities and swing trading equities, commodities etc now that I’ve been schooled by the best of the best AI’s and traders in crude oil futures. I still day and swing trade equities (always will), but it is like going back to grade school.

Success! So You’re an Expert Oil Trader Now.

  • An expert oil trader knows (with weighted probability) when and where to enter and exit trades (when and where to size in to his/her entries), when and where the trade should be trimmed or see adds, what the likely price trend is to be (on various time-frames), when and where price trend is likely to reverse and how to allow for appropriate variance on stops.
  • In short, an expert oil trade understands when structured timing is or is most likely to be in play for the most predictable trades and what each time-frame will look like (the nature of the structure within each time-frame). Various market timing becomes key.

Oh Wait: Fundamentals are Required.

  • Add to all the above requirements… an expert oil trader also needs a keen understanding of fundamental and geopolitical frame-works.

The Competition: Welcome to the Matrix.

  • The majority of crude oil is now traded by machine (and much of that is now sophisticated AI, and I’m not talking simple bots that you see advertised for retail traders in FX markets).
  • In short, the goal is to know what the machines (that control the most liquidity) are doing, how they trade, what decisions they are executing their trades to, etc.
  • If you know what the machines are doing you can then join the ride. You can be (with high probability) on the right side of the trade.

Master the above requirements and you then have some of the primary skills that make for a successful oil trader.

High Priority Signals / Associated Skills Needed For A Successful Crude Oil Day Trading Strategy:

Below I list in point form the signals you will need to know and then need to execute with precision. It is important to note here that the points below intertwine – in other words, the various points relate to each other symbiotically, they affect each other and become the nature of trade.

For simplicity I numbered them to assist with your study, your focus. You can use this like a check-list before entering a trade or before starting your day. Or, if you lost a trade (your discipline is off) you can review the numbered list below before taking another trade.

The information will provide you clues as to how the machine software is now coded, coded specifically to the highest probability win rate and being tweaked over the next 90 days to increase size and return to point of losing and then will be trimmed back and then idle.

The information below will provide a manual human trader the highest opportunity of success if you focus on the study needed and the repetitive training to then execute trades without thinking (with limited emotion).

The conventional and algorithmic charting required to execute the set-ups explained below are included in our client oil trading bundle (newsletters, alerts, trading room).

# 1 – Range of Trade.

Knowing the trading range is really critical for your trading strategy. Having a plan for the most probable high & low area of trade for the time-frame you are going to trade is paramount. This is accomplished with conventional and algorithmic charting.

This is the range on charting time-frames if you draw a simple horizontal line at top and bottom. Approximately where is the range?

Your positioning bias is then to be short at the top of the range and long at the bottom of the range (with many other considerations that make up your position size, where you trickle out, whether you trade the ebb and flow within the range, your stops and more).

If the over all trend is bullish you won’t size in as much on the short side of the upper range of trade on the time frame you are trading and the opposite is true if the over all trend is bearish.

It may be that you 1. enter your trade at the range limits and don’t touch the trade and exit at the opposite range. Or, 2. you may trickle out size as the trade progresses. Or, 3. you may (expert level here) even trade the ebb and flow of the range.

And then boom! you catch the trend reversal and repeat the process… over and over. Some days many times a day. This is the opportunity for an oil trader that equity traders don’t have available to them.

  • Intra-Day Trading Range. Right Now What is the Trading Range? Where is Trade Likely To Trend Next When it Reverses?
    • What is the playing field today? Knowing where the range of trade is right now on the charting, where it has been recently, where it is likely to be near future. What is the current range of trade? What is the likely trend going forward?
  • Wider Trading Range Time-Frames.
    • Knowing where the trading range is intra-day is important but also know where it has been on a wider time frame is also important to know. This is important because if trade leaves the current range you then know where the next range is likely to be.
    • Why is it important to know the trading range on various time-frames and where the trend is likely to reverse?
      • Support and Resistance. The key support and resistance areas on intra-day and wider trading ranges become key for decisions in the trade range itself – areas for entry, exits, adds, trims, sizing and more.
      • Precise Entry and Exit. Knowing the range of trade is important for high probability trade entries and exits and this can significantly increase your return on each trade (if you can enter and exit with precision).
      • Managing Stops and Sizing. Range of trade is also important for sizing your initial trade entry, trimming your trade size and / or adding to your trade. The idea here is to enter trades at the outside edges of the most probable areas / range of trade, weighing your entry size and stops more so when you are trading the most probable trend of trade and it is also important for knowing when to trickle out / trim positions as the range trade progresses.
  • Using Conventional Charting and Algorithmic Models to Determine Range.
    • Check your conventional charting on various time-frames (1 minute, 5 minute, 15 minute, 30 minute, 4 hour, daily, weekly and monthly) and do not ignore the algorithmic models (these are where the machines will bias sizing).
    • Generally an oil day trader is trading the range of the 1 minute through to 4 hour hour. I most often am using the 1, 5, 15 and 30 minute structured algorithmic models.
    • When you have an understanding of the range frame-work on conventional and algorithmic charting you are now prepared with your range trading bias for the day. You are also ready for the most probable areas of trend reversal.

# 2 Trend of Trade and Channels.

Where are the general trends of trade on various time-frames? Is price trending up or down? This can be difficult to assess when you consider the nature of crude oil – this is why the static range (as above in #1) is so important. Also, are there channels of trade in play on various time-frames?

  • Price Trends. Know What the Current Trend Is.
    • Is there a channel of trade or a range to work with? Are there channel set-ups within various time-frames of charting and times of day or week that tend to repeat?
  • Reversals. Where and when is the trend likely to end / reverse.
    • Key support and resistance areas on various time frames. Here again, range of trade, trend and trading channels.
    • Algorithmic structured time cycles. There are time cycles on each algorithmic model. You need to know these well. The machines are coded to bias trades at these time cycles. This is critical.
    • Time of day or week considerations for various markets in play or events such as EIA and daily settlement for example) and what the likely trend will be next for the continuation of your trading plan.

# 3 – Time of Day.

Time of day is critical. You need to bias your trade size, your expectation of key support and resistance being respected, your expectation of trends finding continuation etc.

  • Early futures trade. Early futures trade is usually sloppy unless there is a geopolitical event. It usually has near zero range. It usually does not respect any of the conventional or algorithmic structures on charting. Use extreme caution.
  • As Global Markets Open. As markets in Asia and Europe etc open then trade starts to get more and more structured. Usually around 3 am Eastern trade become more structured. This can start earlier at around 11:00 PM the night prior but I like to avoid trade until at least 3:00 AM Eastern.
  • The session between 3:00 AM to 7:30 AM (all approximate ranges of time) typically is a session in of itself and a reversal is very possible around 7:30. Quite often if trade has been trending up during this session then the air is slowly let out of the balloon for the hand off that occurs around 8:00 AM for the US day traders.
  • Then around 8:00 AM you will start to see volume increase significantly, especially on the half hour marks leading in to the regular US Market open.
  • At 8:30 AM, 9:00 and 9:30 this is where the trend for the morning session for the regular US market is usually determined.
  • Around 11:00 AM the trend is then consolidated for a further move up in the afternoon session, or sideways range bound trade or a reversal. The opposite of course is true.
  • Prepare for some volatility around settlement at 2:30 PM and around API Tuesday 4:30 and EIA Wednesday at 10:30 AM.
  • Friday afternoons can trend price in a way that is not possible on most days.
  • Many days you will find that late afternoon is a slow melt up, melt down or sideways. Shorting the melt up is foolish.
  • Above are just some examples.

# 4 – Intra Day Time Cycles.

Time cycles have been discussed some above. The basic consideration here is that each algorithmic model (on various time-frames) includes time cycles that are foolish to ignore. The larger the time-frame the more important the time cycle.

  • For example, there is a large time cycle on the weekly model that expired (or peaked) last week. On such a large time cycle a week either way is considered and then trend thereafter becomes weighted heavily in bias of trade.
  • Another example is the 5 minute algorithmic charting model, there are time cycle peaks every 3 hours within a specific structure. These are key to understand for a day trader. Not just where the time cycle peaks are, but the nature of trade around each peak.

The algorithmic reports and the discord member chat room are key for learning how to take advantage of the time cycles.

# 5 – Cut Losses Fast. Using Stop Losses. Sizing.

Crude oil trade is vicious. It can ruin a trader’s confidence fast. It can also destroy a trader’s account.

If you have the rules in place, you know the structure of trade, you are sizing in accordance to your threshold appropriate to your account size then you will be fine. Capital protection is by far one of the most important skills you can acquire.

For my personal account this is critical. This changes somewhat when you know that you can make up the bad trade(s) – you have the skill-set and just have to reset. But until you have the proven experience it is important to protect your capital. This discipline can also be different if you are developing software as in our case (we achieved 63% returns and then lost up to 30% in a month developing the software). But this again is different because (as in our case) when you stop developing and simply deploy software to execute to only trade what is most probable you know it will make up the losses.

But for a human trade executing mechanically (manual trades) the cut losses fast is a critical skill-set. You need to know what trade structure is in play, you need to execute to the outside ranges of that structure and you need to size appropriately. If the structure, the plan goes against you, you then need to close your position fast.

  • Stops should be set in accordance to the time-frame structure in play.
  • Understanding that the machines will hunt stops is critical. This then highlights the necessity to place stops outside that range and consider trading a range of trade with increased sizing as the trade proves itself or size in at inflections of time cycles and increased volume and immediately close if it goes against you.
  • If trading range it is better to consider giving the range room to work itself out. Add to the position as it proves out at the outside of the range and then trickle out / trim your position as it moves through the range.
  • If trading a channel on a day trading time-frame then you should be more static about your entries and exits. More rigid. The channel on lower time frames will typically work or not work. A trading range has much more “give” to the range. The edges of the range are more blurred as the time-frame gets larger and larger.

Real World Trading Examples:

Below are excerpts from Part 1 of this article (in italics) to highlight the points discussed above.

I then also include charting and explanation about how we knew where price would likely bottom on the day and reverse (to provide one example).

Future posts will focus us down on real world examples from the live trading room and we’ll refine each trade set up and trading discipline skill one at a time, over and over again until you are winning at least 80% of your trades and over time you can then increase your trading size and returns.

I will include chart / screen shot (captures) but won’t provide charting links for proprietary algorithmic models in this post, members receive these regularly on email.

Low of Day Price & Reversal Trade Signal / Set Up .

Knowing with high probability where the low or high of day price will likely be is a great skill to have as an oil day trader. It will provide confidence in trade, allow for sizing considerations and so much more. Below is an example from our private oil trading chat discord server, trading room and oil alert feed.

Our traders learn how to set up their strategy, watch for the signals on the charting etc from the newsletter reports, charting updates continually sent out, guidance in the discord chat room, voice broadcast in oil trading room and alerts on the Twitter private feed.

At 10:54 AM I alert the oil trading room (with voice broadcast and charting), the oil chat room (see screen capture image below) and alert to the member Twitter feed (screen shot below) that we are looking at the 50.84 area of FX USOIL WTI for possible long trade (trend reversal) for a possible bottom price area on the day. We trade CL futures but alert on USOIL WTI for consistency between instruments of trade for crude oil.

Looking 50.84 area possible longs (bottom of quad) trading 51.26 intra. Shorting all pops thereafter in to quad area resistance.

oil, trade, alert Looking 50.84 area possible longs (bottom of quad) trading 51.26 intra. Shorting all pops thereafter in to quad area resistance.[/caption]

How Did We Know Where Oil Trade Was Likely to Bottom on The Day?

We have structured models on all time frames. In this instance the EPIC Algorithmic Model on the 30 Minute provided the primary structure. Oil trade was trading down after the EIA numbers were released and we simply looked to the bottom of the current trading quad structure. We then cross reference the structure of support with trading models for larger time-frames and lower time-frames and as price nears the target area we look at time frames on smaller and smaller models.

When price action confirms on the 1 minute model, increasing volume is apparent, the order flow is confirmed (machine liquidity is entering from the markets in to the trade) then we start our trade and/or our machine software begins to trade.

Below is the EPIC Oil Algorithm 30 Minute Model. Many areas of structured support were hit and then price ran up approximately 150 ticks for a complete move from the bottom of the quadrant to the top of the trading quad. Perfect set-up.

The orange arrow is where price hit the machine execution line (where the larger liquidity players normally have machines coded to begin large entries), then trade confirmed above the swing trading wider range indicator on the model (the thick gray horizontal line) and then further confirmed at a considerable historical support (purple horizontal line).

low of day, price, reversal, crude, oil

Determining low of day crude oil price for reversal. Algorithm area of support, swing support, historical support.

Then at 11:54 the price of oil drops in to the area previously alerts, spikes down with a flash and trade reverses. In the oil chat room screen shot below you can see I alerted our long oil trade (machine trade in this instance) in the 50.70s and then the machine trade closed and fired a few other times. This ended up in fact being the low of day in trade. I had alerted that I was looking at the 50.84 area and price hit 50.70s and reversed.

Software fired in there 50.70 s to closing 50.90 s, I didn’t but we’ll see if it holds the range for a bounce.

oil trading room, alert, bottom price, trend reversal area Looking 50.84 area possible longs (bottom of quad) trading 51.26 intra. Shorting all pops thereafter in to quad area resistance.[/caption]

You can also see in the screen shot that I was sharing various chart set-ups to help our traders with their trading strategies for the day so they knew where the structured areas of support, resistance etc were.

Then at 12:07 PM I alerted to the oil trading room by voice broadcast, chat room with charting and on live alert feed that the structure of trade had improved and that we expected that the low of day for trade had in fact been put in confirming a reversal.

improved structure, likely near term low in

oil, trade, alert, price, reversal

Oil trade alert, trading room alert low of day price crude oil reversal trend in play.

Then shortly after 12:00 I alerted (to live trading room, chat room, alert feed) that there was a time cycle peak coming at 2:15 (in other words if you are long on the reversal from the day lows that 2:15 would be the area of time on the day for a high for your price targeting on the trade).

I also gave the resistance levels between where trade was at near the bottom of the trading quad (near the reversal area at bottom) and where we seen the top price target of trade. In other words, if you are long the trade watch for the 20 MA on the 5 minute chart above and the mid quad (mid channel) resistance on the 30 minute EPIC model chart.

2:15 time cycle should be the top on any retrace up on the day
20 MA on 5 min overhead
2:15 PM time cycle most bullish scenario we have is 51.90 (mid channel on EPIC quad) trading 51.32
body of 30 min candle at machine line

Then after the resistance areas are overcome in uptrend trade on the day at 1:20 PM (in advance of the 2:15 time cycle peak) I alert in more detail the various price target areas that represent various model charts on different time-frames so that our traders know exactly what levels to watch as price nears both time and region of trade for our trending price targets for the day trade.

Resistance we are watching intra 51.86 mid channel EPIC, 52.14 5 min, 52.10 on 1 min, 2:15 time cycle peak, just hit 51.81 intra. Nice reversal intra in the EPIC quad from just below support of area we had marked. Also watching for signals for longer term trend reversal possibilities.

oil trading room, trade alert, reversal, price target

Screen shot oil trading room trade alert high of day price target timing for reversal for oil trading strategy.

Image capture below from oil trade chat room shows 1 min crude oil model trend and 5 min chart with oil trade trending in to time cycle peak as alerted.

oil trade alert, trend, price target, time cycle

Image shows 1 min crude oil model trend and 5 min chart with oil trade trending in to time cycle peak as alerted

Image below from oil trading room alerting that price reversal strong structure expect possible trend reversal and possible price targets. The first image is the 30 minute EPIC algorithm chart model showing a strong bounce off the bottom area of the quadrant (the alerted price reversal area).

Strong signal the trend on wider time frame is in reversal mode with action seen in this quad today really clean

And because the bounce is so strong and structured properly in the quad that traders could start possibly looking at larger time frame charting for a possible trend reversal and possible price targets in that scenario.

maybe one quad more down but that would be it if so imo
60.41 would be trend reversal target, trading 51.91, 850 ticks ish
sorry its 59.22

trading room, oil trade alert, price targets, reversal, trend

Image from oil trading room alerting that price reversal strong structure expect possible trend reversal and possible price targets.

Image showing oil trade room signals on 1 minute chart for confirmation of intra day trend from HFT trade action. Normally we would explain or alert this as it was happening live, however, in today’s scenario I was doing double duty coding so I was sure to show our traders where / how they could confirm that the intra-day trend (for in future trading strategy) was still in play.

After two hits to the trend then the HFT programs set their confirmation pivot and continue trend. This confirms that a trade can continue looking in to the trend for the day, the price targets for day high and time cycle peak for the day.

this is where the HFTs hammered down today, after two hits to 1 min channel support and hit to 1 min range they hammered down

oil trading room, signals, HFT, confirmation of trend, alert

Image showing oil trade room signals on 1 minute chart for confirmation of intra day trend from HFT trade action.

Two chart images below of crude oil trade from trading room comparing last week trade action and this week in 30 Minute EPIC model. This week the trade is much more structured confirming signals that I will include in Part 2 of this report.

Last weeks quad action

This week quad action

oil charts, models, signal, confirmations

Two chart images for crude oil trade from trading room comparing last week trade action and this week in model. Confirming signals.

The final two images below show that price did in fact spike in to the time cycle peak for 2:15 PM and did reverse in this area of oil trade for a short opportunity as we had alerted much earlier in the day.

peaking in to time cycle intra

trend reversal, alert, oil, trading room, charts

The final two trading room images below show that price time cycle reversal oil trade short alerted earlier.

Below is the raw oil trading room video feed, if you are learning to trade oil you can correlate the time stamp you see on the images above to the time stamp on the video so you can scroll through the video to specifically what I was saying in the trading room during each alert period. The video below is only a raw feed and I am not broadcasting on mic all day – only when there are alerts and or trades in play (this is why I mention the time stamps). I only include the video because newer students of trade can utilize the live video (and associated comments and charting) to learn, but it is not packaged in short form so you have to dig a bit.


Further Learning:

If you would like to learn more, click here and visit our Crude Oil Trading Academy page for complimentary oil trading knowledge – posts from our top crude oil traders that includes learning systems, blog posts and videos.

Welcome to NYMEX WTI Light Sweet Crude Oil Futures.

Subscribe to Oil Trading Platform:

Standalone Oil Algorithm Newsletter (Member Charting Updates Distributed Weekly).

Real-Time Oil Trading Alerts (Oil Trade Alerts via Private Twitter Feed and Discord Private Chat Room).

Oil Trading Room / Algorithm Newsletter / Alert Bundle (Weekly Newsletter, Trading Broadcast Room, Chat Room, Real-Time Trade Alerts).

Commercial / Institutional Multi User License (for professional trading groups).

One-on-One Trade Coaching (Via Skype or in person).

Click here to find all information and pricing on Oil Newsletter, Trading Chat Room, Oil Alerts and more.

Curtis Melonopoly (@curtmelonopoly) is rated Top 250 Stock exchanges authority, covering also Mathematical finance and Economy of the United States

Article Topics: Day Trading, Crude, Oil, Trading, Trading Room, Strategy, Signals, Reversals, Trend, Time of Day, Time Cycles, Channels, Trims, Adds, Stop Orders.

Follow: