Welcome to the Compound Trading Swing Trade Report Friday Dec 15, 2017. $TAN, $WYNN, $NFLX, $AXP, $TWLO, $VRX, $GSIT. $ABX, $XME, $URRE, $RIG, $XLE, $SLX, $X.
Notices:
Good morning!
This swing trading report is one in five in rotation.
The reports are in the process of upgrades to include buy and sell triggers identified on charting of select instruments that are nearing trade set-ups. The triggers (price and / or other indicators) will also be set to alarm on our charting for attendees to the live trading room and alerts will flash on screen during live trading broadcast. Additionally, the triggers will be buy / sell points for our traders to use as part of the alerts members may receive.
If you need help with a specific trade and the specific trading plan for your swing trade set-up let me know and as I have time I can help you formulate.
When managing your trades with the reports keep in mind that you will have to invest an hour or two a week to check the indicators mentioned for buy and sell triggers.
Swing trading success, even with a service, does require “some” maintenance on the part of the user, although the new live alert service will take much of that burden off the user as we know many of our users have busy lives. It is the indicators lining up that signal a trade long entry or an exit. In our case rely heavily on MACD on daily or weekly (or Stoch RSI and Moving averages) but indicators we are basing our trade entry and exits on are listed with each trade so any user that does even moderate trade management will know when the indicator(s) have turn with or against the trade.
Intra-week you can always DM myself on Twitter or email with specific questions regarding trades you are considering for assistance. But it is critical that you attend to the maintenance of your signals at least once a week if not twice and set stops and preferably alarms so that intra-week you can enter or exit. If nothing else you can always book some coaching time and I’ll assist also (although we are at a point of waiting list for the coaching, at minimum you can get on list or for immediate help as I said please DM or email).
IF WE DON’T GET BACK TO YOU RIGHT AWAY it is usually because we are pressured with deadlines or are trading.
As live charts are made available below, click on link and open viewer. Then to use chart yourself click on share button at bottom right (near thumbs up) and then click “make it mine”.
To remove the indicators at bottom of chart screen (MACD, Stochastic RSI, Squeeze Momentum) double click on chart body to remove indicators from chart – and same to return the indicators.
If you receive a report and you are not subscribed to the specific service it is a complimentary issue provided to you.
Our apologies if you receive more than one copy – it means you are on more than one subscription list. We are working to resolve this issue.
Newer updates below in red for ease.
Recent Compound Trading Videos for Swing Traders / Charting Set-Ups:
Visit our You Tube channel for other recent videos.
Dec 13 Swing Trade Set-Ups; $OSTK, Gold, $NUGT, $WTI, OIL, EIA, $VRX, $CELG, $AAOI, $RIOT, $MCIG
If you’re a trader learning, need set-ups, have interest in our 2018 plans, what we see in markets fwd, want to see live trades / on the fly analysis or learn a bit about how we model charts and more…. this video is for you. #premarket #tradingstrategy #trading #video
Fri Dec 8 Trade Set-ups $BTC, Crypto Scenarios, Gold, $WTI, OIL, Algorithms, $VRX, $SQ, $MYL …
Dec 7 Swing Trade Chart Set-Ups $OSIS, $SQ, $DPW, $FSLR, $FB, $TVIX, $XIV …
Dec 6 Swing Trading chart set-ups $ETSY, $FSLR, $VTGN, $APTN, $LMFA, $VRA …
Swing Trade Set Ups Nov 20 $TWTR, $KR, $BTC, $WTI, $SRAX, $ACST …
Swing Trade Set Ups Nov 17; Oil, $WTI, $JJC, Copper, Bitcoin, $BTC, $OSTK, $AMBA, $HMNY, $AAOI…
Swing Trade Set Ups Nov 15 $XIV, $SPY, $OSTK, $HMNY, GOLD, OIL, $SQ, $SORL, $WPRT….
BEST Trade Set-ups in a while! Nov 10 (starts 4:42): OIL, GOLD, $VIX, $VRX, $ROKU, $AAOI, $HTZ …
Wed Nov 8 Trade Set-Ups Review: $SPI, $BTC, $VRX, $AAOI, $KBSF, $LEU, $ONCS, $DEPO, $SNAP…
Nov 7 Trade Set-Ups Review: $DVN, $GOOGL, $TSLA, $HMNY, $VRX, $AAOI, $MYO, $TOPS, $BTC…
Nov 6 Trade Set-Ups Review: GOLD, $GLD, $HMNY, $RCL, $BTC, $WTI, $USOIL, $FB, $TOPS, $SPPI, $BAS…
Email us at info@compoundtrading.com anytime with any questions about any of the swing trades listed below. Or, if we get bogged down private message Curtis in trade room or direct message him on Twitter. Market hours are tough but we endeavor to get back to everyone after market each day.
Profit and Loss Statements:
Q3 will be published soon.
Q2 2017 Swing Trading Results are available here: P/L Realized Gains: $99,452.00 Percentage Portfolio Gain 105.74% (~35% per month).
https://twitter.com/CompoundTrading/status/896897288798392320
July 2017 Trading Challenge P/L Report $NFLX, $XIV, $AAOI, $AKCA, $BWA, $SRG, $MCRB, $UGLD, $IPXL, $HIIQ and more
https://twitter.com/CompoundTrading/status/895889454212108289
Stock Pick Coverage:
$NFLX – Netflix
Dec 15 – $NFLX trading 188.30 premarket under 20 and 50 MA with MACD that could turn up.
When price above 20 and 50 MA’s and MACD turns up this likely becomes a long trade. Will post buy/sell triggers as a trade nears. On high watch here.

Nov 21 – $NFLX trading 194.70 with MACD Stochastic RSI and SQZMOM trending down. Waiting for MACD turn to assess long.

Oct 31 – Trading 198.10 with MACD turned down above all MA’s on daily. On watch for MACD turn up and decision.
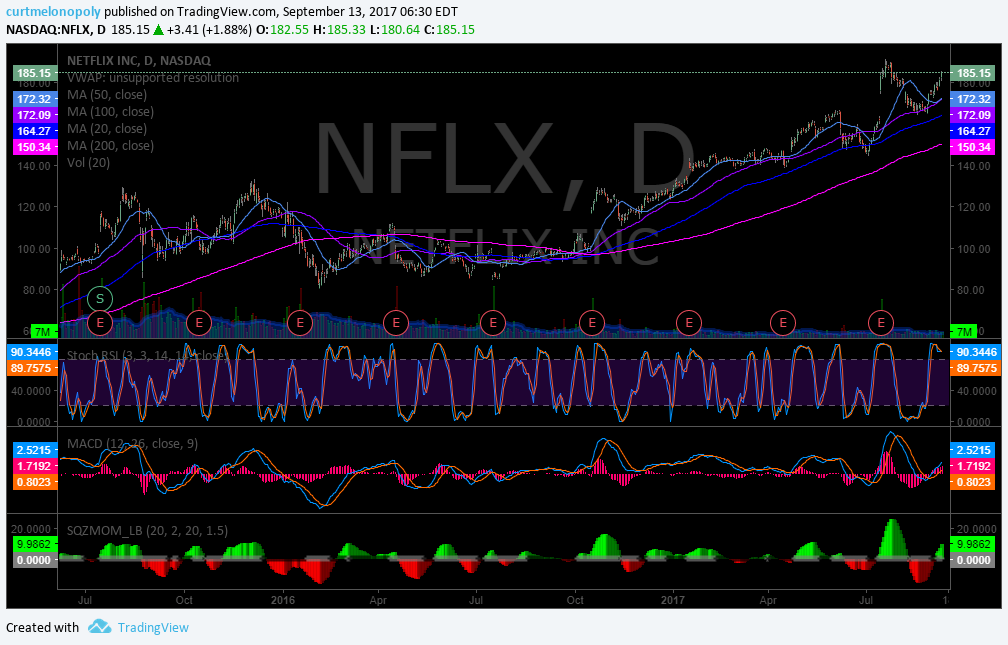
Sept 13 – Trading 185.40 bounced off 50 MA on daily since last report. MACD is now up, SQZMOM up but Stoch RSI peaking. Will assess when Stoch RSI bottoms and turns again.
Aug 18 – Trading 166.10. Indicators all pointing down and sitting on natural support. Waiting for indicators to turn.
Aug 7 – Trading 180.46 after its post earning’s break out. MACD turned down and will wait for it and other indicators to turn up before considering an entry.
July 24 – Closed premarket 188.40 from 158.20. Will watch for a re-enter pending some ER considerations early this week. Sentiment is pensive imo. Could go either way in market – generally speaking.
July 12 – Trading 158.20. Will watch here over its 50 ma and if 20 ma is about to breach 50 with price above and other indicators line up I will alert an add.
July 5 – Trading 146.17. Long from 159.35 200 shares on the 26th of June. Unfortunately thats where it turned down and now MACD is near bottom. 200 MA however is at 135.35 and that is possible. Understand that when I take an entry it is normally no more than 1/5 sizing until a trade proves itself out so I can usually take the down draft if required.
June 26 – Trading 158.33.
$NFLX pull back may be over MACD could cross up with SQZMOM and Stoch RSI trend up.On watch and I may take a long entry in premarket today.

June 18 – Trading 152.38. $NFLX They say exit timing is as important or more so than the entry. That worked. #swingtrading All indicators trending down now so will wait on the MACD on daily before considering a long position.

June 8 – $NFLX Opened long 148.40 closing in premarket 165.88 range #swingtrading

June 6 – Trading 165.06 from 148.40 entry. All indicators pointing up on weekly and daily but we will likely roll out of this long soon.
May 31 – Trading 163.20. 148.40 entry. Stop set at 158.00 now. If price tests 20 MA on daily but doesn’t take out stop I will add and alert live.
$NFLX swing trade going wll. Trading 163.20 premarket from 148.40 entry. #swingtrading

May 23 – Trading 157.32. Stop set at 153.10 to protect equity. Holding otherwise. MACD turned down on daily and may add if it turns up.
May 17 – $NFLX Swing trade going well. Trading 158.50 from 148.40 entry. SQZMOM may turn down as with MACD and Stoch RSI truned down may exit soon and re-enter when indicators turn back up.

May 9 – $NFLX Swing trade going well. Long at 148.40 trading 156.08. SQZMOM and MACD trending but Stoch RSI may cool soon, vol decent. Will add per below.
$NFLX Live Chart https://www.tradingview.com/chart/NFLX/rjcjiVBz-NFLX-Swing-trade-going-well-Long-at-148-40-trading-156-08-SQ/

May 3 – April 25 148.40 Long 500 shares April 25 when MACD turned up per below. Trading 156.28. MACD trending up, SQZMOM trending up and Stoch RSI at top and may come off short term – so a short term turn down is possible here. Will likely re-add when STOCH RSI comes off and turns back up as long as MACD is trending up still and has room to top.
April 24 – Trading 142.87. Watching.
April 19 – Trading 143.75 – waiting for MACD to turn up.
April 10 – We closed flat 145.50. Trading 142.80. Waiting for MACD, Stoch RSI, SQZMOM to turn green for entry long.
April 4 – March 29 we entered 145.50 500 shares when MACD turned up per watch trigger below. Stop is at flat at entry and we will re-enter if we have to. Will look at adding pending triggers – will advise.
$NFLX Live chart with indicators https://www.tradingview.com/chart/NFLX/ozKJQ8t4-NFLX-March-29-we-entered-swing-trade-145-50-when-MACD-turned-t/
$NFLX March 29 we entered swing trade 145.50 when MACD turned, trading 146.82, stop at flat and re-enter if we have to. #swingtrading pic.twitter.com/DI8fiL6nsv
— Melonopoly (@curtmelonopoly) April 4, 2017
$GSIT
Dec 15 – $GSIT Trading 7.18 with MACD trending down. Will wait for a MACD turn for swing trade. Last report I stated that although the technical indicators appeared bullish that caution was warranted – the warning proved to be important as price did come under pressure. Now it’s a matter of allowing the chart to set-up for a long.

Nov 21 – $GSIT trading 8.04 over 200 MA with 20 MA breach Stoch RSI high MACD up SQZ MOM up – caution recommended.
This is one of the few times where the technicals line up this well and I wave a flag of caution. They don’t look great even though they are lined up. You could take a long with a short leash.

$GSIT trading 8.04 over 200 MA with 20 MA breach Stoch RSI high MACD up SQZ MOM up – caution recommended.Oct 31 – Trading 6.86 under all MA’s and MACD trending down. Very poor performance of late and if anything a short.
Sept 13 – Trading 6.88 trending toward a 200 MA test from underside. If it regains 200 MA will re-assess entry.
Aug 18 – Trading 6.26 with all indicators trending down. Waiting on indicator turn for possible long.
Aug 7 – Trading 7.12 and sitting right on 200 MA with MACD trend down and other indicators poor. Waiting.
$AXP – American Express
Dec 15 – $AXP trading 97.10 with indicators pointing down – watching for test and bounce of MA’s.

Nov 21 – $AXP American Express trading 93.95 Stoch RSI at bottom turn up MACD turned down SQZMOM turned down under 20 MA trending.
Wait for the MACD to curl back up and assess indicators for a long at that time.

Oct 31 – Trading 95.07 post earnings and outperforming by far. Above all MA’s, trending, and MCD, Stoch RSI, SQZMOM trending up. The only play for me here now is to wait for Stoch RSI to return to bottom and curl up and watch for an MA bounce on downdraft for long.
Sept 13 – Trading 86.55 and in a box sideways for weeks. Watching.
Aug 18 – Trading 86.75 with indicators indecisive. Watching.
Aug 7 – Trading 85.77. Trading in trend above ma’s with MACD trending down. Will wait on MACD turn and assess at that time.
July 24 – Trading 85.59.
July 14 – Trading 85.33. Earnings in 5 days. On high watch for after earnings.
July 5 – Trading 85.10. Trading in 52 week break out straight price action with no end in site so I can’t justify an entry, however, if I was managing trades on a minute by minute basis these are good to try and keep a short leash on. Anyway, waiting for a pullback to assess.
June 26 – Trading 82.22. Indicators are starting to cool a bit on daily – waiting for a pull back turn.
June 18 – $AXP Testing 52 week highs near break out stoch RSI peaking MACD trend up and SQZMOM trend up. Bullish. This is a break out play and I may enter a 1/5 size and add at pull back. Watching the 20 MA breaching 50 and 100 ma’s and vol spike. Very bullish.

June 9 – $AXP SQZMOM green MACD up Stoch RSI high Waiting on MA’s to sort out with price above. Vol up. On High Watch.

May 31 – Trading 77.05. Same.
May 23 – Watching. Indicators indecisive.
May 17 – Trading 78. Sitting on 200 MA on weekly. On daily price is under 20 and 50 MA with MACD turned down. Watching.
May 9 – Trading 78.27. Closed 78.74 May 4 when MACD crossed down from 78.01 long. We still like this stock so we are watching close for indicators to turn back up.
May 3 – Trading 79.54. Holding long while MACD trends up and price above entry and 20 MA is above 50 MA. Stoch RSI is coming off so we expect some downward pressure short term.
April 24 – Trading 79.63. Long 78.01 500 shares April 20 when MACD turned up. Watching for MACD, Stoch RSI to remain, and SQZMOM to turn green for possible add.

$ABX – Barrick Gold
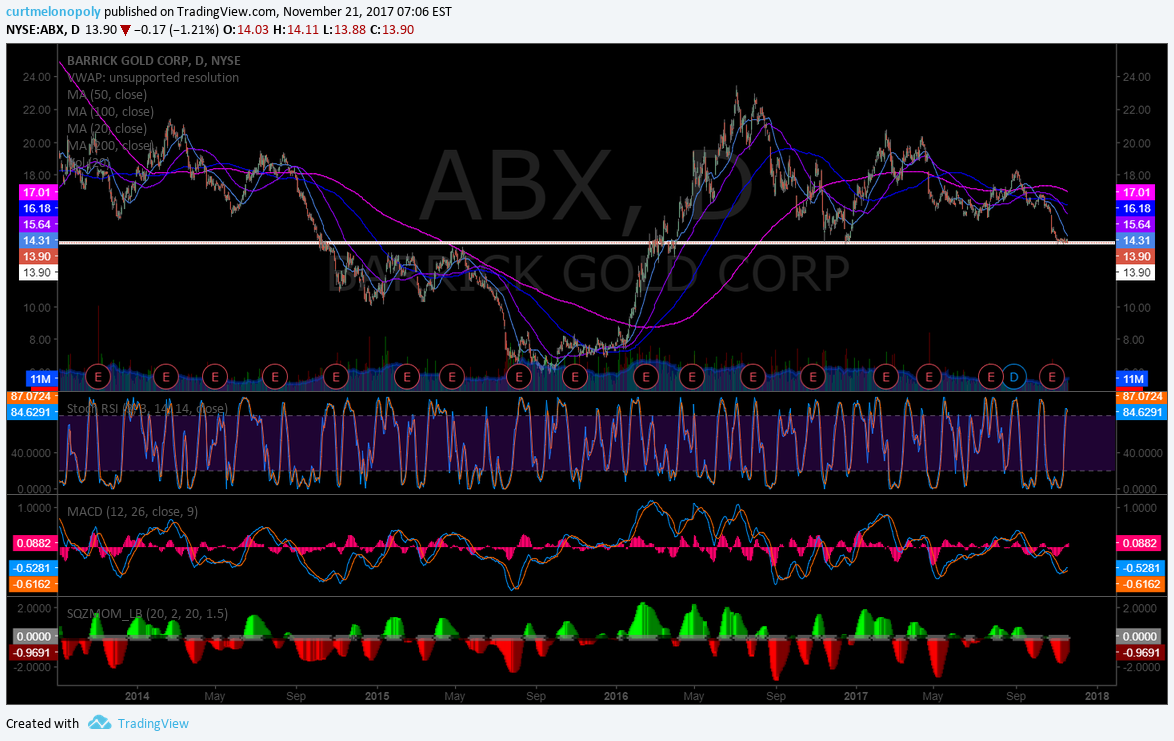
Dec 15 – $ABX trading 14.20 with indecisive indicators on daily chart but this could be close to bottom (IMO).

Nov 21 – $ABX Barrick Gold premarket daily chart sitting on horizontal support with MACD curled up. #Gold $GLD #swingtrading
https://www.tradingview.com/chart/ABX/sGA4fowA-ABX-Barrick-Gold-premarket-daily-on-support-MACD-up/

Oct 31 – Trading 14.67 under all MAs with all indicators bearish. Will assess at a turn.
Sept 13 – Trading 17.44 above 200 MA on weekly but sideways for weeks. Watching.
Aug 18 – Trading 17.06 with indicators indecisive. Watching.
Aug 7 – Trading 16.64. Same.
$TAN
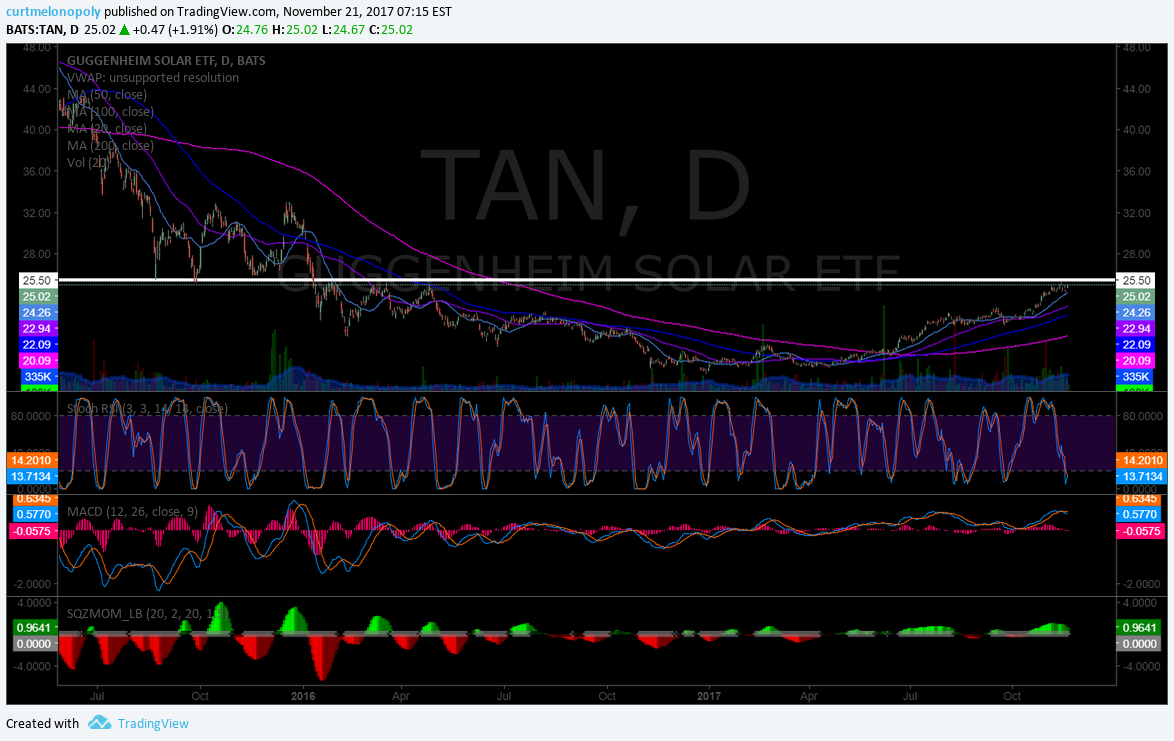
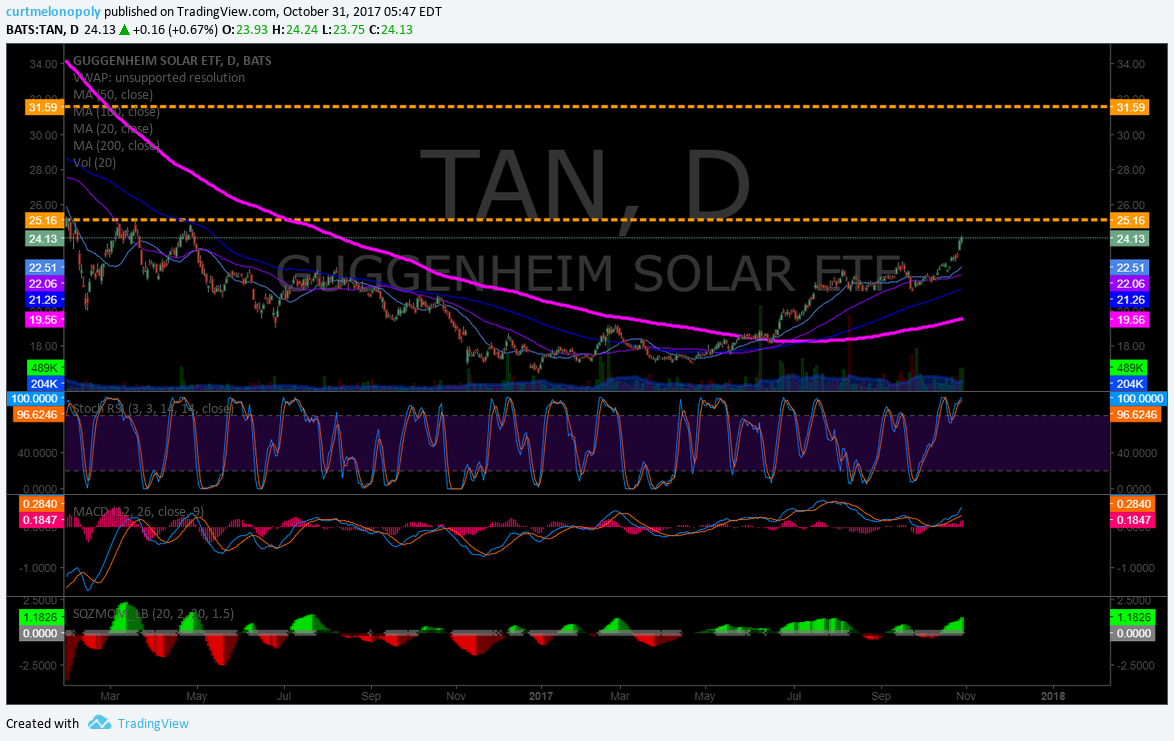
Dec 15 – $TAN trading 24.48 with MACD about to turn up. Likely swing trade this one soon long. On high watch here.

Nov 21 – $TAN trading 25.02 up against historical resistance and a long over 25.50 when MACD turns up. Stoch RSI price divergence also.
This is really bullish but needs to get up over resistance and see MACD turn along with other indicators. But recent downturn in Stoch RSI at chart historical resistance vs. price remaining bullish is a very strong sign upside will continue. One of my MAIN on Watchlist now!

Oct 31 – Trading 24.13 above ma’s and starting to trend. Resistance points at 25.31 and 31.53. Looking for a pull back and bounce off MA’s. On watch now.

Sept 13 – Trading 21.84 with indicators indecisive. Watching.
Aug 18 – Trading 21.24 with indicators trending down. Waiting on a turn.
Aug 7 – Trading 21.83. Break-out may be slowing. MACD, Stoch RSI and SQZMOM trending down. Will wait on pullback to an MA that it bounces off with MACD turn and assess.
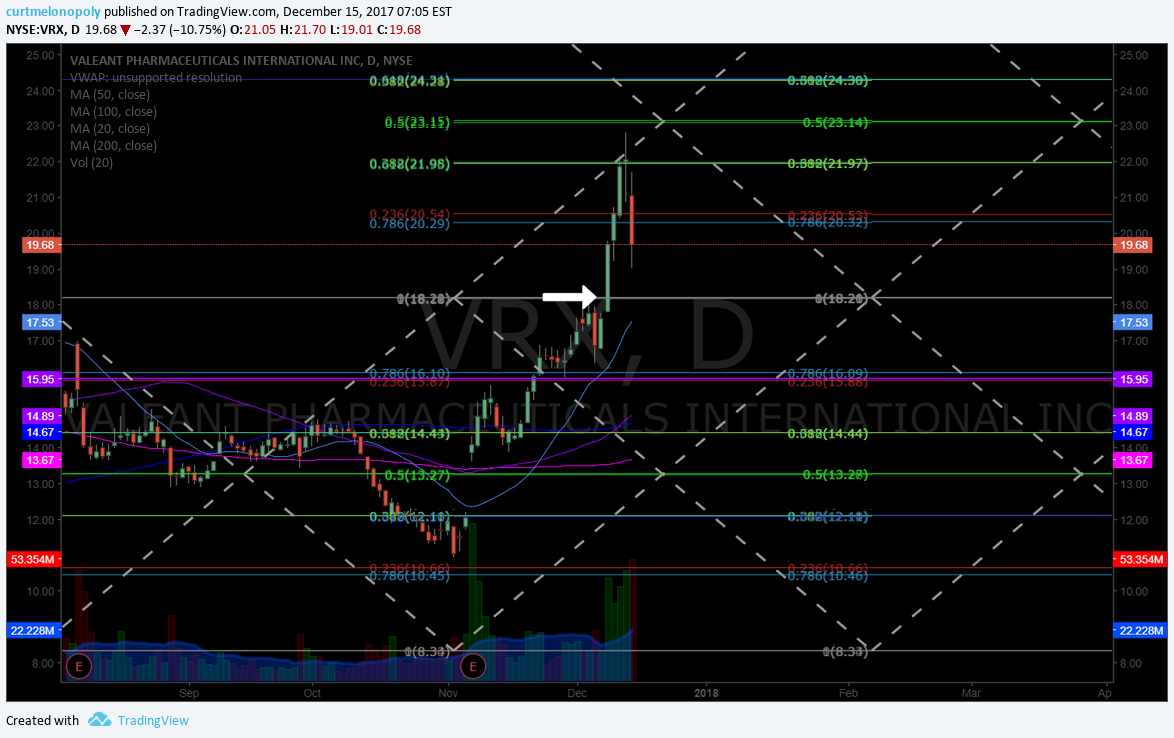
$VRX
Dec 15 – $VRX is on the turn and the mid quad horizontal lines are excellent entries and trim profits as you go. #swingtrading
Quad wall resistance recently hit and price came off – so pay attention to the quads (diagonal Fib trend lines)
18.20, 23.15 and so on.

Oct 31 – Trading 11.44 has earnings on the 13th. Under all MA’s and all indicators trending down. BUT, price is getting in to an area with historical support. Watching very close for a bounce in to or post earnings. This one is on high watch.

Sept 13 – Trading 14.39 and has regained its 200 MA with indicators showing bullish action – watching close now.
Aug 18 – Trading 14.40 and indicators look to be close to turning up. On Watch.
Aug 7 – Trading 15.13. Earnings in 1 day. Waiting.
$TWLO
Oct 31 – Trading 31.88 with natural historical resistance near above and all indicators indecisive.
Sept 13 – Trading 30.20 with regained 200 MA and indicators look bullish as with $VRX – on high watch here.
Aug 18 – Trading 30.20 with indicators indecisive. Watching.
Aug 7 – Trading 29.20. Under 200 MA and 20 MA with MACD trending down. Will wait for MACD to turn up before considering a long position.
July 25 – Trading 30.99 testing 200 MA from underside with ER in 23 days. Very interesting set-up developing here now. On Watch.
July 14 – Trading 28.16 and 200 MA is getting near overhead so it could be ready sometime moderately soon.
July 5 – Trading 28.97. Now indicators pointing down. Not an easy stock to read. Watching.
June 26 – Trading 30.00 in premarket. All indicators are turned up but I just don’t trust the chart without historical. The alert below on June 9 turned out positive I just couldn’t execute.
June 18 – Trading 26.87 With MACD on daily turned up and testing natural resistance. Turns out per below it was a decent short term long. Unsure.
June 9 – Trading 25.49 The indicators on the 60 min say you could go long with a decently strong thesis (not enough chart history for Daily or Weekly chart), however, considering the short history price action I will wait – I think it is accumulating and the chart possibly repairing.
May 31 – Trading 24.48. Watching.
May 23 – Trading 25.00. Watching for bottom bounce to form. MACD up on daily right now.
May 17 – Trading 24.53. Waiting on MACD turn cross up on daily before anything.
May 9 – Trading 23.50. See below. Not ready.
May 3 – Trading 23.70. Closed 33.57 1000 shares before earnings on a 29.60 buy. Never hold through earnings unless you are unusually confident (yes we did recently with $GOOGL and $AMZN but very unusual for us to do that). Anyway, watching now. Downdraft was intense from forward guidance.
April 24 – Trading 30.82. Holding 1000 shares 29.60.
April 19 – Trading 30.51. April 12 MACD turned up opened long 29.60 1000 shares.

$WYNN
Oct 31 – Trading 141.21 under 20 and 50 MA and about to retest 100 MA. It bounced at 100 MA previous so this is on high watch now also for a bounce. Post earnings with surprise upside.

Sept 13 – Trading 145.90 and threatening another leg up – on high watch now.
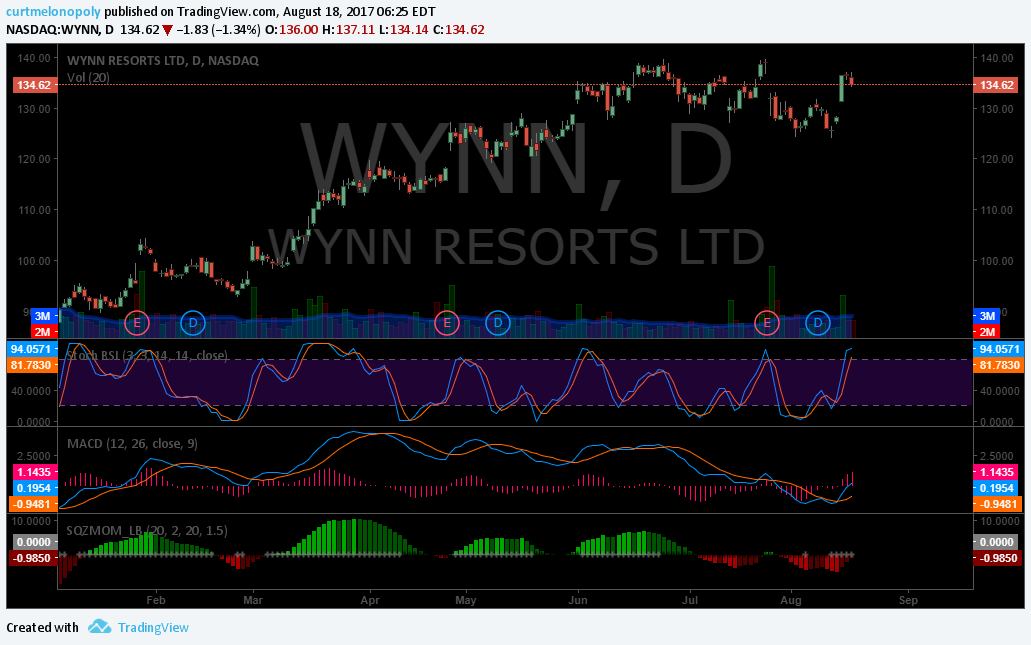
Aug 18 – Trading 134.70. Indicators trending up with price near previous high break-out. On watch for break-out.

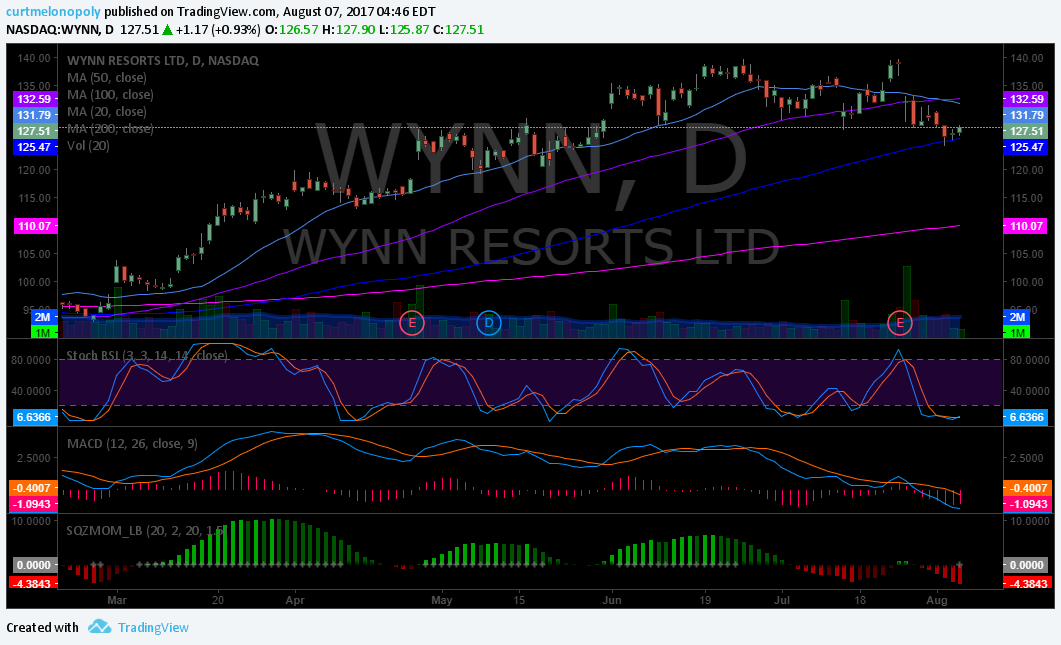
Aug 7 – Trading 127.60. MACD trending down. Watching.
July 25 – Trading 138.53 testing highs. Looks like it’s going to break higher (high probability anyway). On watch now for confirmation and power.
July 5 – Trading 131.01. Indicators all pointing down. Waiting for a turn to assess.
June 26 – Trading 138.30. $WYNN just got its 200 MA on weekly. Stoch RSI on weekly is crossed down with other indicators a buy. Will wait for Stoch RSI to cross up before assessing a long.
June 9 – Trading 134.73. MACD turned up on 7th and it got the pop we were thinking would come. Watching for follow through and possible long today. On high watch also.
May 31 – Trading 126.30 Watching for MACD to turn up.
May 23 – Trading 125.11. Watching for set up.
May 17 – Trading 126.91 coming up on underside of 200 MA test on weekly. MACD on daily is about to cross up. Will wait for MACD on daily and assess.
May 9 – Stopped flat on May 5, 2017. Watching SQZMOM, Stoch RSI, MACD, volume indicators now for a turn.
May 3 – Trading 125.55. Long 122.56 April 25 when MACD turned up (per below) and watching for continuation in MACD and price. Will exit if MACD turns down or price hits our entry. We may even add. It looks good.
April 24 – Trading 114.89. Watching.
April 19 – Trading 115.95. MACD trending down. Waiting for bottom and turn up. It has a ways to go.
April 10 – Closed 500 shares Friday 117.20. Trading 116.50. Watching MACD, Stoch RSI, SQZMOM for reset at bottom and turn for re-entry.
April 4 – We triggered a stop at flat March 27 and had a re-entry at 111.04 when we looked at it again for 500 shares. Currently trading at 116.00 and we are watching MACD. Which is currently at top. We may exit as MACD turns down and re-enter when MACD turns back up. Alternatively we may ride the MACD turn down as long as our original entry isn’t triggered as stop and when MACD turns back up add to position. Both are valid and we are undecided.
March 26 – We took a long position at 110.93 for 500 share start on March 21. HOWEVER, we have a stop at our entry price (due to current market sentiment) and it is currently trading at 111.92. Careful with this one.
$XME
Oct 31 – Trading 32.02 with price and all indicators trending down. Looks like a 200 MA test on daily is in store.
Sept 13 – Trading 32.41 with indecisive indicators.
Aug 18 – Trading 29.84 with indicators trending down. Watching.
Aug 7 – Trading 30.54. Testing 200 MA support with MACD trending down. Will wait for MACD to turn up.
$WWR – Westwater Resources (Previously known as $URRE)
Oct 31 – Trading .81 and all indicators tanking.

Sept 13 – Trading 1.52 setting up for 200 MA test from underside. Watching.
Aug 18 – Trading 1.32 with indicators trending down. Watching.
Aug 7 – Trading 1.36 with earnings in 3 days. Same.
$RIG
Oct 31 – Trading 10.33 and testing underside of 200 ma and it may get going again. Watching for MACD turn up.
Sept 13 – Trading 8.79 bottom play that has regained 20 MA and 50 MA and is currently setting up to test underside of 100 MA and then possibly 200 MA. On Watch.
Aug 18 – Trading 7.28 with all indicators trending down. Watching.
Aug 7 – Trading 9.12 on earnings surprise above 20 and 50 MA’s and under 200 and 100 MA’s. MACD trending up. Waiting for a 200 MA test.
$XLE
Oct 31 – $XLE Trading 67.69 and like $RIG and testing underside of 200 ma and it may get going again. Watching for MACD turn up.

Sept 13 – Trading 65.41 bottom play that has regained 20 MA and 50 MA and is currently setting up to test underside of 100 MA and then possibly 200 MA. On Watch.
Aug 18 – Trading 62.01 with all indicators trending down. Watching.
Aug 7 – Trading 65.64. Watching for indicators to become positive.
$SLX – Vaneck Vectors Steel
Oct 31 – Trading 42.79 with MACD just crossing down now on daily.
Sept 13 – Trading 43.77 with all indicators on daily up except Stoch RSI – watching for the bottom turn and previous high break.
Aug 18 – Trading 39.76 with indicators trending down. Watching.
Aug 7 – Trading 40.82. Above 200 MA with MACD trending down. Indecisive at best. Watching.
$X – United States Steel Corp.
Oct 31 – Trading 26.50 and just dropped below 200 ma with MACD just turning down now.
Sept 13 – Trading 26.37 with indicators turned down after 200 MA underside breach test setting up. On watch.
Aug 18 – Trading 23.78. Indecisive. Watching.
Aug 7 – Trading 23.87 Same.
Email or DM me on Twitter anytime with thoughts or questions!
Cheers!
Curtis
Article Topics; $TAN, $WYNN, $NFLX, $AXP, $TWLO, $VRX, $GSIT. $ABX, $XME, $URRE, $RIG, $XLE, $SLX, $X, Compound Trading, Swing, Trading, Stock, Picks