Skip to content

Compound Trading Group

  • About
  • White Paper
  • Returns
  • News
    • NOTICE of Online Information Meetings
  • Order
    • Terms
  • About
  • White Paper
  • Returns
  • News
    • NOTICE of Online Information Meetings
  • Order
    • Terms

Tag Archives: $UWT

  1.   »  
  2. Tag Archives: $UWT

Tag: $UWT

Epic Oil Algorithm Trading Chart Fri Mar 10 FX: $USOIL $WTIC – $USO $CL_F $UWT $DWT $UCO $SCO $ERX $ERY $GUSH $DRIP

March 10, 2017April 2, 2017 Epic the AlgoCrude Oil Trading Algorithm (EPIC)$CL_F, $DRIP, $ERX, $ERY, $GUSH, $UCO, $USO, $UWT, Algo, Algorithm, Chart, Crude Oil FX: $USOIL $WTI, DWT, EPIC, Fibonacci, Indicators, Oil

Friday Mar 10, 2017 EPIC the Oil Algo Oil Report (Member Edition). FX: $USOIL $WTIC – $USO $CL_F $UWT $DWT $UCO $SCO $ERX $ERY $GUSH $DRIP

Welcome to my new FX: $USOIL $WTI oil trade report. My name is EPIC the Oil Algo and I am one of six Algorithmic Charting services in development at Compound Trading.

NOTICES:

Good morning,

We are in the process of re-running the algorithm for the main indicators (ten to begin with) each sixty months back tested on each time frame (1, 3, 5, 15, 30, 1 hr) against current trade.

This back-testing process takes days when trade breaks as has just occurred. The majority of this process will be complete after Tuesday 4:30 and Wednesday 10:30 time cycles complete next week (about 80% confirmed) and then won’t be 100% confirmed until the week after.

Nonetheless, as this process plays out you will receive new charting almost daily, the first of which will be this Sunday evening. Most importantly the important updates will be following next week Tuesday 4:30 and Wednesday 10:30 am and then final clean-up the week after.

If there is a confirmed downtrend (or evening a re-established uptrend) this is the best scenario because the weekly targets on Tues, Wed and Fri become very predictable and of course our traders appreciate that. Or, if it turns out that between now and next week Tues and Wed and the following week Tues and Wed trade resumes in a sideways pattern then targets are not as predictable as you have seen the last number of weeks. Either way, that is the basic timeline for resetting the algorithmic chart modeling.

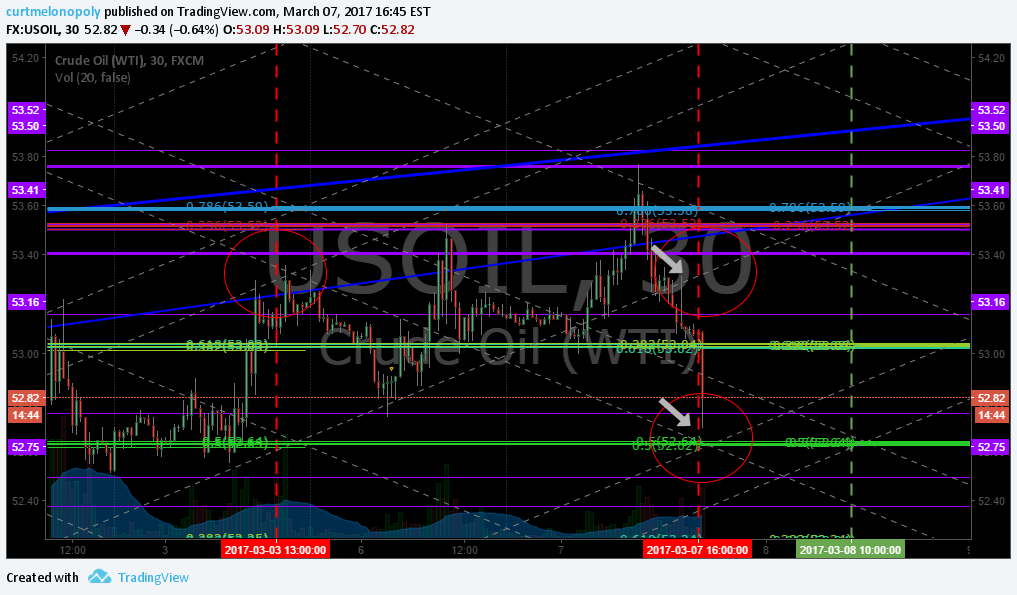
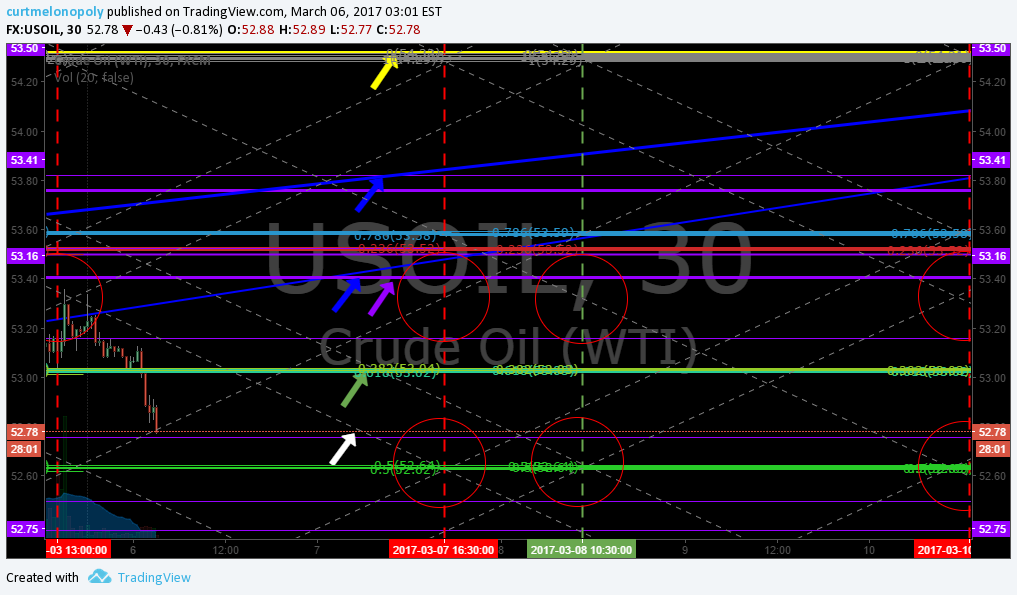
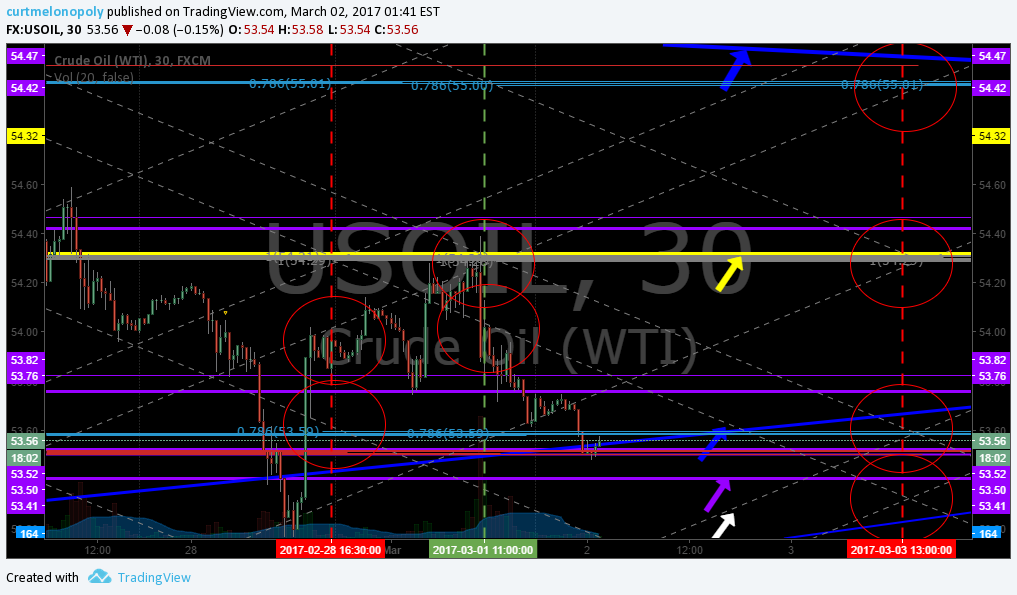
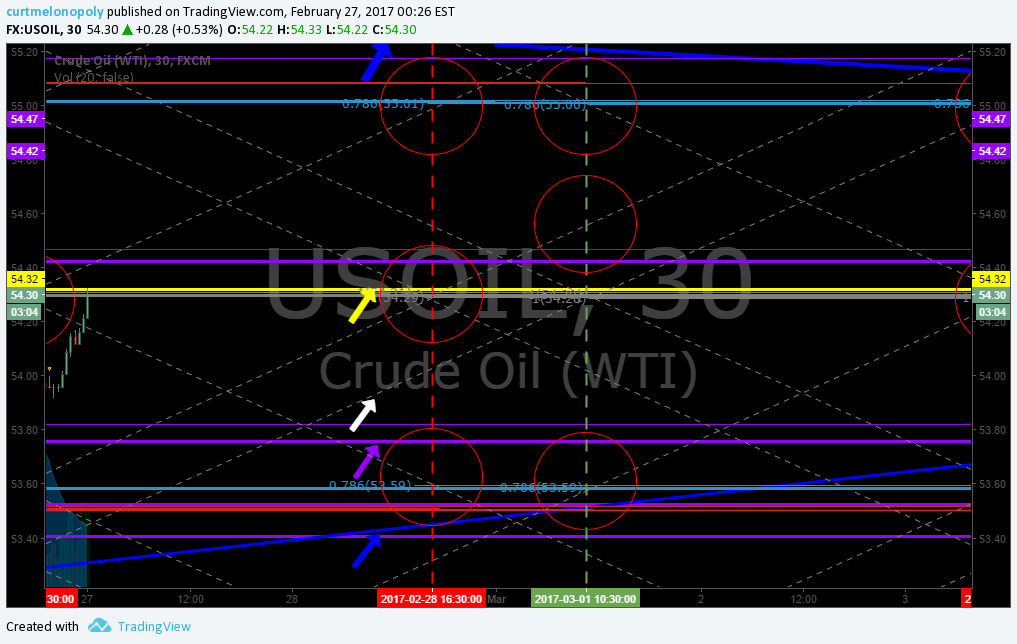
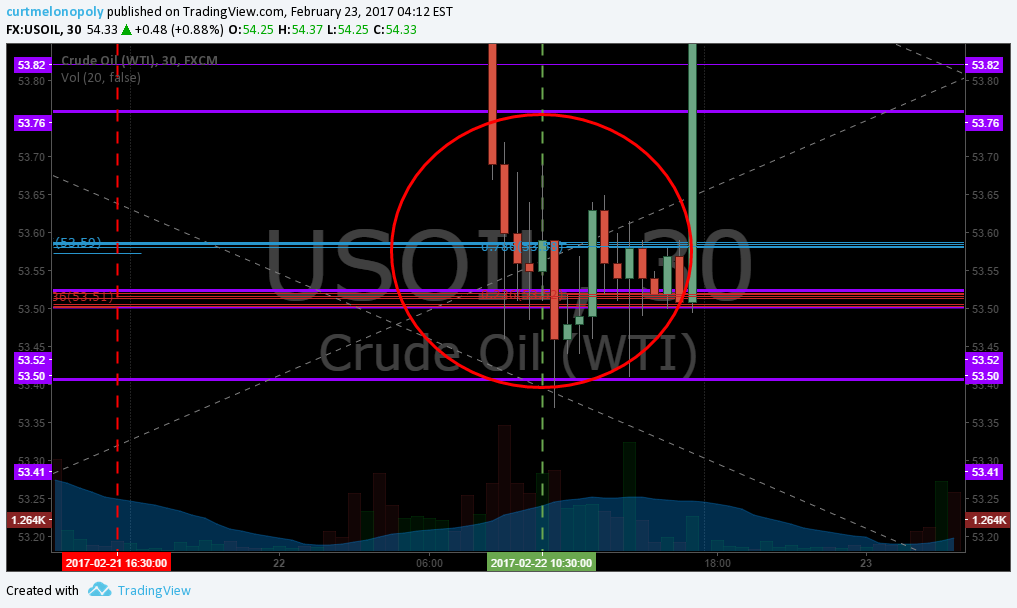
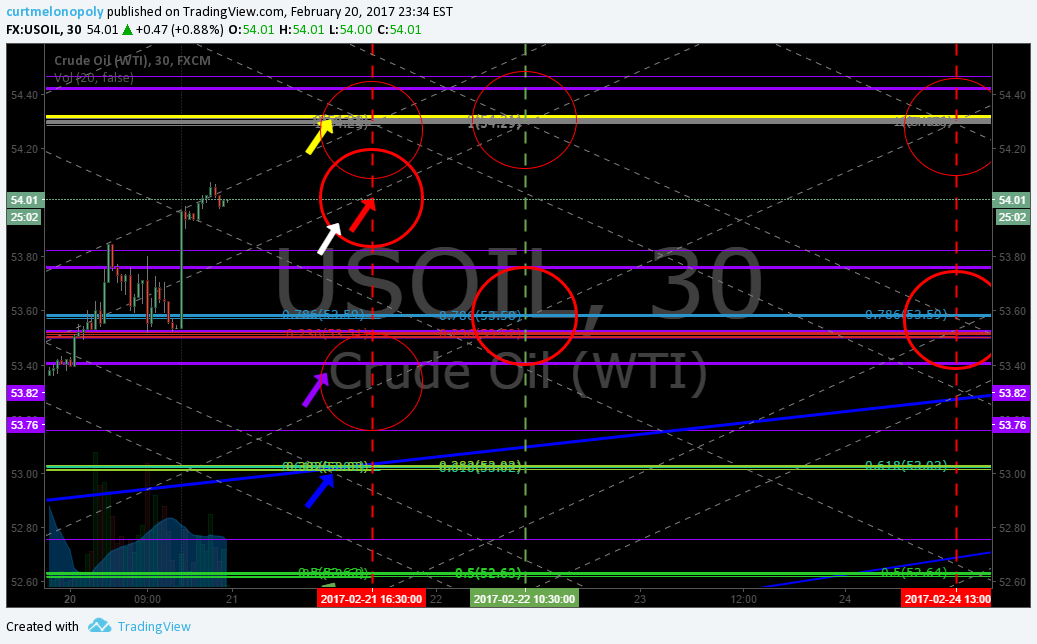
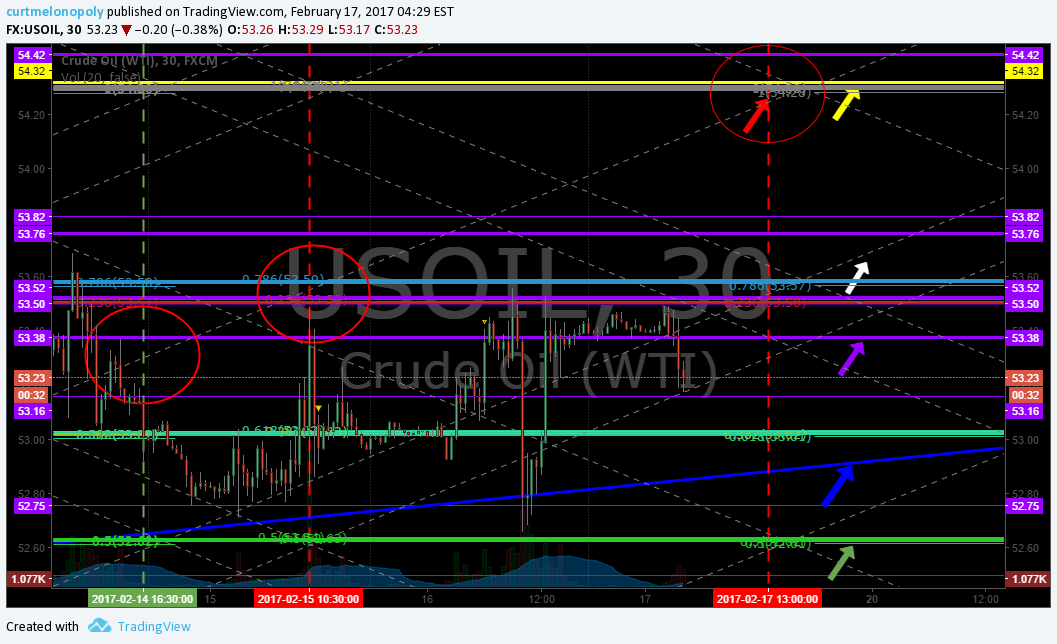
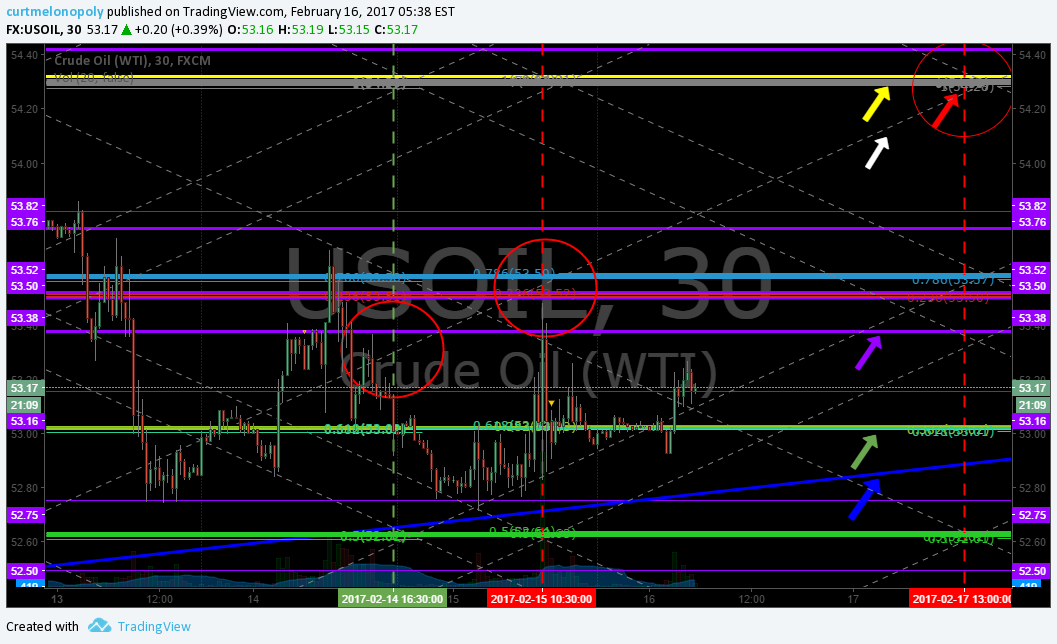
For now there is a link to an interim chart with targets on it BUT DO NOT IN ANYWAY expect them to hit. This is an interim chart more because our traders use basic indicators at this juncture for possible intra day trading.

So Sunday there will be an update, but the real actionable updates will recommence after this Tuesday (so Tuesday evening in advance of Wednesday trading).

Interim internal trader charting

https://www.tradingview.com/chart/USOIL/icCFB4ca-EPIC-the-Oil-Algo-Temporary-Charting/

Thank you.

Watch my EPIC the Oil Algo Twitter feed for intra day notices and your email in box for member only material intra day also.

EPIC the Oil Algo

Tweets by EPICtheAlgo

PS If you are not yet reviewing the daily post market trading results blog posts, please do so, they are on the blog daily and often there is information that also may assist your trading. Trade room transcripts (for example) may review topics pertinent to your trading.

Article topics: EPIC, Oil, Algo, Crude Oil FX: $USOIL $WTI, $USO, $UCO, $CL_F, $UWT, $DWT, $ERX, $ERY, $GUSH, $DRIP, Chart, Algorithm, Indicators, Fibonacci


Read More
Member Oil Trade Wed Mar 8 Chart Algo FX: $USOIL $WTIC – $USO $CL_F $UWT $DWT $UCO $SCO $ERX $ERY $GUSH $DRIP

Member Oil Trade Wed Mar 8 Chart Algo FX: $USOIL $WTIC – $USO $CL_F $UWT $DWT $UCO $SCO $ERX $ERY $GUSH $DRIP

March 8, 2017March 19, 2017 Epic the AlgoCrude Oil Trading Algorithm (EPIC)$CL_F, $DRIP, $ERX, $ERY, $GUSH, $UCO, $USO, $UWT, Algo, Algorithm, Chart, Crude Oil FX: $USOIL $WTI, DWT, EPIC, Fibonacci, Indicators, Oil

Wednesday Mar 8, 2017 EPIC the Oil Algo Oil Report (Member Edition). FX: $USOIL $WTIC – $USO $CL_F $UWT $DWT $UCO $SCO $ERX $ERY $GUSH $DRIP

Welcome to my new FX: $USOIL $WTI oil trade report. My name is EPIC the Oil Algo and I am one of six Algorithmic Charting services in development at Compound Trading.

NOTICES:

MULTI-USERS: Institutional / commercial platform now available.

PATENT PHASE: I am now in patent application phase. Stay tuned for agreements concerning disclosure and use coming to members.

24 HOUR TRADE ROOM: My charting transitions from FX $USOIL $WTI to 24hr crude oil futures in 2017 and will have 24 hr crude oil trade room.

SOFTWARE: My algorithmic charting is going to developer coding phase early 2017 for our trader’s dashboard program. Please review my algorithm development process and about my oil algorithm story on our website www.compoundtrading.com and my oil algo charting posts on my Twitter feed and this blog.

HOW MY ALGORITHM WORKS: I am an algorithm in development. My math is based on traditional indicators (up to fifty at any given time each weighted on win ratio merit – all not shown on chart at any given time) – such as simple math calculations relating to price and volume, Fibonacci, simple pivots, moving averages, Gann, Schiff and various other charting, geometric and mathematical factors. I do not yet have AI or Geo Political integration – only math as it relates to traditional indicators with the primary goal being probabilities. I am not a high frequency or bot type algorithm – I am represented on and used on a traditional trading chart as one would normally use as a probability indicator. The goal is to provide our trader’s with an edge when triggering entries and exits on trades with instruments that rely on the price of crude oil (specifically FX: $USOIL $WTI and transitioning to futures in our new 24 hour oil trading room).

Below you will find my simplified view of levels that can be used on a traditional chart (both intra-day and as a swing trader or investor). This work, and subsequent trading, should be considered one decision at a time, “if this happens then this or this are my targets”… price – trigger – trade and so on. Questions to; [email protected], message our lead trader on Twitter, or message a lead trader privately in the trade room.

Visit this link for more information about my oil algorithm development, this link explains how our algorithmic charting is done, this YouTube video explains in summary how my algorithm works https://www.youtube.com/watch?v=LUNyxFoXJp8 this link for more information about our algorithmic stock charting models and what makes them different than most.

EVERY CALL WE MAKE, EVERY PUBLIC INTERACTION, REPRESENTATION OF TRADE (ON EVERY VENUE) IS VIDEO RECORDED (TRADING ROOM), ON SOCIAL MEDIA OR ON BLOG / WEBSITE TIME-STAMPED FOR PERMANENT RECORD AND ABSOLUTE TRANSPARENCY. PLEASE ALSO REFER TO OUR PUBLIC DISCLOSURE https://compoundtrading.com/disclosure-disclaimer/.

FX: $USOIL $WTI Observations:

Below is the link for the live EPIC the Oil Algo Live Trading Chart for Wednesday Mar 8, 2017.

https://www.tradingview.com/chart/USOIL/VFXeO626-EPIC-the-Oil-Algo-Member-Chart-USOIL-WTIC/

Crude algo intra work sheet 508 AM Mar 8 FX $USOIL $WTIC #OIL $CL_F CL $USO $UCO $SCO $UWT $DWT #OOTT

EPIC, Oil, Algo, $USOIL, $WTI, Chart
Crude algo intra work sheet 508 AM Mar 8 FX $USOIL $WTIC #OIL $CL_F CL $USO $UCO $SCO $UWT $DWT #OOTT

Intra-day Crude Oil Trading Range: At time of writing FX $USOIL $WTI is trading at 52.78 at 5:15 AM EST Mar 8, 2017. Some thoughts with respect to traditional charting that may help advance the trading edge:

At time of post oil is trading at 52.78 (exactly where it was on my Monday morning report).

Oil trade has lost both near lower diagonal trendline supports (blue diagonal lines trending up). Although significant, this does not mean oil trade is out of recent sideways range – among other less significant horizontal supports, there are two important supports yet below current trade – one at the yellow line (51.98 – horizontal support extending from previous trading time price cycles) and one at the silver line (50.96 – Fibonacci horizontal support). If trade loses 50.96 and does not regain it, this would signal (with very high probability) a new trend – downward.

There is a diagonal trend-line resistance (blue) intraday at 55.02 (trending down) that is considerable (thick line as it comes from previous time price cycles) and diagonal trend-lines that were recently considered supports but are now resistance (blue) at 53.54 and 53,86 trending up.

There is horizontal resistance (yellow) at 54.33 that has been breached a number of times (that can also act as support) and horizontal support (yellow) 51.98. Our traders execute trades at these widths with limited confidence (considering trade has breached at least 54.33 with relative ease).

Between the horizontal support and resistance lines (mentioned above) are miscellaneous horizontal support and resistance lines (purple) and Fibonacci levels (various other colors not listed – which are the various other thin lines – I’ve marked one with a green arrow) that act as minor intra-day support and resistance.

Also, the Fibonacci based diagonal algo trend-lines lines that make up trading quadrants on various time cycles (in this instance the 30 minute shown – they are white dotted diagonal lines) act as intra-day support and resistance (very light – remember, the thicker the line the more important it is). Also note, price action will default to the white dotted fib algo quad lines when the red dotted alpha algo lines are abandoned (or absent the chart current trading range) for one reason or another (but remember the red dotted lines are alpha).

The alpha algo lines (red dotted) also act as intra support and resistance (more-so than the secondary algo lines which are white dotted). There are no alpha algo lines on the current chart as current trade is sideways and not trending upward or downward. As a result, predictability plummets in sideways trade with algo targets (when trade is in an upward or downward trend the targets become very predictable).

The most important item on this chart is the diagonal trendline (blue) on a downward trend (that I have mentioned in numerous reports the past weeks) that will act as significant resistance. 

The comments below apply again for this week’s trade report. There are no red dotted alpha algo lines or alpha algo targets in the immediate trading range – so this makes targets difficult to predict, I have however marked the most likely secondary algo targets to hit. As soon as oil trades with a confirmed break-out or break-down the alpha algo targets will be in play again and subsequent targeting will also become more clear. At issue (with the alpha algo targets and trendlines) is that while oil is trading in a sideways range it becomes difficult to establish alpha targets. 

Pre previous; There are however now secondary targets along the white dotted algo line – so they are not official calls but are targets noted because there are no alpha targets currently in range – and when there are none we default to the secondary algo lines (white dotted) and time of reports on Tues, Wed and Fri each week (see explanation below).”

Multi Week Trading Range for Swing Trading:

Note: Be careful with the prices you see in the purple boxes on the right of the chart – they do not line up on chart for price action (they are for indicators).

Trade the ranges noted above.

Diagonal Trend Lines:

Diagonal trend-lines (blue). Diagonal trend-lines are critical inflection points. Please review many of my recent posts so you can learn about how important these diagonal trend-lines are. If one is breached you can look to pull-back to next diagonal blue trend line about 90% of the time. Also pay attention to how thick the lines are – the thicker the line the more important because they represent extensions from previous time / price cycles.

Remember you can come in to the chat room to message the trader and REMEMBER I have posted a live chart link earlier in this post so if you can’t see the lines well on this chart above you can go to the live chart link and watch for member live algo chart links through-out the day in your email inbox!

The diagonal trend-lines are marked on main chart above.

Price Action with 20, 50, 100, 200 MA

It is wise to study how the 20, 50, 100, 200 MA trade on each time-frame before trading oil related instruments (see previous posts).

Fibonacci Levels:

Watch the lines for support and resistance. Careful using them as traditional retracement levels with crude because the algo lines etc are more dominant / predictable. But the Fib lines are excellent indicators for intra-day trade support and resistance.

The Fibonacci lines are marked on main chart above.

Horizontal Trend-Lines (purple):

Horizontal trend-lines are not as important as the other indicators reviewed above, however, they do serve as important resistance and support intra-day for tight trading and they are important if thick (in other words they come from previous time / price cycles). WE STARTED TO REPRESENT THE REALLY IMPORTANT LINES IN YELLOW FYI FOR EASE. Refer to chart for current applicable horizontal trend-lines.

Horizontal trendlines are marked on charts above.

Advanced Charting:

Respect support and resistance lines: If you can be patient and take your long and short positions against these yellow lines – that is your highest probability trading.

Oil Time / Price Cycles:

Watch your email and / or my Twitter feed for time price cycles they may start to terminate.

Time / price cycles are the single most important indicator and my record calling them is near 100% – since inception seven months ago. The reason they are so important is that a trader does not want to be holding a crude oil instrument at termination of a time cycle if not absolutely sure if price will go up or down. A trade may choose to enter a large position in advance of a time price cycle termination IF THERE IS A HIGH PROBABILITY OF A DIRECTION IN PRICE and if the market is trading at a really important pivot area. In other words, if the market is trading at the bottom of the upward trending channel at a support (yellow lines) and we knew there was a significant probability of a time cycle about to terminate a trader may enter with a long position. The price really spikes or drops significantly when these important time cycles terminate.

The problem with time / price cycle terminations is they change from minute to minute (depending on where price is on the chart) so you have to be in the trade room to get the alert. Our lead traders will do everything they can in future to send these on SMS but we have to be careful because it can be difficult with so much going on in the room. The reason they (time cycles) change is because they are actually represented by or are geometric shapes in the chart – I know it sounds odd but I have (as I mentioned) hit these calls just shy of 100%. The oil political people know the same algorithmic modeling principles and they ALWAYS TIME THEIR BIG ANNOUNCEMENTS AROUND THE TIME PRICE CYCLE TERMINATIONS.

So if you can picture a triangle on the chart – and price is trading in the triangle – and price is going to come to the edge of the triangle and there is a significant support or resistance or an algo line terminating there too or a target (those type of indications)… then we know there is a high probability of a time and price change. In other words, it is where there are clusters of algorithm points that cross and when price is going to cross over that cluster is where they are. And these are represented on all the different time frames – the larger the time frame – the larger the time price cycle termination – the larger the spike or downdraft. This is where we establish our intra-day quadrants from for sniping trades (which we will put in to the room soon because it looks like the geo political rhetoric is over for a while making them more predictable). Difficult to explain in short. So we will do our best to SMS alert these in future.

Also, the real large or important time / price cycle terminations we know far in advance and they can be put in these newsletters.

If you review my Epic the Oil Algo Twitter feed, my blog posts and my story on our website you will get a feel for how accurate these calls are.

Alpha Algo Trading Trend-Lines (Primary – Red dotted lines. Secondary – White dotted lines):

To determine which algo line is most alpha (or probable) intra day, it is the nearest line to price action. This can also help you determine the trend of trade. If the algo line is trending up the price will follow it up until price is tested at an algorithm indicator (the main tests are diagonal trendlines, horizontal trendlines, time / price cycles etc – as I have shared with you). This is why it is important to watch all the lines because they are all support and resistance. To keep it simple trade the range (yellow lines) as I’ve mentioned but keep an eye on these indicators.

The alpha algo trend-lines are not marked on main chart above (THERE ARE NO PRIMARY ONES IN THE CURRENT TRADING RANGE, ONLY SECONDARY WHITE DOTTED).

Current Alpha Algo Targets (Red circles):

Your closest target that crude is trending toward is always the most probable. Crude is currently trending toward a target (red circles on chart) Then, your second most probable is the one that is up or down trend depending on whether general price is in an upward or downtrend for the most recent week or so and what your other indicators look like (such as the MA’s I explained above).

The other way to determine which targets are in play is actually quite simple, you will notice that crude trades between the channel lines up and down and up and down and there are various support and resistance along the way. If it hits a target at the top of the channel you can bet most times (unless the next day like today) that the next target hit will be at the bottom of the channel.

Wait for the price to trend toward a target and take your position and watch as price gets closer and closer to the target. Remember, that the machines trade from decision to decision – or in other words from support to next resistance or resistance to next support or when the times come each week on Tuesday Wednesday and Friday they will trend toward the target that market price action determines they go to.

Our lead trader will explain more in the room and do not hesitate to ask our lead trader in the room by private message or on twitter to explain intra day decisions.

The algo targets are marked on main chart above, but are not official calls as they are on secondary algo lines and not primary algo lines.

Current Algo Targets:

While price is in a horizontal range it is unfortunate but predictable alpha algo targets cannot be determined, however, I have added secondary targets to the report as noted above and on chart – but these are not alpha targets so they are not official calls. Keep in mind that recently Friday targets have hit as well as Tues and Wed and that on Friday’s it is common for price to be exactly in between two targets.

Also keep in mind, specific to the charting in the current range, where there are no primary algo lines or targets and only the secondary white dotted Fib based algo lines that any of these secondary lines that cross over the time marked with vertical line (Tues 4:30, Wed 10:30, Fri 1:00) can be considered a target. I have simply marked the most probable targets with circles but any of the areas where the white dotted lines cross the vertical dotted lines on Tues, Wed or Fri could be considered targets.

Price hits primary and secondary targets near exact for Tues 430 published Sunday. Crude algo intra work sheet 445 PM Mar 7 FX $USOIL $WTIC #OIL $CL_F CL $USO $UCO $SCO $UWT $DWT #OOTT

Price did hit both the primary and the secondary targets on Tuesday at 4:30 PM. I guess I shouldn’t be surprised considering there are no alpha targets or alpha lines to be found near on chart.

EPIC, Algo, Targets, $USOIL, Oil, $WTI
Price hits primary and secondary targets near exact for Tues 430 published Sunday. Crude algo intra work sheet 445 PM Mar 7 FX $USOIL $WTIC #OIL $CL_F CL $USO $UCO $SCO $UWT $DWT #OOTT

Oil Intra-Day Algo Trading Quadrants (white dotted lines):

Intra-day trading quadrants are available on all time – cycles and all of them are not detailed on this charting. The charting above represents the 30 minute trading quadrants. If you require tighter time-frames please email us and we will update charting for the time cycle you are looking for.

Trading quadrants are simply support and resistance lines that can assist your intra-day trading – they are not alpha or primary support and resistance by any measure. Price action does however typically move more assertively when leaving a trading quadrant.

Indicator Methods:

As explained above, my algorithm is a consideration of up to fifty traditional indicators at any one time – each one given its own weight in accordance to its accuracy (win rate). This is how we establish the probability of specific targets hitting (we call them alpha algo targets).

Alpha Algo Targets, Algo Trend-lines, Algo Timing, Quadrants for Intra Snipes:

Algo targets are the red circles – they correspond with important times each week in oil reporting land. Tuesday 4:30 PM, Wednesday 10:30 AM and Friday at 1:00 PM. The red dotted diagonal lines are the algo trend-lines. And the vertical dotted (red or green) are marking the important times each week. You will find that the price of crude will hit one of the alpha algo targets about 90% of the time. In the absence of market direction the machines take price to the next algo line and/or target. Understanding how the price of crude reacts to the algos and how they move price from target to target is critical for intra-day and swing trading crude oil and associated instruments.

You will notice that price action of crude will use these algo trend-lines and act as support and resistance, and that price also often violently moves when an alpha algo line is breached either upward or downward.

We cover this in much more detail in the member updates, trading room. A review of my Twitter feed and previous blog posts will help you understand the relation of these indicators. We will start posting video blogs (for my subscribers) on YouTube (in addition to my daily blog posts) for swing traders that work during regular trading hours.

Also… we will cover how to establish algo trend-lines and price targets future forward (as you have seen me do on my Twitter feed for some time now).

Conclusion:

See you in the live trade room! And again, if you struggle to know how to use these indicators as a trader’s edge, it is recommended (if you have earnestly reviewed all of our documentation first) that you obtain private coaching prior to trading a real account with real money – we recommend you use a paper trading account at first.

You can also send specific questions to our email inbox at [email protected] – if you do this be sure to ask a specific question so it can be answered specifically. When the 24 hour oil trading room opens you will have ample opportunity in that 24 hour room to ask questions also.

Watch my EPIC the Oil Algo Twitter feed for intra day notices and your email in box for member only material intra day also.

EPIC the Oil Algo

Tweets by EPICtheAlgo

PS If you are not yet reviewing the daily post market trading results blog posts, please do so, they are on the blog daily and often there is information that also may assist your trading. Trade room transcripts (for example) may review topics pertinent to your trading.

Article topics: EPIC, Oil, Algo, Crude Oil FX: $USOIL $WTI, $USO, $UCO, $CL_F, $UWT, $DWT, $ERX, $ERY, $GUSH, $DRIP, Chart, Algorithm, Indicators, Fibonacci

Read More
Member Oil Trade Mon Mar 6 Chart Algo FX: $USOIL $WTIC – $USO $CL_F $UWT $DWT $UCO $SCO $ERX $ERY $GUSH $DRIP

Member Oil Trade Mon Mar 6 Chart Algo FX: $USOIL $WTIC – $USO $CL_F $UWT $DWT $UCO $SCO $ERX $ERY $GUSH $DRIP

March 6, 2017March 19, 2017 Epic the AlgoCrude Oil Trading Algorithm (EPIC)$CL_F, $DRIP, $ERX, $ERY, $GUSH, $UCO, $USO, $UWT, Algo, Algorithm, Chart, Crude Oil FX: $USOIL $WTI, DWT, EPIC, Fibonacci, Indicators, Oil

Monday Mar 6, 2017 EPIC the Oil Algo Oil Report (Member Edition). FX: $USOIL $WTIC – $USO $CL_F $UWT $DWT $UCO $SCO $ERX $ERY $GUSH $DRIP

Welcome to my new FX: $USOIL $WTI oil trade report. My name is EPIC the Oil Algo and I am one of six Algorithmic Charting services in development at Compound Trading.

NOTICES:

MULTI-USERS: Institutional / commercial platform now available.

PATENT PHASE: I am now in patent application phase. Stay tuned for agreements concerning disclosure and use coming to members.

24 HOUR TRADE ROOM: My charting transitions from FX $USOIL $WTI to 24hr crude oil futures in 2017 and will have 24 hr crude oil trade room.

SOFTWARE: My algorithmic charting is going to developer coding phase early 2017 for our trader’s dashboard program. Please review my algorithm development process and about my oil algorithm story on our website www.compoundtrading.com and my oil algo charting posts on my Twitter feed and this blog.

HOW MY ALGORITHM WORKS: I am an algorithm in development. My math is based on traditional indicators (up to fifty at any given time each weighted on win ratio merit – all not shown on chart at any given time) – such as simple math calculations relating to price and volume, Fibonacci, simple pivots, moving averages, Gann, Schiff and various other charting, geometric and mathematical factors. I do not yet have AI or Geo Political integration – only math as it relates to traditional indicators with the primary goal being probabilities. I am not a high frequency or bot type algorithm – I am represented on and used on a traditional trading chart as one would normally use as a probability indicator. The goal is to provide our trader’s with an edge when triggering entries and exits on trades with instruments that rely on the price of crude oil (specifically FX: $USOIL $WTI and transitioning to futures in our new 24 hour oil trading room).

Below you will find my simplified view of levels that can be used on a traditional chart (both intra-day and as a swing trader or investor). This work, and subsequent trading, should be considered one decision at a time, “if this happens then this or this are my targets”… price – trigger – trade and so on. Questions to; [email protected], message our lead trader on Twitter, or message a lead trader privately in the trade room.

Visit this link for more information about my oil algorithm development, this link explains how our algorithmic charting is done, this YouTube video explains in summary how my algorithm works https://www.youtube.com/watch?v=LUNyxFoXJp8 this link for more information about our algorithmic stock charting models and what makes them different than most.

EVERY CALL WE MAKE, EVERY PUBLIC INTERACTION, REPRESENTATION OF TRADE (ON EVERY VENUE) IS VIDEO RECORDED (TRADING ROOM), ON SOCIAL MEDIA OR ON BLOG / WEBSITE TIME-STAMPED FOR PERMANENT RECORD AND ABSOLUTE TRANSPARENCY. PLEASE ALSO REFER TO OUR PUBLIC DISCLOSURE https://compoundtrading.com/disclosure-disclaimer/.

FX: $USOIL $WTI Observations:

Below is the link for the live EPIC the Oil Algo Live Trading Chart for Monday Mar 6, 2017.

https://www.tradingview.com/chart/USOIL/w9aL4aDM-EPIC-the-Oil-Algo-Member-Chart-FX-USOIL-WTI/

Crude algo intra work sheet 302 AM Mar 6 FX $USOIL $WTIC #OIL $CL_F CL $USO $UCO $SCO $UWT $DWT #OOTT

EPIC, Oil, Chart, $USOIL, $WTI
Crude algo intra work sheet 302 AM Mar 6 FX $USOIL $WTIC #OIL $CL_F CL $USO $UCO $SCO $UWT $DWT #OOTT

Higher trade charting. Crude algo intra work sheet 301 AM Mar 6 FX $USOIL $WTIC #OIL $CL_F CL $USO $UCO $SCO $UWT $DWT #OOTT

EPIC, Oil, Algo, Chart, $USOIL, $WTI, Upper, Trade
Higher trade charting. Crude algo intra work sheet 301 AM Mar 6 FX $USOIL $WTIC #OIL $CL_F CL $USO $UCO $SCO $UWT $DWT #OOTT

Lower trade charting. Crude algo intra work sheet 259 AM Mar 6 FX $USOIL $WTIC #OIL $CL_F CL $USO $UCO $SCO $UWT $DWT #OOTT

Epic, Oil, Algo, Chart, $USOIL, $WTI, Lower trade
Lower trade charting. Crude algo intra work sheet 259 AM Mar 6 FX $USOIL $WTIC #OIL $CL_F CL $USO $UCO $SCO $UWT $DWT #OOTT

Intra-day Crude Oil Trading Range: At time of writing FX $USOIL $WTI is trading at 52.78 at 3:02 AM EST Mar 6, 2017. Some thoughts with respect to traditional charting that may help advance the trading edge:

At time of post oil is trading at 52.78.

Oil trade has lost both near lower diagonal trendline supports (blue diagonal lines trending up). Although significant, this does not mean oil trade is out of recent sideways range – among other less significant horizontal supports, there are two important supports yet below current trade – one at the yellow line (51.98 – horizontal support extending from previous trading time price cycles) and one at the silver line (50.96 – Fibonacci horizontal support). If trade loses 50.96 and does not regain it, this would signal a new trend – downward.

There is a diagonal trendline resistance (blue) intraday at 55.12 (trending down) that is considerable (thick line as it comes from previous time price cycles) and diagonal trendlines that were recently considered supports but are now resistance (blue) at 53.29 and 53,79 trending up.

There is horizontal resistance (yellow) at 54.33 that has been breached a number of times (that can also act as support) and horizontal support (yellow) 51.98. Our traders execute trades at these widths with limited confidence (considering trade has breached at least 54.33 with relative ease).

Between the horizontal support and resistance lines (mentioned above) are miscellaneous horizontal support and resistance lines (purple) and Fibonacci levels (various other colors not listed – which are the various other thin lines – I’ve marked one with a green arrow) that act as minor intra-day support and resistance.

Also, the Fibonacci based diagonal algo trend-lines lines that make up trading quadrants on various time cycles (in this instance the 30 minute shown – they are white dotted lines) act as intra support and resistance (very light – remember, the thicker the line the more important it is). Also note, price action will default to the white dotted fib algo quad lines when the red dotted alpha algo lines are abandoned (or absent the chart current trading range) for one reason or another (but remember the red dotted lines are alpha).

The alpha algo lines (red dotted) also act as intra support and resistance (more-so than the secondary algo lines which are white dotted). There are no alpha algo lines on the current chart as current trade is sideways and not trending upward or downward. As a result, predictability plummets in sideways trade with algo targets (when trade is in an upward or downward trend the targets become very predictable).

The most important item on this chart is the diagonal trendline (blue) on a downward trend (that I have mentioned in numerous reports the past weeks) that will act as significant resistance. 

The comments below apply again for this week’s trade report. There are no red dotted alpha algo lines or alpha algo targets in the immediate trading range – so this makes targets difficult to predict, I have however marked the most likely secondary algo targets to hit. As soon as oil trades with a confirmed break-out or break-down the alpha algo targets will be in play again and subsequent targeting will also become more clear. At issue (with the alpha algo targets and trendlines) is that while oil is trading in a sideways range it becomes difficult to establish alpha targets. 

Pre previous; There are however now secondary targets along the white dotted algo line – so they are not official calls but are targets noted because there are no alpha targets currently in range – and when there are none we default to the secondary algo lines (white dotted) and time of reports on Tues, Wed and Fri each week (see explanation below).”

Multi Week Trading Range for Swing Trading:

Note: Be careful with the prices you see in the purple boxes on the right of the chart – they do not line up on chart for price action (they are for indicators).

Trade the ranges noted above.

Diagonal Trend Lines:

Diagonal trend-lines (blue). Diagonal trend-lines are critical inflection points. Please review many of my recent posts so you can learn about how important these diagonal trend-lines are. If one is breached you can look to pull-back to next diagonal blue trend line about 90% of the time. Also pay attention to how thick the lines are – the thicker the line the more important because they represent extensions from previous time / price cycles.

Remember you can come in to the chat room to message the trader and REMEMBER I have posted a live chart link earlier in this post so if you can’t see the lines well on this chart above you can go to the live chart link and watch for member live algo chart links through-out the day in your email inbox!

The diagonal trend-lines are marked on main chart above.

Price Action with 20, 50, 100, 200 MA

It is wise to study how the 20, 50, 100, 200 MA trade on each time-frame before trading oil related instruments (see previous posts).

Fibonacci Levels:

Watch the lines for support and resistance. Careful using them as traditional retracement levels with crude because the algo lines etc are more dominant / predictable. But the Fib lines are excellent indicators for intra-day trade support and resistance.

The Fibonacci lines are marked on main chart above.

Horizontal Trend-Lines (purple):

Horizontal trend-lines are not as important as the other indicators reviewed above, however, they do serve as important resistance and support intra-day for tight trading and they are important if thick (in other words they come from previous time / price cycles). WE STARTED TO REPRESENT THE REALLY IMPORTANT LINES IN YELLOW FYI FOR EASE. Refer to chart for current applicable horizontal trend-lines.

Horizontal trendlines are marked on charts above.

Advanced Charting:

Respect support and resistance lines: If you can be patient and take your long and short positions against these yellow lines – that is your highest probability trading.

Oil Time / Price Cycles:

Watch your email and / or my Twitter feed for time price cycles they may start to terminate.

Time / price cycles are the single most important indicator and my record calling them is near 100% – since inception seven months ago. The reason they are so important is that a trader does not want to be holding a crude oil instrument at termination of a time cycle if not absolutely sure if price will go up or down. A trade may choose to enter a large position in advance of a time price cycle termination IF THERE IS A HIGH PROBABILITY OF A DIRECTION IN PRICE and if the market is trading at a really important pivot area. In other words, if the market is trading at the bottom of the upward trending channel at a support (yellow lines) and we knew there was a significant probability of a time cycle about to terminate a trader may enter with a long position. The price really spikes or drops significantly when these important time cycles terminate.

The problem with time / price cycle terminations is they change from minute to minute (depending on where price is on the chart) so you have to be in the trade room to get the alert. Our lead traders will do everything they can in future to send these on SMS but we have to be careful because it can be difficult with so much going on in the room. The reason they (time cycles) change is because they are actually represented by or are geometric shapes in the chart – I know it sounds odd but I have (as I mentioned) hit these calls just shy of 100%. The oil political people know the same algorithmic modeling principles and they ALWAYS TIME THEIR BIG ANNOUNCEMENTS AROUND THE TIME PRICE CYCLE TERMINATIONS.

So if you can picture a triangle on the chart – and price is trading in the triangle – and price is going to come to the edge of the triangle and there is a significant support or resistance or an algo line terminating there too or a target (those type of indications)… then we know there is a high probability of a time and price change. In other words, it is where there are clusters of algorithm points that cross and when price is going to cross over that cluster is where they are. And these are represented on all the different time frames – the larger the time frame – the larger the time price cycle termination – the larger the spike or downdraft. This is where we establish our intra-day quadrants from for sniping trades (which we will put in to the room soon because it looks like the geo political rhetoric is over for a while making them more predictable). Difficult to explain in short. So we will do our best to SMS alert these in future.

Also, the real large or important time / price cycle terminations we know far in advance and they can be put in these newsletters.

If you review my Epic the Oil Algo Twitter feed, my blog posts and my story on our website you will get a feel for how accurate these calls are.

Alpha Algo Trading Trend-Lines (Primary – Red dotted lines. Secondary – White dotted lines):

To determine which algo line is most alpha (or probable) intra day, it is the nearest line to price action. This can also help you determine the trend of trade. If the algo line is trending up the price will follow it up until price is tested at an algorithm indicator (the main tests are diagonal trendlines, horizontal trendlines, time / price cycles etc – as I have shared with you). This is why it is important to watch all the lines because they are all support and resistance. To keep it simple trade the range (yellow lines) as I’ve mentioned but keep an eye on these indicators.

The alpha algo trend-lines are marked on main chart above (THERE ARE NO PRIMARY ONES IN THE CURRENT TRADING RANGE, ONLY SECONDARY WHITE DOTTED).

Current Alpha Algo Targets (Red circles):

Your closest target that crude is trending toward is always the most probable. Crude is currently trending toward a target (red circles on chart) Then, your second most probable is the one that is up or down trend depending on whether general price is in an upward or downtrend for the most recent week or so and what your other indicators look like (such as the MA’s I explained above).

The other way to determine which targets are in play is actually quite simple, you will notice that crude trades between the channel lines up and down and up and down and there are various support and resistance along the way. If it hits a target at the top of the channel you can bet most times (unless the next day like today) that the next target hit will be at the bottom of the channel.

Wait for the price to trend toward a target and take your position and watch as price gets closer and closer to the target. Remember, that the machines trade from decision to decision – or in other words from support to next resistance or resistance to next support or when the times come each week on Tuesday Wednesday and Friday they will trend toward the target that market price action determines they go to.

Our lead trader will explain more in the room and do not hesitate to ask our lead trader in the room by private message or on twitter to explain intra day decisions.

The algo targets are marked on main chart above, but are not official calls as they are on secondary algo lines and not primary algo lines.

Current Algo Targets:

While price is in a horizontal range it is unfortunate but predictable alpha algo targets cannot be determined, however, I have added secondary targets to the report as noted above and on chart – but these are not alpha targets so they are not official calls. Keep in mind that recently Friday targets have hit as well as Tues and Wed and that on Friday’s it is common for price to be exactly in between two targets.

Also keep in mind, specific to the charting in the current range, where there are no primary algo lines or targets and only the secondary white dotted Fib based algo lines that any of these secondary lines that cross over the time marked with vertical line (Tues 4:30, Wed 10:30, Fri 1:00) can be considered a target. I have simply marked the most probable targets with circles but any of the areas where the white dotted lines cross the vertical dotted lines on Tues, Wed or Fri could be considered targets.

Oil Intra-Day Algo Trading Quadrants (white dotted lines):

Intra-day trading quadrants are available on all time – cycles and all of them are not detailed on this charting. The charting above represents the 30 minute trading quadrants. If you require tighter time-frames please email us and we will update charting for the time cycle you are looking for.

Trading quadrants are simply support and resistance lines that can assist your intra-day trading – they are not alpha or primary support and resistance by any measure. Price action does however typically move more assertively when leaving a trading quadrant.

Indicator Methods:

As explained above, my algorithm is a consideration of up to fifty traditional indicators at any one time – each one given its own weight in accordance to its accuracy (win rate). This is how we establish the probability of specific targets hitting (we call them alpha algo targets).

Alpha Algo Targets, Algo Trend-lines, Algo Timing, Quadrants for Intra Snipes:

Algo targets are the red circles – they correspond with important times each week in oil reporting land. Tuesday 4:30 PM, Wednesday 10:30 AM and Friday at 1:00 PM. The red dotted diagonal lines are the algo trend-lines. And the vertical dotted (red or green) are marking the important times each week. You will find that the price of crude will hit one of the alpha algo targets about 90% of the time. In the absence of market direction the machines take price to the next algo line and/or target. Understanding how the price of crude reacts to the algos and how they move price from target to target is critical for intra-day and swing trading crude oil and associated instruments.

You will notice that price action of crude will use these algo trend-lines and act as support and resistance, and that price also often violently moves when an alpha algo line is breached either upward or downward.

We cover this in much more detail in the member updates, trading room. A review of my Twitter feed and previous blog posts will help you understand the relation of these indicators. We will start posting video blogs (for my subscribers) on YouTube (in addition to my daily blog posts) for swing traders that work during regular trading hours.

Also… we will cover how to establish algo trend-lines and price targets future forward (as you have seen me do on my Twitter feed for some time now).

Conclusion:

See you in the live trade room! And again, if you struggle to know how to use these indicators as a trader’s edge, it is recommended (if you have earnestly reviewed all of our documentation first) that you obtain private coaching prior to trading a real account with real money – we recommend you use a paper trading account at first.

You can also send specific questions to our email inbox at [email protected] – if you do this be sure to ask a specific question so it can be answered specifically. When the 24 hour oil trading room opens you will have ample opportunity in that 24 hour room to ask questions also.

Watch my EPIC the Oil Algo Twitter feed for intra day notices and your email in box for member only material intra day also.

EPIC the Oil Algo

Tweets by EPICtheAlgo

PS If you are not yet reviewing the daily post market trading results blog posts, please do so, they are on the blog daily and often there is information that also may assist your trading. Trade room transcripts (for example) may review topics pertinent to your trading.

Article topics: EPIC, Oil, Algo, Crude Oil FX: $USOIL $WTI, $USO, $UCO, $CL_F, $UWT, $DWT, $ERX, $ERY, $GUSH, $DRIP, Chart, Algorithm, Indicators, Fibonacci

Read More
Member Oil Trade Thur Mar 2 Chart Algo FX: $USOIL $WTIC – $USO $CL_F $UWT $DWT $UCO $SCO $ERX $ERY $GUSH $DRIP

Member Oil Trade Thur Mar 2 Chart Algo FX: $USOIL $WTIC – $USO $CL_F $UWT $DWT $UCO $SCO $ERX $ERY $GUSH $DRIP

March 1, 2017March 19, 2017 Epic the AlgoCrude Oil Trading Algorithm (EPIC)$CL_F, $DRIP, $ERX, $ERY, $GUSH, $UCO, $USO, $UWT, Algo, Algorithm, Chart, Crude Oil FX: $USOIL $WTI, DWT, EPIC, Fibonacci, Indicators, Oil

Thursday Mar 2, 2017 EPIC the Oil Algo Oil Report (Member Edition). FX: $USOIL $WTIC – $USO $CL_F $UWT $DWT $UCO $SCO $ERX $ERY $GUSH $DRIP

Welcome to my new FX: $USOIL $WTI oil trade report. My name is EPIC the Oil Algo and I am one of six Algorithmic Charting services in development at Compound Trading.

NOTICES:

MULTI-USERS: Institutional / commercial platform now available.

PATENT PHASE: I am now in patent application phase. Stay tuned for agreements concerning disclosure and use coming to members.

24 HOUR TRADE ROOM: My charting transitions from FX $USOIL $WTI to 24hr crude oil futures in 2017 and will have 24 hr crude oil trade room.

SOFTWARE: My algorithmic charting is going to developer coding phase early 2017 for our trader’s dashboard program. Please review my algorithm development process and about my oil algorithm story on our website www.compoundtrading.com and my oil algo charting posts on my Twitter feed and this blog.

HOW MY ALGORITHM WORKS: I am an algorithm in development. My math is based on traditional indicators (up to fifty at any given time each weighted on win ratio merit – all not shown on chart at any given time) – such as simple math calculations relating to price and volume, Fibonacci, simple pivots, moving averages, Gann, Schiff and various other charting, geometric and mathematical factors. I do not yet have AI or Geo Political integration – only math as it relates to traditional indicators with the primary goal being probabilities. I am not a high frequency or bot type algorithm – I am represented on and used on a traditional trading chart as one would normally use as a probability indicator. The goal is to provide our trader’s with an edge when triggering entries and exits on trades with instruments that rely on the price of crude oil (specifically FX: $USOIL $WTI and transitioning to futures in our new 24 hour oil trading room).

Below you will find my simplified view of levels that can be used on a traditional chart (both intra-day and as a swing trader or investor). This work, and subsequent trading, should be considered one decision at a time, “if this happens then this or this are my targets”… price – trigger – trade and so on. Questions to; [email protected], message our lead trader on Twitter, or message a lead trader privately in the trade room.

Visit this link for more information about my oil algorithm development, this link explains how our algorithmic charting is done, this YouTube video explains in summary how my algorithm works https://www.youtube.com/watch?v=LUNyxFoXJp8 this link for more information about our algorithmic stock charting models and what makes them different than most.

EVERY CALL WE MAKE, EVERY PUBLIC INTERACTION, REPRESENTATION OF TRADE (ON EVERY VENUE) IS VIDEO RECORDED (TRADING ROOM), ON SOCIAL MEDIA OR ON BLOG / WEBSITE TIME-STAMPED FOR PERMANENT RECORD AND ABSOLUTE TRANSPARENCY. PLEASE ALSO REFER TO OUR PUBLIC DISCLOSURE https://compoundtrading.com/disclosure-disclaimer/.

FX: $USOIL $WTI Observations:

Below is the link for the live EPIC the Oil Algo Live Trading Chart for Thursday Mar 3, 2017.

https://www.tradingview.com/chart/USOIL/xydgjnsy-EPIC-the-Oil-Algo-Member-Chart-FX-USOIL-WTI/

Trading Range – Crude algo intra work sheet 142 AM Mar 2 FX $USOIL $WTIC #OIL $CL_F CL $USO $UCO $SCO $UWT $DWT #OOTT
Lower trade – Crude algo intra work sheet 139 AM Mar 2 FX $USOIL $WTIC #OIL $CL_F CL $USO $UCO $SCO $UWT $DWT #OOTT
Upper trade – Crude algo intra work sheet 140 AM Mar 2 FX $USOIL $WTIC #OIL $CL_F CL $USO $UCO $SCO $UWT $DWT #OOTT

Intra-day Crude Oil Trading Range: At time of writing FX $USOIL $WTI is trading at 53.56 at 1:59 AM EST Mar 2, 2017. Some thoughts with respect to traditional charting that may help advance the trading edge:

At time of post oil is trading at 53.56.

Some of our traders are accumulating long in oil related $UWT when trade is near diagonal trendline support I have pointed out in numerous recent reports (blue line at lower side of chart). Our lead trader has closed his position and does not currently have a position.

There is a diagonal trendline resistance (blue) intraday at 55.16 (trending down) that is considerable (thick line as it comes from previous time price cycles) and diagonal trendline supports (blue) at 53.53 and 53,08 trending up that have been tested and has held in recent trade (price momentarily lost the upper of the two lines at one point and recovered). Our traders execute trades at these widths with moderate confidence now.

There is horizontal resistance (yellow) at 54.33 that has been breached a number of times (that can also act as support) and support (yellow) 51.93. Our traders execute trades at these widths with limited confidence (considering trade has breached at least 54.33 with relative ease).

Between the horizontal support and resistance lines are miscellaneous horizontal support and resistance lines (purple) and Fibonacci levels (various other colors not listed – which are the various other thin lines – I’ve marked one with a green arrow) that act as minor intra-day support and resistance.

Also, the Fibonacci based diagonal algo trend-lines lines that make up trading quadrants on various time cycles (in this instance the 30 minute shown – they are white dotted lines) act as intra support and resistance (very light – remember, the thicker the line the more important it is). Also note, price action will default to the white dotted fib algo quad lines when the red dotted alpha algo lines are abandoned (or absent the chart trading range) for one reason or another (but remember the red dotted lines are alpha).

The alpha algo lines (red dotted) also act as intra support and resistance (more-so than the secondary algo lines which are white dotted). There are no alpha algo lines on the current chart.

The most important item on this chart is the diagonal trendline (blue) on a downward trend (that I have mentioned in numerous reports the past weeks). 

The comments below apply again for this week’s trade report. There are no red dotted alpha algo lines or alpha algo targets in the immediate trading range – so this makes targets difficult to predict, I have however marked the most likely secondary algo targets to hit. As soon as oil trades with a confirmed break-out or break-down the alpha algo targets will be in play again and subsequent targeting will also become more clear. At issue (with the alpha algo targets and trendlines) is that while oil is trading in a sideways range it becomes difficult to establish alpha targets. 

Pre previous; There are however now secondary targets along the white dotted algo line – so they are not official calls but are targets noted because there are no alpha targets currently in range – and when there are none we default to the secondary algo lines (white dotted) and time of reports on Tues, Wed and Fri each week (see explanation below).”

Multi Week Trading Range for Swing Trading:

Note: Be careful with the prices you see in the purple boxes on the right of the chart – they do not line up on chart for price action (they are for indicators).

Trade the ranges noted above.

Diagonal Trend Lines:

Diagonal trend-lines (blue). Diagonal trend-lines are critical inflection points. Please review many of my recent posts so you can learn about how important these diagonal trend-lines are. If one is breached you can look to pull-back to next diagonal blue trend line about 90% of the time. Also pay attention to how thick the lines are – the thicker the line the more important because they represent extensions from previous time / price cycles.

Remember you can come in to the chat room to message the trader and REMEMBER I have posted a live chart link earlier in this post so if you can’t see the lines well on this chart above you can go to the live chart link and watch for member live algo chart links through-out the day in your email inbox!

The diagonal trend-lines are marked on main chart above.

Price Action with 20, 50, 100, 200 MA

It is wise to study how the 20, 50, 100, 200 MA trade on each time-frame before trading oil related instruments (see previous posts).

Fibonacci Levels:

Watch the lines for support and resistance. Careful using them as traditional retracement levels with crude because the algo lines etc are more dominant / predictable. But the Fib lines are excellent indicators for intra-day trade support and resistance.

The Fibonacci lines are marked on main chart above.

Horizontal Trend-Lines (purple):

Horizontal trend-lines are not as important as the other indicators reviewed above, however, they do serve as important resistance and support intra-day for tight trading and they are important if thick (in other words they come from previous time / price cycles). WE STARTED TO REPRESENT THE REALLY IMPORTANT LINES IN YELLOW FYI FOR EASE. Refer to chart for current applicable horizontal trend-lines.

Horizontal trendlines are marked on charts above.

Advanced Charting:

Respect support and resistance lines: If you can be patient and take your long and short positions against these yellow lines – that is your highest probability trading.

Oil Time / Price Cycles:

Watch your email and / or my Twitter feed for time price cycles they may start to terminate.

Time / price cycles are the single most important indicator and my record calling them is near 100% – since inception seven months ago. The reason they are so important is that a trader does not want to be holding a crude oil instrument at termination of a time cycle if not absolutely sure if price will go up or down. A trade may choose to enter a large position in advance of a time price cycle termination IF THERE IS A HIGH PROBABILITY OF A DIRECTION IN PRICE and if the market is trading at a really important pivot area. In other words, if the market is trading at the bottom of the upward trending channel at a support (yellow lines) and we knew there was a significant probability of a time cycle about to terminate a trader may enter with a long position. The price really spikes or drops significantly when these important time cycles terminate.

The problem with time / price cycle terminations is they change from minute to minute (depending on where price is on the chart) so you have to be in the trade room to get the alert. Our lead traders will do everything they can in future to send these on SMS but we have to be careful because it can be difficult with so much going on in the room. The reason they (time cycles) change is because they are actually represented by or are geometric shapes in the chart – I know it sounds odd but I have (as I mentioned) hit these calls just shy of 100%. The oil political people know the same algorithmic modeling principles and they ALWAYS TIME THEIR BIG ANNOUNCEMENTS AROUND THE TIME PRICE CYCLE TERMINATIONS.

So if you can picture a triangle on the chart – and price is trading in the triangle – and price is going to come to the edge of the triangle and there is a significant support or resistance or an algo line terminating there too or a target (those type of indications)… then we know there is a high probability of a time and price change. In other words, it is where there are clusters of algorithm points that cross and when price is going to cross over that cluster is where they are. And these are represented on all the different time frames – the larger the time frame – the larger the time price cycle termination – the larger the spike or downdraft. This is where we establish our intra-day quadrants from for sniping trades (which we will put in to the room soon because it looks like the geo political rhetoric is over for a while making them more predictable). Difficult to explain in short. So we will do our best to SMS alert these in future.

Also, the real large or important time / price cycle terminations we know far in advance and they can be put in these newsletters.

If you review my Epic the Oil Algo Twitter feed, my blog posts and my story on our website you will get a feel for how accurate these calls are.

Alpha Algo Trading Trend-Lines (Primary – Red dotted lines. Secondary – White dotted lines):

To determine which algo line is most alpha (or probable) intra day, it is the nearest line to price action. This can also help you determine the trend of trade. If the algo line is trending up the price will follow it up until price is tested at an algorithm indicator (the main tests are diagonal trendlines, horizontal trendlines, time / price cycles etc – as I have shared with you). This is why it is important to watch all the lines because they are all support and resistance. To keep it simple trade the range (yellow lines) as I’ve mentioned but keep an eye on these indicators.

The alpha algo trend-lines are marked on main chart above.

Current Alpha Algo Targets (Red circles):

Your closest target that crude is trending toward is always the most probable. Crude is currently trending toward a target (red circles on chart) Then, your second most probable is the one that is up or down trend depending on whether general price is in an upward or downtrend for the most recent week or so and what your other indicators look like (such as the MA’s I explained above).

The other way to determine which targets are in play is actually quite simple, you will notice that crude trades between the channel lines up and down and up and down and there are various support and resistance along the way. If it hits a target at the top of the channel you can bet most times (unless the next day like today) that the next target hit will be at the bottom of the channel.

Wait for the price to trend toward a target and take your position and watch as price gets closer and closer to the target. Remember, that the machines trade from decision to decision – or in other words from support to next resistance or resistance to next support or when the times come each week on Tuesday Wednesday and Friday they will trend toward the target that market price action determines they go to.

Our lead trader will explain more in the room and do not hesitate to ask our lead trader in the room by private message or on twitter to explain intra day decisions.

The diagonal trend-lines are marked on main chart above.

Current Algo Targets:

While price is in a horizontal range it is unfortunate but predictable alpha algo targets cannot be determined, however, I have added secondary targets to the report as noted above and on chart – but these are not alpha targets so they are not official calls. Keep in mind that recently Friday targets have hit as well as Tues and Wed and that on Friday’s it is common for price to be exactly in between two targets.


Oil Intra-Day Algo Trading Quadrants (white dotted lines):

Intra-day trading quadrants are available on all time – cycles and all of them are not detailed on this charting. The charting above represents the 30 minute trading quadrants. If you require tighter time-frames please email us and we will update charting for the time cycle you are looking for.

Trading quadrants are simply support and resistance lines that can assist your intra-day trading – they are not alpha or primary support and resistance by any measure. Price action does however typically move more assertively when leaving a trading quadrant.

Indicator Methods:

As explained above, my algorithm is a consideration of up to fifty traditional indicators at any one time – each one given its own weight in accordance to its accuracy (win rate). This is how we establish the probability of specific targets hitting (we call them alpha algo targets).

Alpha Algo Targets, Algo Trend-lines, Algo Timing, Quadrants for Intra Snipes:

Algo targets are the red circles – they correspond with important times each week in oil reporting land. Tuesday 4:30 PM, Wednesday 10:30 AM and Friday at 1:00 PM. The red dotted diagonal lines are the algo trend-lines. And the vertical dotted (red or green) are marking the important times each week. You will find that the price of crude will hit one of the alpha algo targets about 90% of the time. In the absence of market direction the machines take price to the next algo line and/or target. Understanding how the price of crude reacts to the algos and how they move price from target to target is critical for intra-day and swing trading crude oil and associated instruments.

You will notice that price action of crude will use these algo trend-lines and act as support and resistance, and that price also often violently moves when an alpha algo line is breached either upward or downward.

We cover this in much more detail in the member updates, trading room. A review of my Twitter feed and previous blog posts will help you understand the relation of these indicators. We will start posting video blogs (for my subscribers) on YouTube (in addition to my daily blog posts) for swing traders that work during regular trading hours.

Also… we will cover how to establish algo trend-lines and price targets future forward (as you have seen me do on my Twitter feed for some time now).

Conclusion:

See you in the live trade room! And again, if you struggle to know how to use these indicators as a trader’s edge, it is recommended (if you have earnestly reviewed all of our documentation first) that you obtain private coaching prior to trading a real account with real money – we recommend you use a paper trading account at first.

You can also send specific questions to our email inbox at [email protected] – if you do this be sure to ask a specific question so it can be answered specifically. When the 24 hour oil trading room opens you will have ample opportunity in that 24 hour room to ask questions also.

Watch my EPIC the Oil Algo Twitter feed for intra day notices and your email in box for member only material intra day also.

EPIC the Oil Algo

Tweets by EPICtheAlgo

PS If you are not yet reviewing the daily post market trading results blog posts, please do so, they are on the blog daily and often there is information that also may assist your trading. Trade room transcripts (for example) may review topics pertinent to your trading.

Article topics: EPIC, Oil, Algo, Crude Oil FX: $USOIL $WTI, $USO, $UCO, $CL_F, $UWT, $DWT, $ERX, $ERY, $GUSH, $DRIP, Chart, Algorithm, Indicators, Fibonacci

Read More
Post-Market Tues Feb 28 $LIFE, $WTW, $UWT.

Post-Market Tues Feb 28 $LIFE, $WTW, $UWT.

March 1, 2017February 13, 2018 Curt MelonopolyPost Market Report (Trade Results)$LIFE, $UWT, $WTW, Chat Room, Compound trading, Day-trading, Investing, Results, Stocks, Swing Trading, Trading Results

Review of Compound Trading Chat Room Stock Trading, Algorithm Charting Calls and Live Stock Alerts for Monday Feb 28, 2017;  $LIFE, $WTW, $UWT –  $BSTG, $ONTX, $DUST, $VRX, $TRCH, $LGCY, $SSH, $ASM etc …

Intro:

Time stamped entries (in permanent archive) copied to this blog in italics (below) are direct live log chat from chat trade room as they occurred (random chat from myself not applicable or other misc chat deleted). Chat trade room is also video recorded daily for trade archive.

In addition to chat, this trade-room has live voice broadcast (that covers in detail what indicators I am looking for in and out off each trade) and has live chart screen sharing right from my monitor to the room with all indicators I am looking at.

EVERY CALL WE MAKE, EVERY PUBLIC INTERACTION, REPRESENTATION OF TRADE (ON EVERY VENUE) IS VIDEO RECORDED (TRADING ROOM), ON SOCIAL MEDIA OR ON BLOG / WEBSITE TIME-STAMPED FOR PERMANENT RECORD AND ABSOLUTE TRANSPARENCY. PLEASE ALSO REFER TO OUR PUBLIC DISCLOSURE https://compoundtrading.com/disclosure-disclaimer/ .

Notices:

https://twitter.com/CompoundTrading/status/836917297809805313

https://twitter.com/CompoundTrading/status/836916969609678849

We are working on a series of videos that include trades from week of Feb 20 – 24 and various educational topics that we expect to have posted to Youtube by Mar 5, 2017.

Overview Perspective & Review of Markets, Chat Room, Algo Calls, Trades and Alerts:

Tuesday was another calm day for my trading. I traded $WTW and $KITE in morning one for a loss and one for a win and closed my $UWT swing.

Momentum / Note-able Stocks Today (via FinViz):

Ticker Last Change Volume Signal
KITE 70.77 24.53% 9709500 Top Gainers
LXU 10.87 22.96% 2575800 Top Gainers
PBMD 2.93 22.59% 1210300 Top Gainers
AAC 9.17 20.82% 417300 Top Gainers
CRSP 23.73 18.95% 163800 Top Gainers
GRAM 2.90 18.85% 2253500 Top Gainers
NTRI 46.50 18.62% 2087400 New High
IPDN 13.20 14.78% 514300 New High
PRIM 24.86 -2.47% 577782 New High
KITE 70.77 24.53% 9709500 New High
LMIA 13.76 0.07% 89300 Overbought
MASI 90.36 0.19% 1246600 Overbought
BSWN 23.16 0.04% 915083 Unusual Volume
BASI 1.62 9.46% 14931800 Unusual Volume
ROX 1.04 42.49% 14034353 Unusual Volume
SBY 21.53 18.49% 14606200 Unusual Volume
AMBA 58.95 -1.39% 1738100 Upgrades
AAMC 70.30 -1.13% 9727 Earnings Before
ALQA 0.49 -1.98% 284239 Insider Buying

Stocks, ETN’s, ETF’s I am Holding:
I am holding (in order of sizing – all moderately small to micro sizing) $BSTG, $ONTX, $DUST, $VRX,  $TRCH, $LGCY, $SSH, $ASM, $USRM (this is the daytrading portfolio and does not represent swing trading service portfolio):

Trading and The Markets Looking Forward:

Recent notes in post market reports that still apply,

“The small and micro momentum stocks continue to pop, however, traders need to be cautious because often its the low floats and thin trade can be difficult to chip out of positions – caution warranted in many ways.”

“These low float micros have in past signaled the end of a cycle in the market – keep that in mind.”

“Our standard plays that reflect the six algorithm charting we do are all at decisions at either support or resistance so this should get really interesting soon.”

Per yesterday, “Our swing trading side continues to outperform all my expectations for 2017 (you can find the most recent unlocked swing trading newsletter on our blog) – I had a feeling it was going to do well, just didn’t quite expect a grandslam. We’re in the middle of compiling our next set of stock picks for the swing trading members and will have them out over next few days – hopefully that batch will bring the same type of returns as the new year batch did and continue to in most instances.

US Dollar $DXY $USDJPY $UUP:

Per recent; $DXY US Dollar is threatening to the trend reversal side, but not confirmed, awaiting market direction.

Gold $GLD $XAUUSD / Gold Miner’s $GDX:

Per recent; Gold and Miner’s are both at what we consider key resistance. 

Silver $SLV:

Per recent; Silver is at what consider key resistance.

Crude Oil $USOIL $WTI:

Per recent; Crude oil continues to threaten a key support and resistance area that we have used as an area of accumulation long (we’re long as long as the trend is in place – the trend is your friend and we’re trading the range until it isn’t).

Volatility $VIX:

Per recent; Volatility continues its flat line.

$SPY S&P 500:

Per recent, “$SPY continues the break-out. Trade the Fibs and buy the dip until you can’t. Respect stops.”

Natural Gas:

Watch 2.44 – 2.57

$NG_F $NATGAS $UGAZ $DGAZ $UNG range to watch. https://t.co/xDTcrUqyiG

— Melonopoly (@curtmelonopoly) February 27, 2017

$NG_F $NATGAS $UGAZ $DGAZ $UNG https://t.co/pZ0tyXYvR5

— Melonopoly (@curtmelonopoly) February 27, 2017

Momentum Trades:

Per recent; As noted above, the low float micros and small cap issues continue in momo.

Swing Trading:

Per recent; As noted above, our Swing Trading service has sent one out of the park after another. Continues to look good forward.

The Charting Algorithm Twitter feeds can be found here: $WTI (@EPICtheAlgo), $VIX (@VexatiousVIX), $SPY (@FREEDOMtheAlgo), $GLD (@ROSIEtheAlgo), $SLV (@SuperNovaAlgo), $DXY (@DXYUSD_Index).

Compound Trading Stock Chat-room Transcript:

Miscellaneous chatter may be removed.

Announcements in room:

08:52 am Curtis M : Protected: PreMarket Trading Plan Tues Feb 28 $ROX, $SBY, $LIFE, $TEUM, $UGAZ, $GDX, $NUGT https://compoundtrading.com/premarket-trading-plan-tues-feb-28-rox-sby-life-teum-ugaz-gdx-nugt/ … Password: PREMARKET022817

Transcript:

08:47 am Sandra Q : For Curt: Protected: PreMarket Trading Plan Tues Feb 28 $ROX, $SBY, $LIFE, $TEUM, $UGAZ, $GDX, $NUGT https://compoundtrading.com/premarket-trading-plan-tues-feb-28-rox-sby-life-teum-ugaz-gdx-nugt/ … Password: PREMARKET022817
08:52 am Optionsavvy . : gm
08:53 am kevin d : morn 🙂
08:53 am Sandy S : top of the day – wow Target!
08:54 am Optionsavvy . : I will be watching / evaluating INNL long pos today from yest trade posted on twtr. looking to sell into any spike
08:57 am Optionsavvy . : also looking to sell IBB into 300.30 res
08:58 am darnel t : Looking to close $IBB also
08:59 am Optionsavvy . : sorry. no current pos on IBB . looking to short it at that pt
09:01 am Flash G : would like to see b/o in miners for a nice add
09:01 am Optionsavvy . : BAC another one I am looking to short
09:02 am Optionsavvy . : VRX taken to the woodshed in pre
09:04 am Sandra Q : S&P -0.1%.10-yr +0.02%.Euro +0.09% vs. dollar.Crude -0.89% to $53.57.Gold -0.19% to $1,256.35.
09:05 am lenny e : Apple target increased to $151 at UBS
09:10 am MarketMaven M : Amarin revenues up 59% in FY16; shares up 3% premarket $AMRN
09:12 am darnel t : Target gest rocked https://www.thestreet.com/story/14017794/1/target-gets-rocked-by-the-harsh-new-realities-in-retail.html?puc=yahoo&cm_ven=YAHOO
09:18 am Mathew Waterfall : Inflation adjusted down, home prices beat. Letting this open play out looking for bounces across the board
09:20 am Sandra Q : Starting $IONS L pos here
09:22 am Curtis M : Guys, just started a telconference – if not done b4 open I’ll be in chat with trades – conferences continue until Friday fyi
09:23 am Curtis M : Looking mainly at $LIFE
09:23 am Curtis M : $NUGT Miners and $NATGAS
09:25 am Mathew Waterfall : yesterday was hardcore market maker shake out and stop run. Miners should reclaim most of that early in the session IMO
09:25 am Sandra Q : Silver watch for me
09:27 am lenny e : Long start $JNUG
09:28 am kevin d : $SLW add
09:30 am MarketMaven M : L $LIFE
09:31 am MarketMaven M : who shit
09:31 am MarketMaven M : lol oops
09:31 am darnel t : L nugt
09:32 am Curtis M : vol off on $LIFE
09:33 am Sandy S : $rox LOL
09:33 am Curtis M : L $LIFE
09:34 am Curtis M : 4.38 5500
09:34 am kevin d : in some too $LIFE
09:35 am Sandy S : I am too but stop tight
09:37 am darnel t : stopped
09:37 am darnel t : in $LIFE I was stopped for 7 cent loss
09:41 am Curtis M : Long $WTW 2000 14.01 avg
09:42 am Curtis M : $LIFE holding
09:44 am Sandra Q : $WTW who knew lol in with ya 14.12
09:46 am Curtis M : Sold $WTW 14.72
09:46 am Sandra Q : Out too
09:50 am darnel t : Long $TUEM
09:52 am MarketMaven M : darnel $TUEM looks like it could rocket – doing DD
09:53 am Sandy S : In $BASI also small
09:54 am Sandra Q : Timing $X not easy but there’s margin in there Curt
09:54 am Mathew Waterfall : $vRX putting in crazy moves both ways here
09:54 am Curtis M : Just focused on geting out of $LIFE lol
09:55 am Curtis M : Looking for opportunity to ht it one more time hard and spike and bail is plan
09:55 am Curtis M : If $LIFE loses 100 day on 1 I’m out
09:57 am MarketMaven M : $VRX is a traders stock
10:01 am kevin d : $USRM got me a break out day on microcap
10:04 am Curtis M : Chipping in buys at 4.00 ish and will cut soon if t fails $LIFE
10:04 am Sandra Q : lol risky
10:05 am MarketMaven M : can be done but you need a pop – good luck!
10:06 am MarketMaven M : dont try this at home kids lololol
10:06 am lenny e : yup
10:07 am lenny e : $KITE halt and resumptin at 10:25 I think fyi
10:08 am Curtis M : lol lvl 2 on $LIFE there wow roll out
10:08 am darnel t : ya seen that
10:09 am Curtis M : big bumps starting right here, do or die
10:11 am Sandy S : watching $FCX
10:12 am Curtis M : cst avg 4.21 now… ugh just need a pop
10:12 am Sandra Q : might work
10:13 am Sandra Q : 100 day on 1 looks like intra res tho
10:13 am Sandra Q : stoch rsi almost at top u may may wanna jump next 1 min candle
10:14 am Curtis M : waiting for 2nd 1min for 1 complete 5 here
10:15 am Sandra Q : your chip on that load won’t be fluid fyi
10:16 am Sandra Q : jump here
10:19 am darnel t : $ETRM $DRYS jig
10:21 am darnel t : $PPHM too
10:24 am Curtis M : $OVX doesn’t look great may have to close $UWT
10:25 am Mathew Waterfall : $XOM shwoing some weakness as well
10:25 am Mathew Waterfall : usd/jpy making new lows
10:26 am darnel t : $KITE open 79.00 fro 56.83 ola
10:26 am darnel t : sorry 78
10:36 am Flash G : $BNXO pop
10:36 am Flash G : $BNSO
10:37 am Optionsavvy . : SGY one of my oil favs a lil perky today
10:37 am Optionsavvy . : decent RR on SGY with a stop just below
10:39 am Sandra Q : ya like the $SGY idea
10:54 am Flash G : Oil sitting right on that support intra wonder if I should long it here with a tight stop???
10:55 am Curtis M : thinking about closing
10:55 am Curtis M : not sure
10:55 am Mathew Waterfall : Big $USO put orders this AM as well
10:55 am lenny e : Oil Miners Metals likely to be decided today with Trump talk etc
10:56 am Curtis M : yup
10:56 am Curtis M : tough call
10:57 am lenny e : and natty seems to be at decision along with usdjpy too
10:57 am Curtis M : yu
10:57 am Curtis M : yup
10:58 am Sandra Q : Trump trade d day lol
10:58 am Mathew Waterfall : on the mic\
10:58 am Curtis M : kk
10:59 am MarketMaven M : best time of day 🙂
11:00 am kevin d : MM Mat always puts it in perspective:)
11:01 am Flash G : helps ha
11:01 am Flash G : I’m going to try a long CL tight stop
11:02 am Sandra Q : I’ll go with ya Flash small for good vibes
11:07 am Sandra Q : Thanks Mat
11:07 am darnel t : ya Mathew peace
11:07 am Mathew Waterfall : you bet. back in a few
11:07 am Sandy S : Long $CRM swing into ER
11:07 am Curtis M : k
11:08 am kevin d : Closing my corn long – yes corn, I am a corn trader lol
11:09 am darnel t : My $CELG swing going well
11:10 am Curtis M : Closed $LIFE 3.99 loss
11:11 am Curtis M : Closed $UWT swing nice gain
11:12 am Optionsavvy . : SGY fade ugh this tape is fun 😐
11:12 am Sandra Q : CL ugh
11:13 am Sandra Q : out small loss
11:13 am Sandra Q : we’ll see if that trendline marked (white dotted) holds
11:14 am Sandra Q : Here’s Curt’s SMS / Email alert for those that didn’t get it: Close $UWT multi week swing with adds for gain. Closed $LIFE daytrade 3.99 for loss.
11:18 am kevin d : new to room…. like the transparency
11:19 am kevin d : and… seems like there’s some depth here… not flash
11:19 am Sandra Q : welcome kevin!
11:21 am Sandra Q : ya… Kevin… I can tell you that curt and crew are finishing algos this week for final publication on weekend along with a bunch of videos that explain everything so you’ll want to review that on weekend – then they have a press run in March on it all
11:22 am kevin d : curious to see if oil will hold here
11:22 am kevin d : thanks sandra
11:25 am MarketMaven M : looks like a breach on deck
11:25 am Optionsavvy . : shippers all over my scans
11:27 am Optionsavvy . : scan is built on relative vol fwiw
11:27 am Flash G : love trading shippers
11:37 am Sandra Q : looks like lunch
11:37 am lenny e : yup
11:38 am Mathew Waterfall : Maybe after the state of the union and new month tomorrow things will move again
11:38 am MarketMaven M : i do believe so
11:41 am Flash G : nap
11:41 am Sandy S : lol
11:44 am Sandy S : $CBio going well
11:49 am Mathew Waterfall : Whoa. Snap IPO might include a 1 year lock up. Just saw that rumor. 1 year lock up and no voting rights? These guys are clowns
11:49 am Sandra Q : yup
11:53 am Flash G : $TGT curl but too risky imo
12:04 pm Flash G : $CBIO continuation
12:13 pm MarketMaven M : $NFLX lmao
12:14 pm MarketMaven M : add $UGAZ
12:14 pm MarketMaven M : moar
12:16 pm Mathew Waterfall : Still like natty. That double bottom down at 2.52 was a tell for me but the way it trades we could be right back there tomorrow
12:24 pm Sandy S : I’ll try a long on this $SIG wash-out tight stop here we go
12:26 pm MarketMaven M : Ya why not Sandy…. bored… in with you tight stop
12:26 pm Mathew Waterfall : Hold on. Things finally getting flush like out here
12:27 pm Mathew Waterfall : bit 1165 TICK to the downside
12:27 pm Mathew Waterfall : *big
12:27 pm MarketMaven M : ya watching $UVXY here!!
12:37 pm MarketMaven M : i sold for 20 cent loss btwsmall order lol cost lunch
12:38 pm Sandy S : ya down lunch too lololol
12:38 pm Sandy S : shit
12:38 pm Sandy S : looking at brokkers wow and VRX THC wow
12:57 pm lenny e : BTFD lol
01:01 pm Mathew Waterfall : Not much power in the buys right here as of yet. Ticks and breadth aint buying it
01:22 pm Sandy S : Blocks on $FTR on watch
01:22 pm Sandy S : Also $FOLD action looking decent
01:42 pm MarketMaven M : Curt, hate to say it, but you sold early.
01:46 pm Optionsavvy . : I’d be shocked if they didnt push IBB at least another .50 higher
01:46 pm lenny e : Seems “managed markets” is the theme today
01:47 pm Optionsavvy . : IBB prev high was 301.80 on 9/23 but doesnt need all of it just to last caught buyer of size
01:49 pm darnel t : looks like oil is good for another BTFD round wow
01:49 pm Curtis M : yup
01:50 pm Curtis M : range is getting tighter though
01:50 pm Mathew Waterfall : It was based off of comments that they weren’t going to make any ethanol reg changes
01:51 pm Curtis M : yup the comments always come when chart cracks appear – crazy
01:51 pm Mathew Waterfall : managed beyond belief right now. I wish I was flat to be honest this market is stupid right now
01:52 pm Curtis M : crazy
01:52 pm Curtis M : lol
01:52 pm Mathew Waterfall : The more it gets propped up, the larger the reaction that will happen when things let go. The spring is wound tight
01:53 pm Curtis M : oh yeah
01:53 pm lenny e : where’s eric l? APXflow lol bring un the bears!
01:53 pm Sandra Q : he not here today
01:56 pm kevin d : chart was broke on oil?
01:57 pm Curtis M : yup a support trendline (blue)
01:57 pm Curtis M : and at diagonal white trendline
01:57 pm Curtis M : so yup broke twice
01:58 pm Curtis M : last time that happened they came with news also anf it magically repaired
01:58 pm Curtis M : and then its an unatural queeze – so I should learn – bank on the news when the chart breaks with the unnatural squeeze
01:58 pm Curtis M : sad
01:59 pm kevin d : wow ya i just looked back i get it wow wow ya
01:59 pm kevin d : i get the crazy comments now
02:00 pm kevin d : i guess its btd until they let it go
02:00 pm Curtis M : yup
02:09 pm Sandra Q : Curt, about that “tell” on your Twitter feed re: Miner’s and Gold… comments today?
02:09 pm Curtis M : when it picks a direction here either way I am all in lol
02:11 pm Sandra Q : thanks:)
02:12 pm Sandy S : I’ll have to take a look at that tweet
02:18 pm Mathew Waterfall : Some bear flow starting in $SPY. Been a quiet day on the options side. Nothing sticking out for me really other than SPY puts and some $VXX calls
02:22 pm Carol B : Two small gambles here; Long $FOLD starter and long $XIV starter $FOLD ER
02:25 pm MarketMaven M : 2 police officers have been shot in southwest Houston; no word on their conditions – official
02:30 pm darnel t : $KITE rip awseome – I knew it ha
02:38 pm Mathew Waterfall : MOC looking almost a bil to the sell side. Early but not a surprise to see some more selling there
03:05 pm Curtis M : soooo not in to this – will be in office but not in front of screens unles scanners go off – yes, for those who asked we stopped publishing anything public yesterday at all until after this current market decision to respect Gold Silver DXY etc subs – I’ll be here if u need anything – just going to get some paperwork done – we have huge algo reports to complete and vids hopefully by tonight so back at them for now
03:07 pm Mathew Waterfall : That makes two of us. I’m not even really looking at the charts, getting some other stuff done. Don’t really care how we close today all about ON and tomorrow at this point
03:13 pm Sandra Q : I think tomorrow might be ok action
03:30 pm Mathew Waterfall : MiM looks to be coming off a bit
03:37 pm Sandra Q : in $USRM some couldn’t resist on Curt’s tweet lol $USRM 122% EOD HOD lol kool aid fun
03:37 pm Curtis M : funny
03:38 pm Curtis M : ok i’ll come small
03:38 pm Curtis M : small risky wont even alert it
03:38 pm kevin d : ha ha
03:38 pm kevin d : bored titans
03:39 pm lenny e : actually it could run tomorrow again for sure 🙂
03:39 pm lenny e : crazy times
03:39 pm lenny e : look at $OWCP
03:44 pm Curtis M : $PBMD patent news
03:51 pm Mathew Waterfall : See ya tomorrow. If we open flat Im going to go back to bed lol
03:51 pm Curtis M : kk
03:52 pm Curtis M : yup
03:52 pm kevin d : 🙂
03:52 pm Leanne Arnott : hoping for more action tmr for this trader-in-training!
03:53 pm Sandra Q : ya
03:53 pm Sandra Q : they got big reports coming tonight leanne so that will be good for training 🙂
03:53 pm Sandra Q : talked to curt bout it
03:54 pm lenny e : nite all
03:54 pm Leanne Arnott : looking forward to those
03:55 pm kevin d : $USRM closing strong

Be safe out there!

Follow our lead trader on Twitter:

Tweets by curtmelonopoly

Article Topics: $LIFE, $WTW, $UWT – $BSTG, $ONTX, $DUST, $VRX, $TRCH, $LGCY, $SSH, $ASM – $UGAZ, $DGAZ, $NUGT, $DUST, $USLV, $DSLV, $UWT, $DWT, $JNUG, $JDST, Compound Trading, Trading Lessons, Results, Wall Street, Stocks, Day Trading, Swing Trading, Investing, Chat Room, Trading Results, $GLD, $GDX, $USOIL, $WTIC, $USD/JPY, $SPY, $DXY, $VIX, $GC_F, $USO, $UCO, $SCO, $CL_F, S&P 500

Read More
Member Oil Trade Mon Feb 27 Chart Algo FX: $USOIL $WTIC – $USO $CL_F $UWT $DWT $UCO $SCO $ERX $ERY $GUSH $DRIP

Member Oil Trade Mon Feb 27 Chart Algo FX: $USOIL $WTIC – $USO $CL_F $UWT $DWT $UCO $SCO $ERX $ERY $GUSH $DRIP

February 26, 2017March 12, 2017 Epic the AlgoCrude Oil Trading Algorithm (EPIC)$CL_F, $DRIP, $ERX, $ERY, $GUSH, $UCO, $USO, $UWT, Algo, Algorithm, Chart, Crude Oil FX: $USOIL $WTI, DWT, EPIC, Fibonacci, Indicators, Oil

Monday Feb 27, 2017 EPIC the Oil Algo Oil Report (Member Edition). FX: $USOIL $WTIC – $USO $CL_F $UWT $DWT $UCO $SCO $ERX $ERY $GUSH $DRIP

Welcome to my new FX: $USOIL $WTI oil trade report. My name is EPIC the Oil Algo and I am one of six Algorithmic Charting services in development at Compound Trading.

NOTICES:

MULTI-USERS: Institutional / commercial platform now available.

PATENT PHASE: I am now in patent application phase. Stay tuned for agreements concerning disclosure and use coming to members.

24 HOUR TRADE ROOM: My charting transitions from FX $USOIL $WTI to 24hr crude oil futures in 2017 and will have 24 hr crude oil trade room.

SOFTWARE: My algorithmic charting is going to developer coding phase early 2017 for our trader’s dashboard program. Please review my algorithm development process and about my oil algorithm story on our website www.compoundtrading.com and my oil algo charting posts on my Twitter feed and this blog.

HOW MY ALGORITHM WORKS: I am an algorithm in development. My math is based on traditional indicators (up to fifty at any given time each weighted on win ratio merit – all not shown on chart at any given time) – such as simple math calculations relating to price and volume, Fibonacci, simple pivots, moving averages, Gann, Schiff and various other charting, geometric and mathematical factors. I do not yet have AI or Geo Political integration – only math as it relates to traditional indicators with the primary goal being probabilities. I am not a high frequency or bot type algorithm – I am represented on and used on a traditional trading chart as one would normally use as a probability indicator. The goal is to provide our trader’s with an edge when triggering entries and exits on trades with instruments that rely on the price of crude oil (specifically FX: $USOIL $WTI and transitioning to futures in our new 24 hour oil trading room).

Below you will find my simplified view of levels that can be used on a traditional chart (both intra-day and as a swing trader or investor). This work, and subsequent trading, should be considered one decision at a time, “if this happens then this or this are my targets”… price – trigger – trade and so on. Questions to; [email protected], message our lead trader on Twitter, or message a lead trader privately in the trade room.

Visit this link for more information about my oil algorithm development, this link explains how our algorithmic charting is done, this YouTube video explains in summary how my algorithm works https://www.youtube.com/watch?v=LUNyxFoXJp8 this link for more information about our algorithmic stock charting models and what makes them different than most.

EVERY CALL WE MAKE, EVERY PUBLIC INTERACTION, REPRESENTATION OF TRADE (ON EVERY VENUE) IS VIDEO RECORDED (TRADING ROOM), ON SOCIAL MEDIA OR ON BLOG / WEBSITE TIME-STAMPED FOR PERMANENT RECORD AND ABSOLUTE TRANSPARENCY. PLEASE ALSO REFER TO OUR PUBLIC DISCLOSURE https://compoundtrading.com/disclosure-disclaimer/.

FX: $USOIL $WTI Observations:

Below is the link for the live EPIC the Oil Algo Live Trading Chart for Monday Feb 27, 2017.

https://www.tradingview.com/chart/USOIL/SUn4WMy2-EPIC-the-Oil-Algo-Member-Chart-USOIL-WTI/

EPIC, oil, algo, $USOIL, $WTI, Chart
Crude algo intra work sheet 1228 AM Feb 27 FX $USOIL $WTIC #OIL $CL_F CL $USO $UCO $SCO $UWT $DWT #OOTT

Intra-day Crude Oil Trading Range: At time of writing FX $USOIL $WTI is trading at 54.32 at 1228 AM EST Feb 27, 2017. Some thoughts with respect to traditional charting that may help advance the trading edge:

At time of post oil is trading at 54.32.

Our traders are accumulating long in oil related $UWT when trade is near diagonal trendline support I have pointed out in numerous recent reports (blue line at lower side of chart).

There is a diagonal trendline resistance (blue) intraday at 55.27 (trending down) that is considerable (thick line as it comes from previous time price cycles) and a diagonal trendline support below (blue) at 53.31 trending up that has been tested and has held in recent trade (price momentarily lost the line at one point and recovered). Our traders execute trades at these widths with confidence (between 53.31 and 55.27 on the intra).

There is horizontal resistance (yellow) at 54.33 that has been breached a number of times (that can also act as support) and support (yellow) 51.93. Our traders execute trades at these widths with limited confidence (considering trade has breached at least 54.33 with relative ease).

Between the horizontal support and resistance lines are miscellaneous horizontal support and resistance lines (purple) and Fibonacci levels (various other colors not listed – which are the various other thin lines – I’ve marked one with a green arrow) that act as minor intra-day support and resistance.

Also, the Fibonacci based diagonal algo trend-lines lines that make up trading quadrants on various time cycles (in this instance the 30 minute shown – they are white dotted lines) act as intra support and resistance (very light – remember, the thicker the line the more important it is). Also note, price action will default to the white dotted fib algo quad lines when the red dotted alpha algo lines are abandoned (or absent the chart trading range) for one reason or another (but remember the red dotted lines are alpha).

The alpha algo lines (red dotted) also act as intra support and resistance (more-so than the secondary algo lines which are white dotted). There are no alpha algo lines on the current chart.

The most important item on this chart is the diagonal trendline (blue) on a downward trend (that I have mentioned in numerous reports the past weeks). 

The comments below apply again for this week’s trade report. There are no red dotted alpha algo lines or alpha algo targets in the immediate trading range – so this makes targets difficult to predict, I have however marked the most likely secondary algo targets to hit. As soon as oil trades with a confirmed break-out or break-down the alpha algo targets will be in play again and subsequent targeting will also become more clear. At issue (with the alpha algo targets and trendlines) is that while oil is trading in a sideways range it becomes difficult to establish alpha targets. 

Pre previous; There are however now secondary targets along the white dotted algo line – so they are not official calls but are targets noted because there are no alpha targets currently in range – and when there are none we default to the secondary algo lines (white dotted) and time of reports on Tues, Wed and Fri each week (see explanation below).”

Multi Week Trading Range for Swing Trading:

Note: Be careful with the prices you see in the purple boxes on the right of the chart – they do not line up on chart for price action (they are for indicators).

Trade the ranges noted above.

Diagonal Trend Lines:

Diagonal trend-lines (blue). Diagonal trend-lines are critical inflection points. Please review many of my recent posts so you can learn about how important these diagonal trend-lines are. If one is breached you can look to pull-back to next diagonal blue trend line about 90% of the time. Also pay attention to how thick the lines are – the thicker the line the more important because they represent extensions from previous time / price cycles.

Remember you can come in to the chat room to message the trader and REMEMBER I have posted a live chart link earlier in this post so if you can’t see the lines well on this chart above you can go to the live chart link and watch for member live algo chart links through-out the day in your email inbox!

The diagonal trend-lines are marked on main chart above.

Price Action with 20, 50, 100, 200 MA

It is wise to study how the 20, 50, 100, 200 MA trade on each time-frame before trading oil related instruments (see previous posts).

Fibonacci Levels:

Watch the lines for support and resistance. Careful using them as traditional retracement levels with crude because the algo lines etc are more dominant / predictable. But the Fib lines are excellent indicators for intra-day trade support and resistance.

The Fibonacci lines are marked on main chart above.

Horizontal Trend-Lines (purple):

Horizontal trend-lines are not as important as the other indicators reviewed above, however, they do serve as important resistance and support intra-day for tight trading and they are important if thick (in other words they come from previous time / price cycles). WE STARTED TO REPRESENT THE REALLY IMPORTANT LINES IN YELLOW FYI FOR EASE. Refer to chart for current applicable horizontal trend-lines.

Horizontal trendlines are marked on charts above.

Advanced Charting:

Respect support and resistance lines: If you can be patient and take your long and short positions against these yellow lines – that is your highest probability trading.

Oil Time / Price Cycles:

Watch your email and / or my Twitter feed for time price cycles they may start to terminate.

Time / price cycles are the single most important indicator and my record calling them is near 100% – since inception seven months ago. The reason they are so important is that a trader does not want to be holding a crude oil instrument at termination of a time cycle if not absolutely sure if price will go up or down. A trade may choose to enter a large position in advance of a time price cycle termination IF THERE IS A HIGH PROBABILITY OF A DIRECTION IN PRICE and if the market is trading at a really important pivot area. In other words, if the market is trading at the bottom of the upward trending channel at a support (yellow lines) and we knew there was a significant probability of a time cycle about to terminate a trader may enter with a long position. The price really spikes or drops significantly when these important time cycles terminate.

The problem with time / price cycle terminations is they change from minute to minute (depending on where price is on the chart) so you have to be in the trade room to get the alert. Our lead traders will do everything they can in future to send these on SMS but we have to be careful because it can be difficult with so much going on in the room. The reason they (time cycles) change is because they are actually represented by or are geometric shapes in the chart – I know it sounds odd but I have (as I mentioned) hit these calls just shy of 100%. The oil political people know the same algorithmic modeling principles and they ALWAYS TIME THEIR BIG ANNOUNCEMENTS AROUND THE TIME PRICE CYCLE TERMINATIONS.

So if you can picture a triangle on the chart – and price is trading in the triangle – and price is going to come to the edge of the triangle and there is a significant support or resistance or an algo line terminating there too or a target (those type of indications)… then we know there is a high probability of a time and price change. In other words, it is where there are clusters of algorithm points that cross and when price is going to cross over that cluster is where they are. And these are represented on all the different time frames – the larger the time frame – the larger the time price cycle termination – the larger the spike or downdraft. This is where we establish our intra-day quadrants from for sniping trades (which we will put in to the room soon because it looks like the geo political rhetoric is over for a while making them more predictable). Difficult to explain in short. So we will do our best to SMS alert these in future.

Also, the real large or important time / price cycle terminations we know far in advance and they can be put in these newsletters.

If you review my Epic the Oil Algo Twitter feed, my blog posts and my story on our website you will get a feel for how accurate these calls are.

Alpha Algo Trading Trend-Lines (Primary – Red dotted lines. Secondary – White dotted lines):

To determine which algo line is most alpha (or probable) intra day, it is the nearest line to price action. This can also help you determine the trend of trade. If the algo line is trending up the price will follow it up until price is tested at an algorithm indicator (the main tests are diagonal trendlines, horizontal trendlines, time / price cycles etc – as I have shared with you). This is why it is important to watch all the lines because they are all support and resistance. To keep it simple trade the range (yellow lines) as I’ve mentioned but keep an eye on these indicators.

The alpha algo trend-lines are marked on main chart above.

Current Alpha Algo Targets (Red circles):

Your closest target that crude is trending toward is always the most probable. Crude is currently trending toward a target (red circles on chart) Then, your second most probable is the one that is up or down trend depending on whether general price is in an upward or downtrend for the most recent week or so and what your other indicators look like (such as the MA’s I explained above).

The other way to determine which targets are in play is actually quite simple, you will notice that crude trades between the channel lines up and down and up and down and there are various support and resistance along the way. If it hits a target at the top of the channel you can bet most times (unless the next day like today) that the next target hit will be at the bottom of the channel.

Wait for the price to trend toward a target and take your position and watch as price gets closer and closer to the target. Remember, that the machines trade from decision to decision – or in other words from support to next resistance or resistance to next support or when the times come each week on Tuesday Wednesday and Friday they will trend toward the target that market price action determines they go to.

Our lead trader will explain more in the room and do not hesitate to ask our lead trader in the room by private message or on twitter to explain intra day decisions.

The diagonal trend-lines are marked on main chart above.

Current Algo Targets:

While price is in a horizontal range it is unfortunate but predictable alpha algo targets cannot be determined, however, I have added secondary targets to the report as noted above and on chart – but these are not alpha targets so they are not official calls. Below are targets represented on the chart and how many times out of one hundred we calculate each to hit. Keep in mind that recently Friday targets have hit as well as Tues and Wed and that on Friday’s it is common for price to be exactly in between two targets.

16:30 Tuesday Feb 28 – 53.60 (21%), 54.29 (37%), 54.99 (34%), Not an official call, refer to chart.

10:30 Wednesday Mar 1 – 53.39 (19%), 54.56 (35%), 55.00 (32%), Not an official call, refer to chart.

13:00 Friday Mar 3 – 54.29 (29%), (55.00) Not an official call, refer to chart.

Oil Intra-Day Algo Trading Quadrants (white dotted lines):

Intra-day trading quadrants are available on all time – cycles and all of them are not detailed on this charting. The charting above represents the 30 minute trading quadrants. If you require tighter time-frames please email us and we will update charting for the time cycle you are looking for.

Trading quadrants are simply support and resistance lines that can assist your intra-day trading – they are not alpha or primary support and resistance by any measure. Price action does however typically move more assertively when leaving a trading quadrant.

Indicator Methods:

As explained above, my algorithm is a consideration of up to fifty traditional indicators at any one time – each one given its own weight in accordance to its accuracy (win rate). This is how we establish the probability of specific targets hitting (we call them alpha algo targets).

Alpha Algo Targets, Algo Trend-lines, Algo Timing, Quadrants for Intra Snipes:

Algo targets are the red circles – they correspond with important times each week in oil reporting land. Tuesday 4:30 PM, Wednesday 10:30 AM and Friday at 1:00 PM. The red dotted diagonal lines are the algo trend-lines. And the vertical dotted (red or green) are marking the important times each week. You will find that the price of crude will hit one of the alpha algo targets about 90% of the time. In the absence of market direction the machines take price to the next algo line and/or target. Understanding how the price of crude reacts to the algos and how they move price from target to target is critical for intra-day and swing trading crude oil and associated instruments.

You will notice that price action of crude will use these algo trend-lines and act as support and resistance, and that price also often violently moves when an alpha algo line is breached either upward or downward.

We cover this in much more detail in the member updates, trading room. A review of my Twitter feed and previous blog posts will help you understand the relation of these indicators. We will start posting video blogs (for my subscribers) on YouTube (in addition to my daily blog posts) for swing traders that work during regular trading hours.

Also… we will cover how to establish algo trend-lines and price targets future forward (as you have seen me do on my Twitter feed for some time now).

Conclusion:

See you in the live trade room! And again, if you struggle to know how to use these indicators as a trader’s edge, it is recommended (if you have earnestly reviewed all of our documentation first) that you obtain private coaching prior to trading a real account with real money – we recommend you use a paper trading account at first.

You can also send specific questions to our email inbox at [email protected] – if you do this be sure to ask a specific question so it can be answered specifically. When the 24 hour oil trading room opens you will have ample opportunity in that 24 hour room to ask questions also.

Watch my EPIC the Oil Algo Twitter feed for intra day notices and your email in box for member only material intra day also.

EPIC the Oil Algo

Tweets by EPICtheAlgo

PS If you are not yet reviewing the daily post market trading results blog posts, please do so, they are on the blog daily and often there is information that also may assist your trading. Trade room transcripts (for example) may review topics pertinent to your trading.

Article topics: EPIC, Oil, Algo, Crude Oil FX: $USOIL $WTI, $USO, $UCO, $CL_F, $UWT, $DWT, $ERX, $ERY, $GUSH, $DRIP, Chart, Algorithm, Indicators, Fibonacci

Read More
Member Oil Trade Thurs Feb 23 Chart Algo FX: $USOIL $WTIC – $USO $CL_F $UWT $DWT $UCO $SCO $ERX $ERY $GUSH $DRIP

Member Oil Trade Thurs Feb 23 Chart Algo FX: $USOIL $WTIC – $USO $CL_F $UWT $DWT $UCO $SCO $ERX $ERY $GUSH $DRIP

February 23, 2017March 12, 2017 Epic the AlgoCrude Oil Trading Algorithm (EPIC)$CL_F, $DRIP, $ERX, $ERY, $GUSH, $UCO, $USO, $UWT, Algo, Algorithm, Chart, Crude Oil FX: $USOIL $WTI, DWT, EPIC, Fibonacci, Indicators, Oil

Thursday Feb 23, 2017 EPIC the Oil Algo Oil Report (Member Edition). FX: $USOIL $WTIC – $USO $CL_F $UWT $DWT $UCO $SCO $ERX $ERY $GUSH $DRIP

Welcome to my new FX: $USOIL $WTI oil trade report. My name is EPIC the Oil Algo and I am one of six Algorithmic Charting services in development at Compound Trading.

NOTICES:

MULTI-USERS: Institutional / commercial platform now available.

PATENT PHASE: I am now in patent application phase. Stay tuned for agreements concerning disclosure and use coming to members.

24 HOUR TRADE ROOM: My charting transitions from FX $USOIL $WTI to 24hr crude oil futures in 2017 and will have 24 hr crude oil trade room.

SOFTWARE: My algorithmic charting is going to developer coding phase early 2017 for our trader’s dashboard program. Please review my algorithm development process and about my oil algorithm story on our website www.compoundtrading.com and my oil algo charting posts on my Twitter feed and this blog.

HOW MY ALGORITHM WORKS: I am an algorithm in development. My math is based on traditional indicators (up to fifty at any given time each weighted on win ratio merit – all not shown on chart at any given time) – such as simple math calculations relating to price and volume, Fibonacci, simple pivots, moving averages, Gann, Schiff and various other charting, geometric and mathematical factors. I do not yet have AI or Geo Political integration – only math as it relates to traditional indicators with the primary goal being probabilities. I am not a high frequency or bot type algorithm – I am represented on and used on a traditional trading chart as one would normally use as a probability indicator. The goal is to provide our trader’s with an edge when triggering entries and exits on trades with instruments that rely on the price of crude oil (specifically FX: $USOIL $WTI and transitioning to futures in our new 24 hour oil trading room).

Below you will find my simplified view of levels that can be used on a traditional chart (both intra-day and as a swing trader or investor). This work, and subsequent trading, should be considered one decision at a time, “if this happens then this or this are my targets”… price – trigger – trade and so on. Questions to; [email protected], message our lead trader on Twitter, or message a lead trader privately in the trade room.

Visit this link for more information about my oil algorithm development, this link explains how our algorithmic charting is done, this YouTube video explains in summary how my algorithm works https://www.youtube.com/watch?v=LUNyxFoXJp8 this link for more information about our algorithmic stock charting models and what makes them different than most.

EVERY CALL WE MAKE, EVERY PUBLIC INTERACTION, REPRESENTATION OF TRADE (ON EVERY VENUE) IS VIDEO RECORDED (TRADING ROOM), ON SOCIAL MEDIA OR ON BLOG / WEBSITE TIME-STAMPED FOR PERMANENT RECORD AND ABSOLUTE TRANSPARENCY. PLEASE ALSO REFER TO OUR PUBLIC DISCLOSURE https://compoundtrading.com/disclosure-disclaimer/.

FX: $USOIL $WTI Observations:

Below is the link for the live EPIC the Oil Algo Live Trading Chart for Thursday Feb 23, 2017.

https://www.tradingview.com/chart/USOIL/wcw58rcW-EPIC-the-Oil-Algo-Member-Chart-USOIL-WTI/

Crude algo intra work sheet 436 AM Feb 23 FX $USOIL $WTIC #OIL $CL_F CL $USO $UCO $SCO $UWT $DWT #OOTT

Epic, Oil, Algo, $USOIL, $WTI
Crude algo intra work sheet 436 AM Feb 23 FX $USOIL $WTIC #OIL $CL_F CL $USO $UCO $SCO $UWT $DWT #OOTT

Intra-day Crude Oil Trading Range: At time of writing FX $USOIL $WTI is closed trading at 54.38 at 438 AM EST Feb 23, 2017. Some thoughts with respect to traditional charting that may help advance the trading edge:

At time of post oil is trading at 54.38.

Our traders are accumulating long in oil related $UWT when trade is near diagonal trendline support I have pointed out in recent reports (blue).

There is a diagonal trendline resistance (blue) intraday at 55.36 (trending down) that is considerable (thick line as it comes from previous time price cycles) and a diagonal trendline support below (blue) at 53.19 trending up that has been tested and has held in recent trade (price momentarily lost the line at one point and recovered). Trade these widths with confidence (between 53.19 and 55.36 on the intra).

There is horizontal resistance (yellow) at 54.33 that has been breached a number of times (that can also act as support) and support (yellow) 51.93. Trade these widths with limited confidence (considering trade has breached at least 54.33 with relative ease).

Between the horizontal support and resistance lines are miscellaneous horizontal support and resistance lines (purple) and Fibonacci levels (various other colors not listed – the other thin lines – I’ve marked one with a green arrow) that act as minor intra-day support and resistance.

Also, the Fibonacci based diagonal algo trend-lines lines that make up trading quadrants on various time cycles (in this instance the 30 minute shown) (white dotted lines) act as intra support and resistance (very light – remember the thicker the line the more important it is). Also note, price action will default to the white dotted fib algo quad lines when the red dotted alpha algo lines are abandoned (or absent the chart) for one reason or another (but remember the red dotted lines are alpha).

And also remember the alpha algo lines (red dotted) act as intra support and resistance.

The most important item on this chart is the diagonal trendline (blue) on a downward trend (that I have mentioned in reports the past weeks). 

The comments below apply again for this week’s trade report. There are no red dotted alpha algo lines or alpha algo targets in the immediate trading range – so this makes targets difficult to predict, I have however marked the most likely secondary algo targets to hit (as soon as we get a confirmed break-out or break-down the alpha algo targets will become clear for the trend and subsequent targeting will also). 

Pre previous; There are however now secondary targets along the white dotted algo line – so they are not official calls but are targets noted because there are no alpha targets currently in range – and when there are none we default to the secondary algo lines (white dotted) and time of reports on Tues, Wed and Fri each week (see explanation below).”

Also, as mentioned in previous reports, Friday targets are significantly less likely to hit than Tuesday or Wednesday targets. Speaking of which, Wednesday primary algo target was hit exact to the second and penny!

Epic, Algo, Target, Hit, $USOIL
Wed 1030 AM Target Hit to Exact Cent and Second called days in advance! Crude algo intra work sheet 412 AM Feb 23 FX $USOIL $WTIC #OIL $CL_F CL $USO $UCO $SCO $UWT $DWT #OOTT

Multi Week Trading Range for Swing Trading:

Note: Be careful with the prices you see in the purple boxes on the right of the chart – they do not line up on chart for price action (they are for indicators).

Trade the ranges noted above.

Diagonal Trend Lines:

Diagonal trend-lines (blue). Diagonal trend-lines are critical inflection points. Please review many of my recent posts so you can learn about how important these diagonal trend-lines are. If one is breached you can look to pull-back to next diagonal blue trend line about 90% of the time. Also pay attention to how thick the lines are – the thicker the line the more important because they represent extensions from previous time / price cycles.

Remember you can come in to the chat room to message the trader and REMEMBER I have posted a live chart link earlier in this post so if you can’t see the lines well on this chart above you can go to the live chart link and watch for member live algo chart links through-out the day in your email inbox!

The diagonal trend-lines are marked on main chart above.

Price Action with 20, 50, 100, 200 MA

It is wise to study how the 20, 50, 100, 200 MA trade on each time-frame before trading oil related instruments (see previous posts).

Fibonacci Levels:

Watch the lines for support and resistance. Careful using them as traditional retracement levels with crude because the algo lines etc are more dominant / predictable. But the Fib lines are excellent indicators for intra-day trade support and resistance.

The Fibonacci lines are marked on main chart above.

Horizontal Trend-Lines (purple):

Horizontal trend-lines are not as important as the other indicators reviewed above, however, they do serve as important resistance and support intra-day for tight trading and they are important if thick (in other words they come from previous time / price cycles). WE STARTED TO REPRESENT THE REALLY IMPORTANT LINES IN YELLOW FYI FOR EASE. Refer to chart for current applicable horizontal trend-lines.

Horizontal trendlines are marked on charts above.

Advanced Charting:

Respect support and resistance lines: If you can be patient and take your long and short positions against these yellow lines – that is your highest probability trading.

Oil Time / Price Cycles:

Watch your email and / or my Twitter feed for time price cycles they may start to terminate.

Time / price cycles are the single most important indicator and my record calling them is near 100% – since inception seven months ago. The reason they are so important is that a trader does not want to be holding a crude oil instrument at termination of a time cycle if not absolutely sure if price will go up or down. A trade may choose to enter a large position in advance of a time price cycle termination IF THERE IS A HIGH PROBABILITY OF A DIRECTION IN PRICE and if the market is trading at a really important pivot area. In other words, if the market is trading at the bottom of the upward trending channel at a support (yellow lines) and we knew there was a significant probability of a time cycle about to terminate a trader may enter with a long position. The price really spikes or drops significantly when these important time cycles terminate.

The problem with time / price cycle terminations is they change from minute to minute (depending on where price is on the chart) so you have to be in the trade room to get the alert. Our lead traders will do everything they can in future to send these on SMS but we have to be careful because it can be difficult with so much going on in the room. The reason they (time cycles) change is because they are actually represented by or are geometric shapes in the chart – I know it sounds odd but I have (as I mentioned) hit these calls just shy of 100%. The oil political people know the same algorithmic modeling principles and they ALWAYS TIME THEIR BIG ANNOUNCEMENTS AROUND THE TIME PRICE CYCLE TERMINATIONS.

So if you can picture a triangle on the chart – and price is trading in the triangle – and price is going to come to the edge of the triangle and there is a significant support or resistance or an algo line terminating there too or a target (those type of indications)… then we know there is a high probability of a time and price change. In other words, it is where there are clusters of algorithm points that cross and when price is going to cross over that cluster is where they are. And these are represented on all the different time frames – the larger the time frame – the larger the time price cycle termination – the larger the spike or downdraft. This is where we establish our intra-day quadrants from for sniping trades (which we will put in to the room soon because it looks like the geo political rhetoric is over for a while making them more predictable). Difficult to explain in short. So we will do our best to SMS alert these in future.

Also, the real large or important time / price cycle terminations we know far in advance and they can be put in these newsletters.

If you review my Epic the Oil Algo Twitter feed, my blog posts and my story on our website you will get a feel for how accurate these calls are.

Alpha Algo Trading Trend-Lines (Primary – Red dotted lines. Secondary – White dotted lines):

To determine which algo line is most alpha (or probable) intra day, it is the nearest line to price action. This can also help you determine the trend of trade. If the algo line is trending up the price will follow it up until price is tested at an algorithm indicator (the main tests are diagonal trendlines, horizontal trendlines, time / price cycles etc – as I have shared with you). This is why it is important to watch all the lines because they are all support and resistance. To keep it simple trade the range (yellow lines) as I’ve mentioned but keep an eye on these indicators.

The alpha algo trend-lines are marked on main chart above.

Current Alpha Algo Targets (Red circles):

Your closest target that crude is trending toward is always the most probable. Crude is currently trending toward a target (red circles on chart) Then, your second most probable is the one that is up or down trend depending on whether general price is in an upward or downtrend for the most recent week or so and what your other indicators look like (such as the MA’s I explained above).

The other way to determine which targets are in play is actually quite simple, you will notice that crude trades between the channel lines up and down and up and down and there are various support and resistance along the way. If it hits a target at the top of the channel you can bet most times (unless the next day like today) that the next target hit will be at the bottom of the channel.

Wait for the price to trend toward a target and take your position and watch as price gets closer and closer to the target. Remember, that the machines trade from decision to decision – or in other words from support to next resistance or resistance to next support or when the times come each week on Tuesday Wednesday and Friday they will trend toward the target that market price action determines they go to.

Our lead trader will explain more in the room and do not hesitate to ask our lead trader in the room by private message or on twitter to explain intra day decisions.

The diagonal trend-lines are marked on main chart above.

Current Algo Targets:

Per previous report on Monday and notes above; be very cautious of the targets this week – trade is very near very important resistance AND the price action of crude oil is not acting in its natural state. No target on the charting is considered an official call in any way – price action is going to have to return to a normal state (as I mentioned last week Monday, this is the first time this has occurred since my inception). If trade action sorts itself out mid week I will then re-chart and send members official calls. 

I have added secondary targets to the report as noted above and on chart – but these are not alpha targets so they are not official calls.

Tuesday Feb 21 – No official call, refer to chart.

Wednesday Feb 22 – No official call, refer to chart.

Friday Feb 24 – No official call, refer to chart.

Oil Intra-Day Algo Trading Quadrants (white dotted lines):

Intra-day trading quadrants are available on all time – cycles and all of them are not detailed on this charting. The charting above represents the 30 minute trading quadrants. If you require tighter time-frames please email us and we will update charting for the time cycle you are looking for.

Trading quadrants are simply support and resistance lines that can assist your intra-day trading – they are not alpha or primary support and resistance by any measure. Price action does however typically move more assertively when leaving a trading quadrant.

Indicator Methods:

As explained above, my algorithm is a consideration of up to fifty traditional indicators at any one time – each one given its own weight in accordance to its accuracy (win rate). This is how we establish the probability of specific targets hitting (we call them alpha algo targets).

Alpha Algo Targets, Algo Trend-lines, Algo Timing, Quadrants for Intra Snipes:

Algo targets are the red circles – they correspond with important times each week in oil reporting land. Tuesday 4:30 PM, Wednesday 10:30 AM and Friday at 1:00 PM. The red dotted diagonal lines are the algo trend-lines. And the vertical dotted (red or green) are marking the important times each week. You will find that the price of crude will hit one of the alpha algo targets about 90% of the time. In the absence of market direction the machines take price to the next algo line and/or target. Understanding how the price of crude reacts to the algos and how they move price from target to target is critical for intra-day and swing trading crude oil and associated instruments.

You will notice that price action of crude will use these algo trend-lines and act as support and resistance, and that price also often violently moves when an alpha algo line is breached either upward or downward.

We cover this in much more detail in the member updates, trading room. A review of my Twitter feed and previous blog posts will help you understand the relation of these indicators. We will start posting video blogs (for my subscribers) on YouTube (in addition to my daily blog posts) for swing traders that work during regular trading hours.

Also… we will cover how to establish algo trend-lines and price targets future forward (as you have seen me do on my Twitter feed for some time now).

Conclusion:

See you in the live trade room! And again, if you struggle to know how to use these indicators as a trader’s edge, it is recommended (if you have earnestly reviewed all of our documentation first) that you obtain private coaching prior to trading a real account with real money – we recommend you use a paper trading account at first.

You can also send specific questions to our email inbox at [email protected] – if you do this be sure to ask a specific question so it can be answered specifically. When the 24 hour oil trading room opens you will have ample opportunity in that 24 hour room to ask questions also.

Watch my EPIC the Oil Algo Twitter feed for intra day notices and your email in box for member only material intra day also.

EPIC the Oil Algo

Tweets by EPICtheAlgo

PS If you are not yet reviewing the daily post market trading results blog posts, please do so, they are on the blog daily and often there is information that also may assist your trading. Trade room transcripts (for example) may review topics pertinent to your trading.

Article topics: EPIC, Oil, Algo, Crude Oil FX: $USOIL $WTI, $USO, $UCO, $CL_F, $UWT, $DWT, $ERX, $ERY, $GUSH, $DRIP, Chart, Algorithm, Indicators, Fibonacci

Read More
Member Oil Trade Tues Feb 21 Chart Algo FX: $USOIL $WTIC – $USO $CL_F $UWT $DWT $UCO $SCO $ERX $ERY $GUSH $DRIP

Member Oil Trade Tues Feb 21 Chart Algo FX: $USOIL $WTIC – $USO $CL_F $UWT $DWT $UCO $SCO $ERX $ERY $GUSH $DRIP

February 21, 2017March 12, 2017 Epic the AlgoCrude Oil Trading Algorithm (EPIC)$CL_F, $DRIP, $ERX, $ERY, $GUSH, $UCO, $USO, $UWT, Algo, Algorithm, Chart, Crude Oil FX: $USOIL $WTI, DWT, EPIC, Fibonacci, Indicators, Oil

Tuesday Feb 21, 2017 EPIC the Oil Algo Oil Report (Member Edition). FX: $USOIL $WTIC – $USO $CL_F $UWT $DWT $UCO $SCO $ERX $ERY $GUSH $DRIP

Welcome to my new FX: $USOIL $WTI oil trade report. My name is EPIC the Oil Algo and I am one of six Algorithmic Charting services in development at Compound Trading.

NOTICES:

MULTI-USERS: Institutional / commercial platform now available.

PATENT PHASE: I am now in patent application phase. Stay tuned for agreements concerning disclosure and use coming to members.

24 HOUR TRADE ROOM: My charting transitions from FX $USOIL $WTI to 24hr crude oil futures in 2017 and will have 24 hr crude oil trade room.

SOFTWARE: My algorithmic charting is going to developer coding phase early 2017 for our trader’s dashboard program. Please review my algorithm development process and about my oil algorithm story on our website www.compoundtrading.com and my oil algo charting posts on my Twitter feed and this blog.

HOW MY ALGORITHM WORKS: I am an algorithm in development. My math is based on traditional indicators (up to fifty at any given time each weighted on win ratio merit – all not shown on chart at any given time) – such as simple math calculations relating to price and volume, Fibonacci, simple pivots, moving averages, Gann, Schiff and various other charting, geometric and mathematical factors. I do not yet have AI or Geo Political integration – only math as it relates to traditional indicators with the primary goal being probabilities. I am not a high frequency or bot type algorithm – I am represented on and used on a traditional trading chart as one would normally use as a probability indicator. The goal is to provide our trader’s with an edge when triggering entries and exits on trades with instruments that rely on the price of crude oil (specifically FX: $USOIL $WTI and transitioning to futures in our new 24 hour oil trading room).

Below you will find my simplified view of levels that can be used on a traditional chart (both intra-day and as a swing trader or investor). This work, and subsequent trading, should be considered one decision at a time, “if this happens then this or this are my targets”… price – trigger – trade and so on. Questions to; [email protected], message our lead trader on Twitter, or message a lead trader privately in the trade room.

Visit this link for more information about my oil algorithm development, this link explains how our algorithmic charting is done, this YouTube video explains in summary how my algorithm works https://www.youtube.com/watch?v=LUNyxFoXJp8 this link for more information about our algorithmic stock charting models and what makes them different than most.

EVERY CALL WE MAKE, EVERY PUBLIC INTERACTION, REPRESENTATION OF TRADE (ON EVERY VENUE) IS VIDEO RECORDED (TRADING ROOM), ON SOCIAL MEDIA OR ON BLOG / WEBSITE TIME-STAMPED FOR PERMANENT RECORD AND ABSOLUTE TRANSPARENCY. PLEASE ALSO REFER TO OUR PUBLIC DISCLOSURE https://compoundtrading.com/disclosure-disclaimer/.

FX: $USOIL $WTI Observations:

Below is the link for the live EPIC the Oil Algo Live Trading Chart for Tuesday Feb 21, 2017.

https://www.tradingview.com/chart/USOIL/Ur2Oof5u-EPIC-the-Oil-Algo-Member-Chart-USOIL-WTI/

Oil, Algo, Epic, $USOIL, $WTI, Chart
Crude oil algo chart intra 1135 PM Feb 20 FX $USOIL $WTIC #OIL $CL_F CL $USO $UCO $SCO $UWT $DWT #OOTT

Intra-day Crude Oil Trading Range: At time of writing FX $USOIL $WTI is closed trading at 54.01 at 1135 PM EST Feb 20, 2016. Some thoughts with respect to traditional charting that may help advance the trading edge:

At time of post oil is trading at 54.01 – sideways range bound trade for a number of weeks now. HOWEVER, an important resistance is on deck in overnight trade.

Our traders are accumulating long in oil related $UWT when trade is near diagonal trendline support I have pointed out in recent reports (blue).

Per previous; HOWEVER, caution is warranted because Friday targets are not as predictable as the Tuesday 4:30 and Wednesday 10:30 AM targets – both of which hit this week. AND, caution is warranted because trade is nearing the upside resistance (yellow) AND the downtrending diagonal resistance line (blue) that is significant that I have noted many times recently is nearing more and more daily. More below.

Friday’s target did not hit as suspected.

There is a diagonal trendline resistance (blue) intraday at 55.45 (trending down) that is considerable (thick line as it comes from previous time price cycles) and a diagonal trendline support below (blue) at 53.00 trending up that has been tested and has held in recent trade (price momentarily lost the line at one point and recovered). Trade these widths with confidence.

There is a significant resistance (yellow) 54.33 and support (yellow) 51.93. Trade these widths with moderate confidence.

Between those primary support and resistance lines are horizontal support and resistance lines (purple) and Fibonacci levels (various other colors not listed – the other thin lines – I’ve marked one with a green arrow) that act as support and resistance.

Also, the Fibonacci based diagonal algo trend-lines lines that make up trading quadrants on various time cycles (in this instance the 30 minute shown) (white dotted) act as intra support and resistance (very light – remember the thicker the line the more important it is). Also note, price action will default to the white dotted fib algo quad lines when the red dotted alpha algo lines are abandoned for one reason or another (but remember the red dotted lines are alpha).

And also remember the alpha algo lines (red dotted) act as intra support and resistance.

The most important item on this chart is the diagonal trendline (blue) on a downward trend (that I have mentioned in reports the past weeks) and the fact that the upcoming resistance at 54.33 area (yellow) has been a challenge for oil trade.

Because trade is getting so close to those two major resistance areas (the diagonal downtrending trendline – blue being the most important) be very careful until trade is above the resistance 54.33 area and the diagonal trendline (blue).

The comments below apply again for this week’s trade report. There are no red dotted alpha algo lines or targets in the immediate trading range – so this makes targets difficult to predict, I have however marked the most likely secondary algo targets to hit (the thicker red circles represent more likely than the others). If trade gets above the main resistance I will update targets immediately as there are alpha targets above resistance. 

Per Monday report, “Also as with last week (which proved to be a wise warning), the algo targets for Tuesday, Wednesday and Friday this week are very difficult to predict – caution is warranted. Trade last week was not typical / consistent with my algorithmic model or backtesting sixty months of trade. Something, and I do not know what, is affecting the price action in crude oil.

There are targets above the important resistance area (54.33) that are in play if price action is above resistance, but if price action is below resistance there are no alpha targets in the sideways price action. 

There are however now secondary targets along the white dotted algo line – so they are not official calls but are targets noted because there are no alpha targets currently in range – and when there are none we default to the secondary algo lines (white dotted) and time of reports on Tues, Wed and Fri each week (see explanation below).”

Upside trade. Crude oil algo chart intra 222 AM Feb 21 FX $USOIL $WTIC #OIL $CL_F CL $USO $UCO $SCO $UWT $DWT #OOTT

EPIC, Oil, Algo, $USOIL, $WTI
Upside trade. Crude oil algo chart intra 222 AM Feb 21 FX $USOIL $WTIC #OIL $CL_F CL $USO $UCO $SCO $UWT $DWT #OOTT

Downside trade. Crude oil algo chart intra 224 AM Feb 21 FX $USOIL $WTIC #OIL $CL_F CL $USO $UCO $SCO $UWT $DWT #OOTT

EPIC, Oil, Algo, $USOIL, $WTI
Downside trade. Crude oil algo chart intra 224 AM Feb 21 FX $USOIL $WTIC #OIL $CL_F CL $USO $UCO $SCO $UWT $DWT #OOTT

Multi Week Trading Range for Swing Trading:

Note: Be careful with the prices you see in the purple boxes on the right of the chart – they do not line up on chart for price action (they are for indicators).

Trade the ranges noted above.

Diagonal Trend Lines:

Diagonal trend-lines (blue). Diagonal trend-lines are critical inflection points. Please review many of my recent posts so you can learn about how important these diagonal trend-lines are. If one is breached you can look to pull-back to next diagonal blue trend line about 90% of the time. Also pay attention to how thick the lines are – the thicker the line the more important because they represent extensions from previous time / price cycles.

Remember you can come in to the chat room to message the trader and REMEMBER I have posted a live chart link earlier in this post so if you can’t see the lines well on this chart above you can go to the live chart link and watch for member live algo chart links through-out the day in your email inbox!

The diagonal trend-lines are marked on main chart above.

Price Action with 20, 50, 100, 200 MA

It is wise to study how the 20, 50, 100, 200 MA trade on each time-frame before trading oil related instruments (see previous posts).

Fibonacci Levels:

Watch the lines for support and resistance. Careful using them as traditional retracement levels with crude because the algo lines etc are more dominant / predictable. But the Fib lines are excellent indicators for intra-day trade support and resistance.

The Fibonacci lines are marked on main chart above.

Horizontal Trend-Lines (purple):

Horizontal trend-lines are not as important as the other indicators reviewed above, however, they do serve as important resistance and support intra-day for tight trading and they are important if thick (in other words they come from previous time / price cycles). WE STARTED TO REPRESENT THE REALLY IMPORTANT LINES IN YELLOW FYI FOR EASE. Refer to chart for current applicable horizontal trend-lines.

Horizontal trendlines are marked on charts above.

Advanced Charting:

Respect support and resistance lines: If you can be patient and take your long and short positions against these yellow lines – that is your highest probability trading.

Oil Time / Price Cycles:

Watch your email and / or my Twitter feed for time price cycles they may start to terminate.

Time / price cycles are the single most important indicator and my record calling them is near 100% – since inception seven months ago. The reason they are so important is that a trader does not want to be holding a crude oil instrument at termination of a time cycle if not absolutely sure if price will go up or down. A trade may choose to enter a large position in advance of a time price cycle termination IF THERE IS A HIGH PROBABILITY OF A DIRECTION IN PRICE and if the market is trading at a really important pivot area. In other words, if the market is trading at the bottom of the upward trending channel at a support (yellow lines) and we knew there was a significant probability of a time cycle about to terminate a trader may enter with a long position. The price really spikes or drops significantly when these important time cycles terminate.

The problem with time / price cycle terminations is they change from minute to minute (depending on where price is on the chart) so you have to be in the trade room to get the alert. Our lead traders will do everything they can in future to send these on SMS but we have to be careful because it can be difficult with so much going on in the room. The reason they (time cycles) change is because they are actually represented by or are geometric shapes in the chart – I know it sounds odd but I have (as I mentioned) hit these calls just shy of 100%. The oil political people know the same algorithmic modeling principles and they ALWAYS TIME THEIR BIG ANNOUNCEMENTS AROUND THE TIME PRICE CYCLE TERMINATIONS.

So if you can picture a triangle on the chart – and price is trading in the triangle – and price is going to come to the edge of the triangle and there is a significant support or resistance or an algo line terminating there too or a target (those type of indications)… then we know there is a high probability of a time and price change. In other words, it is where there are clusters of algorithm points that cross and when price is going to cross over that cluster is where they are. And these are represented on all the different time frames – the larger the time frame – the larger the time price cycle termination – the larger the spike or downdraft. This is where we establish our intra-day quadrants from for sniping trades (which we will put in to the room soon because it looks like the geo political rhetoric is over for a while making them more predictable). Difficult to explain in short. So we will do our best to SMS alert these in future.

Also, the real large or important time / price cycle terminations we know far in advance and they can be put in these newsletters.

If you review my Epic the Oil Algo Twitter feed, my blog posts and my story on our website you will get a feel for how accurate these calls are.

Alpha Algo Trading Trend-Lines (Primary – Red dotted lines. Secondary – White dotted lines):

To determine which algo line is most alpha (or probable) intra day, it is the nearest line to price action. This can also help you determine the trend of trade. If the algo line is trending up the price will follow it up until price is tested at an algorithm indicator (the main tests are diagonal trendlines, horizontal trendlines, time / price cycles etc – as I have shared with you). This is why it is important to watch all the lines because they are all support and resistance. To keep it simple trade the range (yellow lines) as I’ve mentioned but keep an eye on these indicators.

The alpha algo trend-lines are marked on main chart above.

Current Alpha Algo Targets (Red circles):

Your closest target that crude is trending toward is always the most probable. Crude is currently trending toward a target (red circles on chart) Then, your second most probable is the one that is up or down trend depending on whether general price is in an upward or downtrend for the most recent week or so and what your other indicators look like (such as the MA’s I explained above).

The other way to determine which targets are in play is actually quite simple, you will notice that crude trades between the channel lines up and down and up and down and there are various support and resistance along the way. If it hits a target at the top of the channel you can bet most times (unless the next day like today) that the next target hit will be at the bottom of the channel.

Wait for the price to trend toward a target and take your position and watch as price gets closer and closer to the target. Remember, that the machines trade from decision to decision – or in other words from support to next resistance or resistance to next support or when the times come each week on Tuesday Wednesday and Friday they will trend toward the target that market price action determines they go to.

Our lead trader will explain more in the room and do not hesitate to ask our lead trader in the room by private message or on twitter to explain intra day decisions.

The diagonal trend-lines are marked on main chart above.

Current Algo Targets:

Per previous report on Monday and notes above; be very cautious of the targets this week – trade is very near very important resistance AND the price action of crude oil is not acting in its natural state. No target on the charting is considered an official call in any way – price action is going to have to return to a normal state (as I mentioned last week Monday, this is the first time this has occurred since my inception). If trade action sorts itself out mid week I will then re-chart and send members official calls. 

I have added secondary targets to the report as noted above and on chart – but these are not alpha targets so they are not official calls.

Tuesday Feb 21 – No official call, refer to chart.

Wednesday Feb 22 – No official call, refer to chart.

Friday Feb 24 – No official call, refer to chart.

Oil Intra-Day Algo Trading Quadrants (white dotted lines):

Intra-day trading quadrants are available on all time – cycles and all of them are not detailed on this charting. The charting above represents the 30 minute trading quadrants. If you require tighter time-frames please email us and we will update charting for the time cycle you are looking for.

Trading quadrants are simply support and resistance lines that can assist your intra-day trading – they are not alpha or primary support and resistance by any measure. Price action does however typically move more assertively when leaving a trading quadrant.

Indicator Methods:

As explained above, my algorithm is a consideration of up to fifty traditional indicators at any one time – each one given its own weight in accordance to its accuracy (win rate). This is how we establish the probability of specific targets hitting (we call them alpha algo targets).

Alpha Algo Targets, Algo Trend-lines, Algo Timing, Quadrants for Intra Snipes:

Algo targets are the red circles – they correspond with important times each week in oil reporting land. Tuesday 4:30 PM, Wednesday 10:30 AM and Friday at 1:00 PM. The red dotted diagonal lines are the algo trend-lines. And the vertical dotted (red or green) are marking the important times each week. You will find that the price of crude will hit one of the alpha algo targets about 90% of the time. In the absence of market direction the machines take price to the next algo line and/or target. Understanding how the price of crude reacts to the algos and how they move price from target to target is critical for intra-day and swing trading crude oil and associated instruments.

You will notice that price action of crude will use these algo trend-lines and act as support and resistance, and that price also often violently moves when an alpha algo line is breached either upward or downward.

We cover this in much more detail in the member updates, trading room. A review of my Twitter feed and previous blog posts will help you understand the relation of these indicators. We will start posting video blogs (for my subscribers) on YouTube (in addition to my daily blog posts) for swing traders that work during regular trading hours.

Also… we will cover how to establish algo trend-lines and price targets future forward (as you have seen me do on my Twitter feed for some time now).

Conclusion:

See you in the live trade room! And again, if you struggle to know how to use these indicators as a trader’s edge, it is recommended (if you have earnestly reviewed all of our documentation first) that you obtain private coaching prior to trading a real account with real money – we recommend you use a paper trading account at first.

You can also send specific questions to our email inbox at [email protected] – if you do this be sure to ask a specific question so it can be answered specifically. When the 24 hour oil trading room opens you will have ample opportunity in that 24 hour room to ask questions also.

Watch my EPIC the Oil Algo Twitter feed for intra day notices and your email in box for member only material intra day also.

EPIC the Oil Algo

Tweets by EPICtheAlgo

PS If you are not yet reviewing the daily post market trading results blog posts, please do so, they are on the blog daily and often there is information that also may assist your trading. Trade room transcripts (for example) may review topics pertinent to your trading.

Article topics: EPIC, Oil, Algo, Crude Oil FX: $USOIL $WTI, $USO, $UCO, $CL_F, $UWT, $DWT, $ERX, $ERY, $GUSH, $DRIP, Chart, Algorithm, Indicators, Fibonacci

Read More
Member Oil Trade Fri Feb 17 Chart Algo FX: $USOIL $WTIC – $USO $CL_F $UWT $DWT $UCO $SCO $ERX $ERY $GUSH $DRIP

Member Oil Trade Fri Feb 17 Chart Algo FX: $USOIL $WTIC – $USO $CL_F $UWT $DWT $UCO $SCO $ERX $ERY $GUSH $DRIP

February 17, 2017February 20, 2017 Epic the AlgoCrude Oil Trading Algorithm (EPIC)$CL_F, $DRIP, $ERX, $ERY, $GUSH, $UCO, $USO, $UWT, Algo, Algorithm, Chart, Crude Oil FX: $USOIL $WTI, DWT, EPIC, Fibonacci, Indicators, Oil

Friday Feb 17, 2017 EPIC the Oil Algo Oil Report (Member Edition). FX: $USOIL $WTIC – $USO $CL_F $UWT $DWT $UCO $SCO $ERX $ERY $GUSH $DRIP

Welcome to my new FX: $USOIL $WTI oil trade report. My name is EPIC the Oil Algo and I am one of six Algorithmic Charting services in development at Compound Trading.

NOTICES:

This weekend’s report will be significant in size and significant with respect to targets – be sure to review before trade next week! The report below is a quick update!

Recent Webinars: Below is a 20 minute webinar video that explains how my algorithmic charting is represented on a classic trading chart:

MULTI-USERS: Institutional / commercial platform now available.

PATENT PHASE: I am now in patent application phase. Stay tuned for agreements concerning disclosure and use coming to members.

24 HOUR TRADE ROOM: My charting transitions from FX $USOIL $WTI to 24hr crude oil futures early 2017 and will have 24 hr crude oil trade room.

SOFTWARE: My algorithmic charting is going to developer coding phase early 2017 for our trader’s dashboard program. Please review my algorithm development process and about my oil algorithm story on our website www.compoundtrading.com and my oil algo charting posts on my Twitter feed and this blog.

HOW MY ALGORITHM WORKS: I am an algorithm in development. My math is based on traditional indicators (up to fifty at any given time each weighted on win ratio merit – all not shown on chart at any given time) – such as simple math calculations relating to price and volume, Fibonacci, simple pivots, moving averages, Gann, Schiff and various other charting, geometric and mathematical factors. I do not yet have AI or Geo Political integration – only math as it relates to traditional indicators with the primary goal being probabilities. I am not a high frequency or bot type algorithm – I am represented on and used on a traditional trading chart as one would normally use as a probability indicator. The goal is to provide our trader’s with an edge when triggering entries and exits on trades with instruments that rely on the price of crude oil (specifically FX: $USOIL $WTI and transitioning to futures in the new year in our new 24 hour oil trading room).

Below you will find my simplified view of levels that can be used on a traditional chart (both intra-day and as a swing trader or investor). This work, and subsequent trading, should be considered one decision at a time, “if this happens then this or this are my targets”… price – trigger – trade and so on. Questions to; [email protected], message our lead trader on Twitter, or message a lead trader privately in the trade room.

Visit this link for more information about my oil algorithm development, this link explains how our algorithmic charting is done and this link for more information about our algorithmic stock charting models and what makes them different than most.

EVERY CALL WE MAKE, EVERY PUBLIC INTERACTION, REPRESENTATION OF TRADE (ON EVERY VENUE) IS VIDEO RECORDED (TRADING ROOM), ON SOCIAL MEDIA OR ON BLOG / WEBSITE TIME-STAMPED FOR PERMANENT RECORD AND ABSOLUTE TRANSPARENCY. PLEASE ALSO REFER TO OUR PUBLIC DISCLOSURE https://compoundtrading.com/disclosure-disclaimer/.

FX: $USOIL $WTI Observations:

Below is the link for the live EPIC the Oil Algo Live Trading Chart for Friday Feb 17, 2017.

https://www.tradingview.com/chart/USOIL/N0YuJ5B5-EPIC-the-Oil-Algo-Member-Chart-USOIL-WTI/

EPIC, Oil, Algo, $USOIL, $WTI, Chart
Crude algo intra work sheet 429 AM Feb 16 FX $USOIL $WTIC #OIL $CL_F CL $USO $UCO $SCO $UWT $DWT #OOTT

Intra-day Crude Oil Trading Range: At time of writing FX $USOIL $WTI is closed trading at 53.23 at 4:29 AM EST Feb 17, 2016. Some thoughts with respect to traditional charting that may help advance the trading edge:

At time of post oil is trading at 53.23 – sideways range bound trade for a number of weeks now.

Our traders are accumulating long in oil related $UWT when trade is near diagonal trendline support I have pointed out in recent reports (blue). HOWEVER, caution is warranted because Friday targets are not as predictable as the Tuesday 4:30 and Wednesday 10:30 AM targets – both of which hit this week. AND, caution is warranted because trade is nearing the upside resistance (yellow) AND the downtrending diagonal resistance line (blue) that is significant that I have noted many times recently is nearing more and more daily. More below.

There is a diagonal trendline resistance (blue) intraday at 55.54 (trending down) that is considerable (thick line as it comes from previous time price cycles) and a diagonal trendline support below (blue) at 52.86 trending up that has been tested and has held in recent trade (price momentarily lost the line to the downside last week and recovered). Trade these widths with confidence.

There is a significant resistance (yellow) 54.33 and support (yellow) 51.93. Trade these widths with moderate confidence.

Between those primary support and resistance lines are horizontal support and resistance lines (purple) and Fibonacci levels (various other colors not listed – the other thin lines – I’ve marked one with a green arrow) that act as support and resistance.

Also, the Fibonacci based diagonal algo trend-lines lines that make up trading quadrants on various time cycles (in this instance the 30 minute shown) (white dotted) act as intra support and resistance (very light – remember the thicker the line the more important it is). Also note, price action will default to the white dotted fib algo quad lines when the red dotted alpha algo lines are abandoned for one reason or another (but remember the red dotted lines are alpha).

And also remember the alpha algo lines (red dotted) act as intra support and resistance.

The most important item on this chart is a diagonal trendline (blue) not shown that intra-day is at 55.54 on a downward trend (that I have mentioned in reports the past weeks) and the fact that the upcoming resistance at 54.33 area (yellow) has been a challenge for oil trade.

Because trade is getting so close to those two major resistance areas (the diagonal trendline – blue at 55.54 being the most important) be very careful until trade is above the resistance 54.33 area and the diagonal trendline (blue). 

Per Monday report, “Also as with last week (which proved to be a wise warning), the algo targets for Tuesday, Wednesday and Friday this week are very difficult to predict – caution is warranted. Trade last week was not typical / consistent with my algorithmic model or backtesting sixty months of trade. Something, and I do not know what, is affecting the price action in crude oil.

There are targets above the important resistance area (54.33) that are in play if price action is above resistance, but if price action is below resistance there are no alpha targets in the sideways price action. 

There are however now secondary targets along the white dotted algo line – so they are not official calls but are targets noted because there are no alpha targets currently in range – and when there are none we default to the secondary algo lines (white dotted) and time of reports on Tues, Wed and Fri each week (see explanation below).”

So it ends up that both Tuesday and Wednesday targets were direct hits! So this is good, but as above notes, DO NOT rely on that Friday target.

Tuesday 1630 EST Algo Target Zone (Red Circle). Crude algo intra work sheet 326 PM Feb 14 FX $USOIL $WTIC #OIL $CL_F CL $USO $UCO $SCO $UWT $DWT #OOTT

EPIC, Oil, Algo, Chart,
Tuesday 1630 EST Algo Target Zone (Red Circle). Crude algo intra work sheet 326 PM Feb 14 FX $USOIL $WTIC #OIL $CL_F CL $USO $UCO $SCO $UWT $DWT #OOTT

Wed #EIA 1030 target call area hit! Within 6 cents of time and price called. Crude algo intra work sheet 1030 AM Feb 15 FX $USOIL $WTIC #OIL $CL_F CL $USO $UCO $SCO $UWT $DWT #OOTT

EPIC, Oil, Algo, #EIA, Target, Hit
Wed #EIA 1030 target call area hit! Within 6 cents of time and price called. Crude algo intra work sheet 1030 AM Feb 15 FX $USOIL $WTIC #OIL $CL_F CL $USO $UCO $SCO $UWT $DWT #OOTT

Multi Week Trading Range for Swing Trading:

Note: Be careful with the prices you see in the purple boxes on the right of the chart – they do not line up on chart for price action (they are for indicators).

Trade the ranges noted above.

Diagonal Trend Lines:

Diagonal trend-lines (blue). Diagonal trend-lines are critical inflection points. Please review many of my recent posts so you can learn about how important these diagonal trend-lines are. If one is breached you can look to pull-back to next diagonal blue trend line about 90% of the time. Also pay attention to how thick the lines are – the thicker the line the more important because they represent extensions from previous time / price cycles.

Remember you can come in to the chat room to message the trader and REMEMBER I have posted a live chart link earlier in this post so if you can’t see the lines well on this chart above you can go to the live chart link and watch for member live algo chart links through-out the day in your email inbox!

The diagonal trend-lines are marked on main chart above.

Price Action with 20, 50, 100, 200 MA

It is wise to study how the 20, 50, 100, 200 MA trade on each time-frame before trading oil related instruments (see previous posts).

Fibonacci Levels:

Watch the lines for support and resistance. Careful using them as traditional retracement levels with crude because the algo lines etc are more dominant / predictable. But the Fib lines are excellent indicators for intra-day trade support and resistance.

The Fibonacci lines are marked on main chart above.

Horizontal Trend-Lines (purple):

Horizontal trend-lines are not as important as the other indicators reviewed above, however, they do serve as important resistance and support intra-day for tight trading and they are important if thick (in other words they come from previous time / price cycles). WE STARTED TO REPRESENT THE REALLY IMPORTANT LINES IN YELLOW FYI FOR EASE. Refer to chart for current applicable horizontal trend-lines.

Horizontal trendlines are marked on charts above.

Advanced Charting:

Respect support and resistance lines: If you can be patient and take your long and short positions against these yellow lines – that is your highest probability trading.

Oil Time / Price Cycles:

Watch your email and / or my Twitter feed for time price cycles they may start to terminate.

Time / price cycles are the single most important indicator and my record calling them is near 100% – since inception seven months ago. The reason they are so important is that a trader does not want to be holding a crude oil instrument at termination of a time cycle if not absolutely sure if price will go up or down. A trade may choose to enter a large position in advance of a time price cycle termination IF THERE IS A HIGH PROBABILITY OF A DIRECTION IN PRICE and if the market is trading at a really important pivot area. In other words, if the market is trading at the bottom of the upward trending channel at a support (yellow lines) and we knew there was a significant probability of a time cycle about to terminate a trader may enter with a long position. The price really spikes or drops significantly when these important time cycles terminate.

The problem with time / price cycle terminations is they change from minute to minute (depending on where price is on the chart) so you have to be in the trade room to get the alert. Our lead traders will do everything they can in future to send these on SMS but we have to be careful because it can be difficult with so much going on in the room. The reason they (time cycles) change is because they are actually represented by or are geometric shapes in the chart – I know it sounds odd but I have (as I mentioned) hit these calls just shy of 100%. The oil political people know the same algorithmic modeling principles and they ALWAYS TIME THEIR BIG ANNOUNCEMENTS AROUND THE TIME PRICE CYCLE TERMINATIONS.

So if you can picture a triangle on the chart – and price is trading in the triangle – and price is going to come to the edge of the triangle and there is a significant support or resistance or an algo line terminating there too or a target (those type of indications)… then we know there is a high probability of a time and price change. In other words, it is where there are clusters of algorithm points that cross and when price is going to cross over that cluster is where they are. And these are represented on all the different time frames – the larger the time frame – the larger the time price cycle termination – the larger the spike or downdraft. This is where we establish our intra-day quadrants from for sniping trades (which we will put in to the room soon because it looks like the geo political rhetoric is over for a while making them more predictable). Difficult to explain in short. So we will do our best to SMS alert these in future.

Also, the real large or important time / price cycle terminations we know far in advance and they can be put in these newsletters.

If you review my Epic the Oil Algo Twitter feed, my blog posts and my story on our website you will get a feel for how accurate these calls are.

Alpha Algo Trading Trend-Lines (Primary – Red dotted lines. Secondary – White dotted lines):

To determine which algo line is most alpha (or probable) intra day, it is the nearest line to price action. This can also help you determine the trend of trade. If the algo line is trending up the price will follow it up until price is tested at an algorithm indicator (the main tests are diagonal trendlines, horizontal trendlines, time / price cycles etc – as I have shared with you). This is why it is important to watch all the lines because they are all support and resistance. To keep it simple trade the range (yellow lines) as I’ve mentioned but keep an eye on these indicators.

The alpha algo trend-lines are marked on main chart above.

Current Alpha Algo Targets (Red circles):

Your closest target that crude is trending toward is always the most probable. Crude is currently trending toward a target (red circles on chart) Then, your second most probable is the one that is up or down trend depending on whether general price is in an upward or downtrend for the most recent week or so and what your other indicators look like (such as the MA’s I explained above).

The other way to determine which targets are in play is actually quite simple, you will notice that crude trades between the channel lines up and down and up and down and there are various support and resistance along the way. If it hits a target at the top of the channel you can bet most times (unless the next day like today) that the next target hit will be at the bottom of the channel.

Wait for the price to trend toward a target and take your position and watch as price gets closer and closer to the target. Remember, that the machines trade from decision to decision – or in other words from support to next resistance or resistance to next support or when the times come each week on Tuesday Wednesday and Friday they will trend toward the target that market price action determines they go to.

Our lead trader will explain more in the room and do not hesitate to ask our lead trader in the room by private message or on twitter to explain intra day decisions.

The diagonal trend-lines are marked on main chart above.

Current Algo Targets:

Per previous report on Monday and notes above; be very cautious of the targets this week – trade is very near very important resistance AND the price action of crude oil is not acting in its natural state. No target on the charting is considered an official call in any way – price action is going to have to return to a normal state (as I mentioned last week Monday, this is the first time this has occurred since my inception). If trade action sorts itself out mid week I will then re-chart and send members official calls. 

I have added secondary targets to the report as noted above and on chart – but these are not alpha targets so they are not official calls.

Tuesday Feb 14 – No official call, refer to chart.

Wednesday Feb 15 – No official call, refer to chart.

Friday Feb 17 – No official call, refer to chart.

Oil Intra-Day Algo Trading Quadrants (white dotted lines):

Intra-day trading quadrants are available on all time – cycles and all of them are not detailed on this charting. The charting above represents the 30 minute trading quadrants. If you require tighter time-frames please email us and we will update charting for the time cycle you are looking for.

Trading quadrants are simply support and resistance lines that can assist your intra-day trading – they are not alpha or primary support and resistance by any measure. Price action does however typically move more assertively when leaving a trading quadrant.

Indicator Methods:

As explained above, my algorithm is a consideration of up to fifty traditional indicators at any one time – each one given its own weight in accordance to its accuracy (win rate). This is how we establish the probability of specific targets hitting (we call them alpha algo targets).

Alpha Algo Targets, Algo Trend-lines, Algo Timing, Quadrants for Intra Snipes:

Algo targets are the red circles – they correspond with important times each week in oil reporting land. Tuesday 4:30 PM, Wednesday 10:30 AM and Friday at 1:00 PM. The red dotted diagonal lines are the algo trend-lines. And the vertical dotted (red or green) are marking the important times each week. You will find that the price of crude will hit one of the alpha algo targets about 90% of the time. In the absence of market direction the machines take price to the next algo line and/or target. Understanding how the price of crude reacts to the algos and how they move price from target to target is critical for intra-day and swing trading crude oil and associated instruments.

You will notice that price action of crude will use these algo trend-lines and act as support and resistance, and that price also often violently moves when an alpha algo line is breached either upward or downward.

We cover this in much more detail in the member updates, trading room. A review of my Twitter feed and previous blog posts will help you understand the relation of these indicators. We will start posting video blogs (for my subscribers) on YouTube (in addition to my daily blog posts) for swing traders that work during regular trading hours.

Also… we will cover how to establish algo trend-lines and price targets future forward (as you have seen me do on my Twitter feed for some time now).

Conclusion:

See you in the live trade room! And again, if you struggle to know how to use these indicators as a trader’s edge, it is recommended (if you have earnestly reviewed all of our documentation first) that you obtain private coaching prior to trading a real account with real money – we recommend you use a paper trading account at first.

You can also send specific questions to our email inbox at [email protected] – if you do this be sure to ask a specific question so it can be answered specifically. When the 24 hour oil trading room opens you will have ample opportunity in that 24 hour room to ask questions also.

Watch my EPIC the Oil Algo Twitter feed for intra day notices and your email in box for member only material intra day also.

EPIC the Oil Algo

Tweets by EPICtheAlgo

PS If you are not yet reviewing the daily post market trading results blog posts, please do so, they are on the blog daily and often there is information that also may assist your trading. Trade room transcripts (for example) may review topics pertinent to your trading.

Article topics: EPIC, Oil, Algo, Crude Oil FX: $USOIL $WTI, $USO, $UCO, $CL_F, $UWT, $DWT, $ERX, $ERY, $GUSH, $DRIP, Chart, Algorithm, Indicators, Fibonacci


Read More
Member Oil Trade Thurs Feb 16 Chart Algo FX: $USOIL $WTIC – $USO $CL_F $UWT $DWT $UCO $SCO $ERX $ERY $GUSH $DRIP

Member Oil Trade Thurs Feb 16 Chart Algo FX: $USOIL $WTIC – $USO $CL_F $UWT $DWT $UCO $SCO $ERX $ERY $GUSH $DRIP

February 16, 2017February 20, 2017 Epic the AlgoCrude Oil Trading Algorithm (EPIC)$CL_F, $DRIP, $ERX, $ERY, $GUSH, $UCO, $USO, $UWT, Algo, Algorithm, Chart, Crude Oil FX: $USOIL $WTI, DWT, EPIC, Fibonacci, Indicators, Oil

Thursday Feb 16, 2017 EPIC the Oil Algo Oil Report (Member Edition). FX: $USOIL $WTIC – $USO $CL_F $UWT $DWT $UCO $SCO $ERX $ERY $GUSH $DRIP

Welcome to my new FX: $USOIL $WTI oil trade report. My name is EPIC the Oil Algo and I am one of six Algorithmic Charting services in development at Compound Trading.

NOTICES:

Recent Webinars: Below is a 20 minute webinar video that explains how my algorithmic charting is represented on a classic trading chart:

MULTI-USERS: Institutional / commercial platform now available.

PATENT PHASE: I am now in patent application phase. Stay tuned for agreements concerning disclosure and use coming to members.

24 HOUR TRADE ROOM: My charting transitions from FX $USOIL $WTI to 24hr crude oil futures early 2017 and will have 24 hr crude oil trade room.

SOFTWARE: My algorithmic charting is going to developer coding phase early 2017 for our trader’s dashboard program. Please review my algorithm development process and about my oil algorithm story on our website www.compoundtrading.com and my oil algo charting posts on my Twitter feed and this blog.

HOW MY ALGORITHM WORKS: I am an algorithm in development. My math is based on traditional indicators (up to fifty at any given time each weighted on win ratio merit – all not shown on chart at any given time) – such as simple math calculations relating to price and volume, Fibonacci, simple pivots, moving averages, Gann, Schiff and various other charting, geometric and mathematical factors. I do not yet have AI or Geo Political integration – only math as it relates to traditional indicators with the primary goal being probabilities. I am not a high frequency or bot type algorithm – I am represented on and used on a traditional trading chart as one would normally use as a probability indicator. The goal is to provide our trader’s with an edge when triggering entries and exits on trades with instruments that rely on the price of crude oil (specifically FX: $USOIL $WTI and transitioning to futures in the new year in our new 24 hour oil trading room).

Below you will find my simplified view of levels that can be used on a traditional chart (both intra-day and as a swing trader or investor). This work, and subsequent trading, should be considered one decision at a time, “if this happens then this or this are my targets”… price – trigger – trade and so on. Questions to; [email protected], message our lead trader on Twitter, or message a lead trader privately in the trade room.

Visit this link for more information about my oil algorithm development, this link explains how our algorithmic charting is done and this link for more information about our algorithmic stock charting models and what makes them different than most.

EVERY CALL WE MAKE, EVERY PUBLIC INTERACTION, REPRESENTATION OF TRADE (ON EVERY VENUE) IS VIDEO RECORDED (TRADING ROOM), ON SOCIAL MEDIA OR ON BLOG / WEBSITE TIME-STAMPED FOR PERMANENT RECORD AND ABSOLUTE TRANSPARENCY. PLEASE ALSO REFER TO OUR PUBLIC DISCLOSURE https://compoundtrading.com/disclosure-disclaimer/.

FX: $USOIL $WTI Observations:

Below is the link for the live EPIC the Oil Algo Live Trading Chart for Thursday Feb 16, 2017.

https://www.tradingview.com/chart/USOIL/cozQASVZ-EPIC-the-Oil-Algorithm-Member-Chart-USOIL-WTI/

Oil, Algo, Chart, EPIC, $USOIL, $WTI
Crude algo intra work sheet 538 AM Feb 16 FX $USOIL $WTIC #OIL $CL_F CL $USO $UCO $SCO $UWT $DWT #OOTT

Intra-day Crude Oil Trading Range: At time of writing FX $USOIL $WTI is closed trading at 53.17 at 5:38 AM EST Feb 16, 2016. Some thoughts with respect to traditional charting that may help advance the trading edge:

At time of post oil is trading at 53.17 – sideways range bound trade for a number of weeks now.

Our traders are accumulating long in oil related $UWT when trade is near diagonal trendline support I have pointed out in recent reports (blue). HOWEVER, caution is warranted because Friday targets are not as predictable as the Tuesday 4:30 and Wednesday 10:30 AM targets – both of which hit this week. AND, caution is warranted because trade is nearing the upside resistance (yellow) AND the downtrending diagonal resistance line (blue) that is significant that I have noted many times recently is nearing more and more daily. More below.

There is a diagonal trendline resistance (blue) intraday at 55.58 (trending down) that is considerable (thick line as it comes from previous time price cycles) and a diagonal trendline support below (blue) at 52.80 trending up that has been tested and has held in recent trade (price momentarily lost the line to the downside last week and recovered). Trade these widths with confidence.

There is a significant resistance (yellow) 54.33 and support (yellow) 51.93. Trade these widths with moderate confidence.

Between those primary support and resistance lines are horizontal support and resistance lines (purple) and Fibonacci levels (various other colors not listed – the other thin lines – I’ve marked one with a green arrow) that act as support and resistance.

Also, the Fibonacci based diagonal algo trend-lines lines that make up trading quadrants on various time cycles (in this instance the 30 minute shown) (white dotted) act as intra support and resistance (very light – remember the thicker the line the more important it is). Also note, price action will default to the white dotted fib algo quad lines when the red dotted alpha algo lines are abandoned for one reason or another (but remember the red dotted lines are alpha).

And also remember the alpha algo lines (red dotted) act as intra support and resistance.

The most important item on this chart is a diagonal trendline (blue) not shown that intra-day is at 55.58 on a downward trend (that I have mentioned in reports the past weeks) and the fact that the upcoming resistance at 54.33 area (yellow) has been a challenge for oil trade.

Because trade is getting so close to those two major resistance areas (the diagonal trendline – blue at 55.58 being the most important) be very careful until trade is above the resistance 54.33 area and the diagonal trendline (blue). 

Per Monday report, “Also as with last week (which proved to be a wise warning), the algo targets for Tuesday, Wednesday and Friday this week are very difficult to predict – caution is warranted. Trade last week was not typical / consistent with my algorithmic model or backtesting sixty months of trade. Something, and I do not know what, is affecting the price action in crude oil.

There are targets above the important resistance area (54.33) that are in play if price action is above resistance, but if price action is below resistance there are no alpha targets in the sideways price action. 

There are however now secondary targets along the white dotted algo line – so they are not official calls but are targets noted because there are no alpha targets currently in range – and when there are none we default to the secondary algo lines (white dotted) and time of reports on Tues, Wed and Fri each week (see explanation below).”

So it ends up that both Tuesday and Wednesday targets were direct hits! So this is good, but as above notes, DO NOT rely on that Friday target.

Tuesday 1630 EST Algo Target Zone (Red Circle). Crude algo intra work sheet 326 PM Feb 14 FX $USOIL $WTIC #OIL $CL_F CL $USO $UCO $SCO $UWT $DWT #OOTT

EPIC, Oil, Algo, Chart,
Tuesday 1630 EST Algo Target Zone (Red Circle). Crude algo intra work sheet 326 PM Feb 14 FX $USOIL $WTIC #OIL $CL_F CL $USO $UCO $SCO $UWT $DWT #OOTT

Wed #EIA 1030 target call area hit! Within 6 cents of time and price called. Crude algo intra work sheet 1030 AM Feb 15 FX $USOIL $WTIC #OIL $CL_F CL $USO $UCO $SCO $UWT $DWT #OOTT

EPIC, Oil, Algo, #EIA, Target, Hit
Wed #EIA 1030 target call area hit! Within 6 cents of time and price called. Crude algo intra work sheet 1030 AM Feb 15 FX $USOIL $WTIC #OIL $CL_F CL $USO $UCO $SCO $UWT $DWT #OOTT

Multi Week Trading Range for Swing Trading:

Note: Be careful with the prices you see in the purple boxes on the right of the chart – they do not line up on chart for price action (they are for indicators).

Trade the ranges noted above.

Diagonal Trend Lines:

Diagonal trend-lines (blue). Diagonal trend-lines are critical inflection points. Please review many of my recent posts so you can learn about how important these diagonal trend-lines are. If one is breached you can look to pull-back to next diagonal blue trend line about 90% of the time. Also pay attention to how thick the lines are – the thicker the line the more important because they represent extensions from previous time / price cycles.

Remember you can come in to the chat room to message the trader and REMEMBER I have posted a live chart link earlier in this post so if you can’t see the lines well on this chart above you can go to the live chart link and watch for member live algo chart links through-out the day in your email inbox!

The diagonal trend-lines are marked on main chart above.

Price Action with 20, 50, 100, 200 MA

It is wise to study how the 20, 50, 100, 200 MA trade on each time-frame before trading oil related instruments (see previous posts).

Fibonacci Levels:

Watch the lines for support and resistance. Careful using them as traditional retracement levels with crude because the algo lines etc are more dominant / predictable. But the Fib lines are excellent indicators for intra-day trade support and resistance.

The Fibonacci lines are marked on main chart above.

Horizontal Trend-Lines (purple):

Horizontal trend-lines are not as important as the other indicators reviewed above, however, they do serve as important resistance and support intra-day for tight trading and they are important if thick (in other words they come from previous time / price cycles). WE STARTED TO REPRESENT THE REALLY IMPORTANT LINES IN YELLOW FYI FOR EASE. Refer to chart for current applicable horizontal trend-lines.

Horizontal trendlines are marked on charts above.

Advanced Charting:

Respect support and resistance lines: If you can be patient and take your long and short positions against these yellow lines – that is your highest probability trading.

Oil Time / Price Cycles:

Watch your email and / or my Twitter feed for time price cycles they may start to terminate.

Time / price cycles are the single most important indicator and my record calling them is near 100% – since inception seven months ago. The reason they are so important is that a trader does not want to be holding a crude oil instrument at termination of a time cycle if not absolutely sure if price will go up or down. A trade may choose to enter a large position in advance of a time price cycle termination IF THERE IS A HIGH PROBABILITY OF A DIRECTION IN PRICE and if the market is trading at a really important pivot area. In other words, if the market is trading at the bottom of the upward trending channel at a support (yellow lines) and we knew there was a significant probability of a time cycle about to terminate a trader may enter with a long position. The price really spikes or drops significantly when these important time cycles terminate.

The problem with time / price cycle terminations is they change from minute to minute (depending on where price is on the chart) so you have to be in the trade room to get the alert. Our lead traders will do everything they can in future to send these on SMS but we have to be careful because it can be difficult with so much going on in the room. The reason they (time cycles) change is because they are actually represented by or are geometric shapes in the chart – I know it sounds odd but I have (as I mentioned) hit these calls just shy of 100%. The oil political people know the same algorithmic modeling principles and they ALWAYS TIME THEIR BIG ANNOUNCEMENTS AROUND THE TIME PRICE CYCLE TERMINATIONS.

So if you can picture a triangle on the chart – and price is trading in the triangle – and price is going to come to the edge of the triangle and there is a significant support or resistance or an algo line terminating there too or a target (those type of indications)… then we know there is a high probability of a time and price change. In other words, it is where there are clusters of algorithm points that cross and when price is going to cross over that cluster is where they are. And these are represented on all the different time frames – the larger the time frame – the larger the time price cycle termination – the larger the spike or downdraft. This is where we establish our intra-day quadrants from for sniping trades (which we will put in to the room soon because it looks like the geo political rhetoric is over for a while making them more predictable). Difficult to explain in short. So we will do our best to SMS alert these in future.

Also, the real large or important time / price cycle terminations we know far in advance and they can be put in these newsletters.

If you review my Epic the Oil Algo Twitter feed, my blog posts and my story on our website you will get a feel for how accurate these calls are.

Alpha Algo Trading Trend-Lines (Primary – Red dotted lines. Secondary – White dotted lines):

To determine which algo line is most alpha (or probable) intra day, it is the nearest line to price action. This can also help you determine the trend of trade. If the algo line is trending up the price will follow it up until price is tested at an algorithm indicator (the main tests are diagonal trendlines, horizontal trendlines, time / price cycles etc – as I have shared with you). This is why it is important to watch all the lines because they are all support and resistance. To keep it simple trade the range (yellow lines) as I’ve mentioned but keep an eye on these indicators.

The alpha algo trend-lines are marked on main chart above.

Current Alpha Algo Targets (Red circles):

Your closest target that crude is trending toward is always the most probable. Crude is currently trending toward a target (red circles on chart) Then, your second most probable is the one that is up or down trend depending on whether general price is in an upward or downtrend for the most recent week or so and what your other indicators look like (such as the MA’s I explained above).

The other way to determine which targets are in play is actually quite simple, you will notice that crude trades between the channel lines up and down and up and down and there are various support and resistance along the way. If it hits a target at the top of the channel you can bet most times (unless the next day like today) that the next target hit will be at the bottom of the channel.

Wait for the price to trend toward a target and take your position and watch as price gets closer and closer to the target. Remember, that the machines trade from decision to decision – or in other words from support to next resistance or resistance to next support or when the times come each week on Tuesday Wednesday and Friday they will trend toward the target that market price action determines they go to.

Our lead trader will explain more in the room and do not hesitate to ask our lead trader in the room by private message or on twitter to explain intra day decisions.

The diagonal trend-lines are marked on main chart above.

Current Algo Targets:

Per previous report on Monday and notes above; be very cautious of the targets this week – trade is very near very important resistance AND the price action of crude oil is not acting in its natural state. No target on the charting is considered an official call in any way – price action is going to have to return to a normal state (as I mentioned last week Monday, this is the first time this has occurred since my inception). If trade action sorts itself out mid week I will then re-chart and send members official calls. 

I have added secondary targets to the report as noted above and on chart – but these are not alpha targets so they are not official calls.

Tuesday Feb 14 – No official call, refer to chart.

Wednesday Feb 15 – No official call, refer to chart.

Friday Feb 17 – No official call, refer to chart.

Oil Intra-Day Algo Trading Quadrants (white dotted lines):

Intra-day trading quadrants are available on all time – cycles and all of them are not detailed on this charting. The charting above represents the 30 minute trading quadrants. If you require tighter time-frames please email us and we will update charting for the time cycle you are looking for.

Trading quadrants are simply support and resistance lines that can assist your intra-day trading – they are not alpha or primary support and resistance by any measure. Price action does however typically move more assertively when leaving a trading quadrant.

Indicator Methods:

As explained above, my algorithm is a consideration of up to fifty traditional indicators at any one time – each one given its own weight in accordance to its accuracy (win rate). This is how we establish the probability of specific targets hitting (we call them alpha algo targets).

Alpha Algo Targets, Algo Trend-lines, Algo Timing, Quadrants for Intra Snipes:

Algo targets are the red circles – they correspond with important times each week in oil reporting land. Tuesday 4:30 PM, Wednesday 10:30 AM and Friday at 1:00 PM. The red dotted diagonal lines are the algo trend-lines. And the vertical dotted (red or green) are marking the important times each week. You will find that the price of crude will hit one of the alpha algo targets about 90% of the time. In the absence of market direction the machines take price to the next algo line and/or target. Understanding how the price of crude reacts to the algos and how they move price from target to target is critical for intra-day and swing trading crude oil and associated instruments.

You will notice that price action of crude will use these algo trend-lines and act as support and resistance, and that price also often violently moves when an alpha algo line is breached either upward or downward.

We cover this in much more detail in the member updates, trading room. A review of my Twitter feed and previous blog posts will help you understand the relation of these indicators. We will start posting video blogs (for my subscribers) on YouTube (in addition to my daily blog posts) for swing traders that work during regular trading hours.

Also… we will cover how to establish algo trend-lines and price targets future forward (as you have seen me do on my Twitter feed for some time now).

Conclusion:

See you in the live trade room! And again, if you struggle to know how to use these indicators as a trader’s edge, it is recommended (if you have earnestly reviewed all of our documentation first) that you obtain private coaching prior to trading a real account with real money – we recommend you use a paper trading account at first. And finally, we will be publishing a “how to use guide” soon, but it will be simply be a recap (consolidation) of instructions in this post, from my Twitter feed, and previously published information on our blog and website. You can also send specific questions to our email inbox at [email protected] – if you do this be sure to ask a specific question so it can be answered specifically. When the 24 hour oil trading room opens you will have ample opportunity in that 24 hour room to ask questions also.

Watch my EPIC the Oil Algo Twitter feed for intra day notices and your email in box for member only material intra day also.

EPIC the Oil Algo

Tweets by EPICtheAlgo

PS If you are not yet reviewing the daily post market trading results blog posts, please do so, they are on the blog daily and often there is information that also may assist your trading. Trade room transcripts (for example) may review topics pertinent to your trading.

Article topics: EPIC, Oil, Algo, Crude Oil FX: $USOIL $WTI, $USO, $UCO, $CL_F, $UWT, $DWT, $ERX, $ERY, $GUSH, $DRIP, Chart, Algorithm, Indicators, Fibonacci


Read More

Posts navigation

Older posts
Newer posts
Proudly powered by WordPress | Theme: sharksdesign by reviewexchanger.
 

Loading Comments...