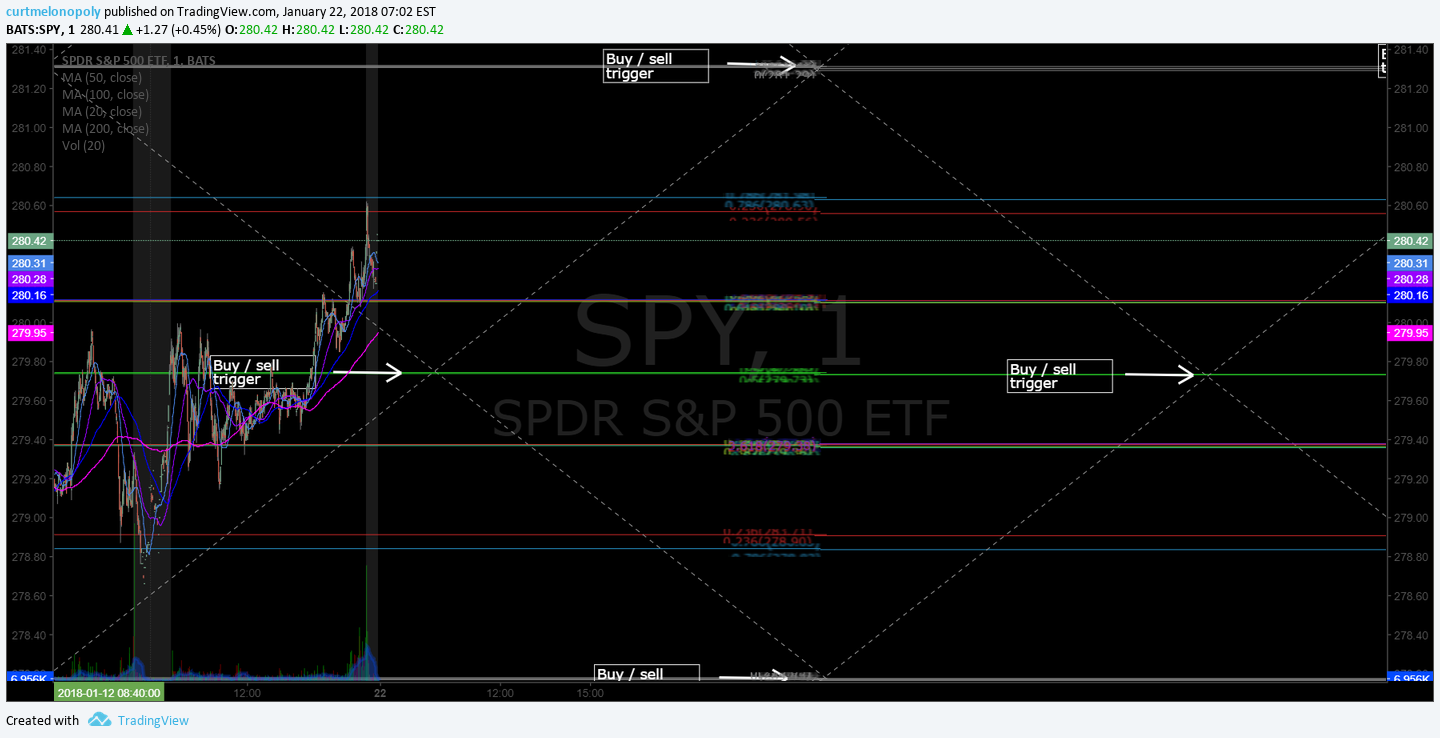
Bitcoin Charting – Algorithm Model Newsletter Jan 28 2018 $BTCUSD $XBTUSD $BTC.X $ETH $LTC $XRP #Bitcoin
Crypto the Bitcoin Algorithm Charting Model Newsletter Sunday January 28, 2018 $BTCUSD $XBTUSD $BTC.X $ETH $LTC $XRP #Bitcoin
Hello! My name is Crypto the Bitcoin Algo. Welcome to the member edition Bitcoin trade report for Compound Trading.
Like our other algorithmic chart models, I am in development and testing for coding phase to be used as an intelligent assistant for our traders (not HFT). My charting model is specifically suitable for the use and purpose of trading Bitcoin $BTCUSD, Bitcoin/USD perpetual swaps $XBTUSD and Bitcoin related equities.
Note: The $XBTUSD model is built on a chart from BitMEX. Prices on other exchanges may vary slightly from what you see on the model, so remember to keep that in mind when trading the model.
Notices:
- More extensive chart models for $BTCUSD, $ETHUSD, $XRPUSD, $LTCUSD and others (such as a few bitcoin related equities) will be featured in future reporting.
- Join us in our private Crypto Trading room on discord!
- For newer users – read the blog post about how to trade Bitcoin here.
Primary Methods of Trade:
Live Twitter Alert Feed for Bitcoin Trades: @BTCAlerts_CT, Public Feed @cryptothealgo
The primary method of trade we have found works with the most predictability is to wait for bitcoin to breach the upper right wall of a quadrant (the orange or grey diagonal dotted lines – the thicker orange lines are more significant) and confirm over the next horizontal Fibonacci resistance. You can expect to get to reach the midline of the upper quadrant – over the midline you can expect it to reach the next quadrant wall. Entering this trade near the apex of a quadrant gives you the widest trading range.
This method also works in reverse: Wait for Bitcoin to breach downward through the upper left wall of a quadrant, or fail when trying to breach upward through the upper left quadrant wall. Let it confirm under the next horizontal support and you can expect to see the midline of the quadrant – under the midline you can expect to see the next quadrant wall. Same as above, entering this trade near the apex of a quadrant gives you the widest trading range.
Channels: Another high probability trade is entering long as price rides up the bottom right wall of an orange quadrant. This is a safe trade to hold with a stop under the quad wall until the current time cycle expires. This trade works in reverse as well. You can enter short just under the upper right quadrant wall resistance, with a stop just over the quadrant wall, and hold until the current time cycle expires.
Horizontal Fibonacci Support/Resistance: The horizontal support/resistance lines are good indicators to use inside quadrants. The light green 0.5 Fibonacci line and the grey 1.0 or 0 fibonacci levels (midlines) are the most significant. Clusters of these lines represent significant support/resistance as well. Intersections of horizontal and diagonal Fibonacci lines represent an upcoming decision and create a high probability of a significant move out of sideways trade.
Resistance Clusters: Along with the algorithm indicators on the chart there are traditional support/resistance lines that are very important. When these lines converge volatility tends to increase. Under the cluster is a high probability short. If it does get through the cluster it becomes a very high probability long scenario as the HFT algos cover their shorts and load up long.
Targets: Red circles on charting. These are placed at the 2 most likely prices in time cycles / trends. These are still in very early stage of development/testing and should be used for observation only at this point. Two are provided for each quadrant time frame – the upper scenario targets should be considered if the trend is up and likewise for the lower. I do not recommend entering trades based on these targets.
Natural / Historical Support/Resistance: Natural / historical support/resistance is represented on the chart by purple horizontal lines.
Conventional Charting: Conventional charting should be weighed against the model(s) with all trade decisions.
Bitcoin Algorithm Live Charting Link:
Algorithm model on the Daily Bitcoin Chart: Click link, then share button at bottom right of screen, then make it mine, then double click on chart body to hide or reveal indicators at bottom of chart (MACD etc).
In summary, our first generation Bitcoin algorithm chart model uses the following indicators (listed from most predictable to least in terms of win rate):
- Trading range created by long term algorithmic modeled quadrant support and resistance (blue dotted lines)
- Trading range between buy/sell trigger levels (grey/green arrows and solid lines)
- Directional channels formed by long term algorithmic modeled support and resistance
- Horizontal Fibonacci support and resistance (multi-colored horizontal lines)
- Conventional Natural support and resistance (purple horizontal lines)
- Long term conventional trend lines (red diagonal lines)
- Conventional MA’s
Observations in the current area of trade:
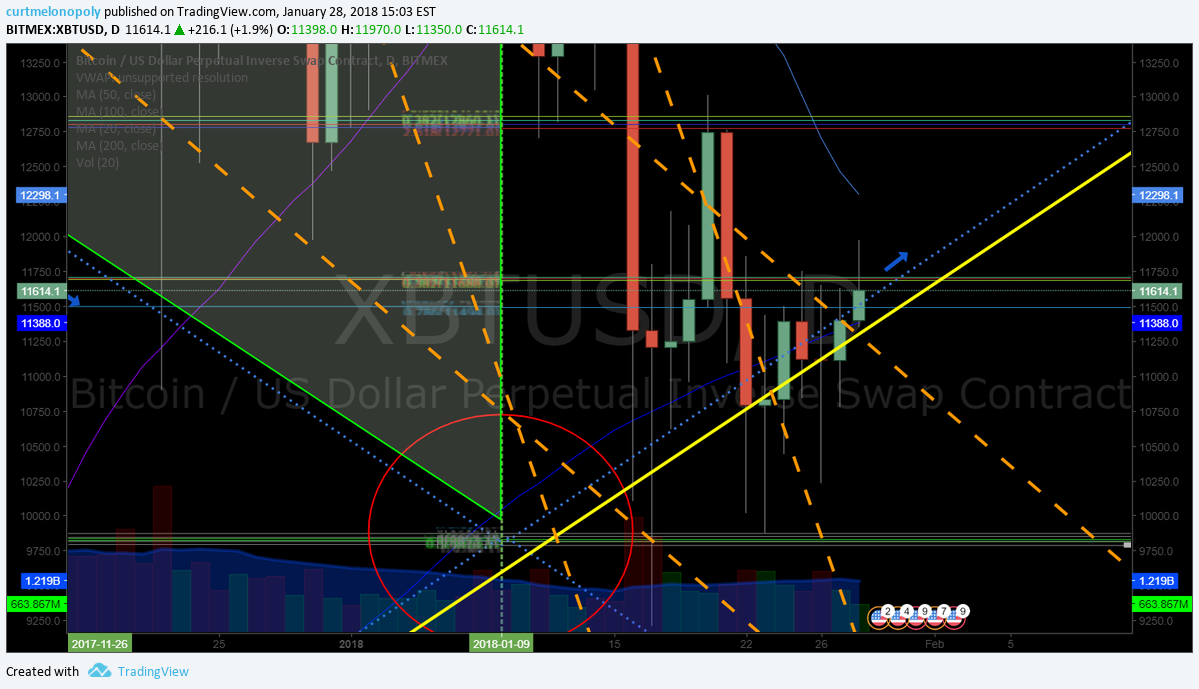
$XBTUSD charting has been performing well. Lower channel support is holding so far. Upper apex target hit and key Jan 9 date seen a significant down trend. Divergent trade prior to Jan 9 (above upper channel resistance line) returned to channel as suggested to members.
Key buy / sell price trigger levels in the current area of trade are as follows:
9882, 13772, 17776, 21736, 25684.
Shorter time-frame indicators such as Fibonacci levels on chart can be used to trade against as support and resistance.
Price trading under 20 MA and 50 MA with 100 MA just below price (watch closely as price is pinched between 100 MA and 20 MA) with 200 MA nearing (pink line).

Bitcoin $XBTUSD conventional charting notes:
White arrows at bottom of chart represent conventional indicators. All indicators suggest (since recent lows) that price trend is up.
Also, upward trending channel in place (highlighted with thick yellow lines), two significant falling wedges played out technically (dotted yellow lines) and the general trend is in play.
Bitcoin Daily Charting – Conventional notes – MACD turning up, Stoch RSI trend up, SQZMOM up $BTCUSD $XBTUSD $BTC.X Jan 28 2018 1455 PM #Bitcoin

Bitcoin Trading Plan
Bitcoin Daily Chart Trading Plan – price above Fib 11707.00 and 20 MA that holds channel support is long add and if that fails I would reconsider the current long position alerted on the Twitter member alert feed near recent bottom. $BTCUSD $XBTUSD $BTC.X Jan 28 2018 1505 PM #Bitcoin

Ethereum Basic Algorithm Charting Model on Daily Time Frame:
$ETHUSD real-time chart:
Ethereum Daily Chart Algorithmic Model Suggests 1240.00 Feb 10 most probable area of trade. $ETHUSD $ETH.X #crypto

Ethereum $ETH Buy sell triggers on the daily algorithm chart model. $ETH.X

Litecoin Basic Algorithm Charting Model
Primary buy sell triggers on Litecoin daily chart:
475.00
381.00
287.00
192.00
98.00
Litecoin $LTC basic algorithm chart model on daily time frame. Jan 28 1556 PM $LTCUSD
Thick yellow lines are prospective upward trending channel. Red circles prospective targets – trade in direction of targets. Buy sell triggers represented as well as trading quadrants, moving averages etc. If trade is indecisive it will tend to terminate at time cycle peak (green verticals) at mid quad horizontal line (green horizontal) at that specific time in chart and not reach an upper apex or lower inverse apex.

Ripple $XRP basic algorithm chart model on daily time frame. Jan 28 1556 PM $XRPUSD
Real-time Ripple $XRP chart link:

< End of report >
Any questions give us a shout anytime!

