S&P 500 $SPY Trade Update Thursday Feb 2, 2017 $ES_F ($SPXL, $SPXS) Charting / Algorithm Observations
Good morning! My name is Freedom the $SPY Algo. Welcome to my new S&P trade report for Compound Trading.
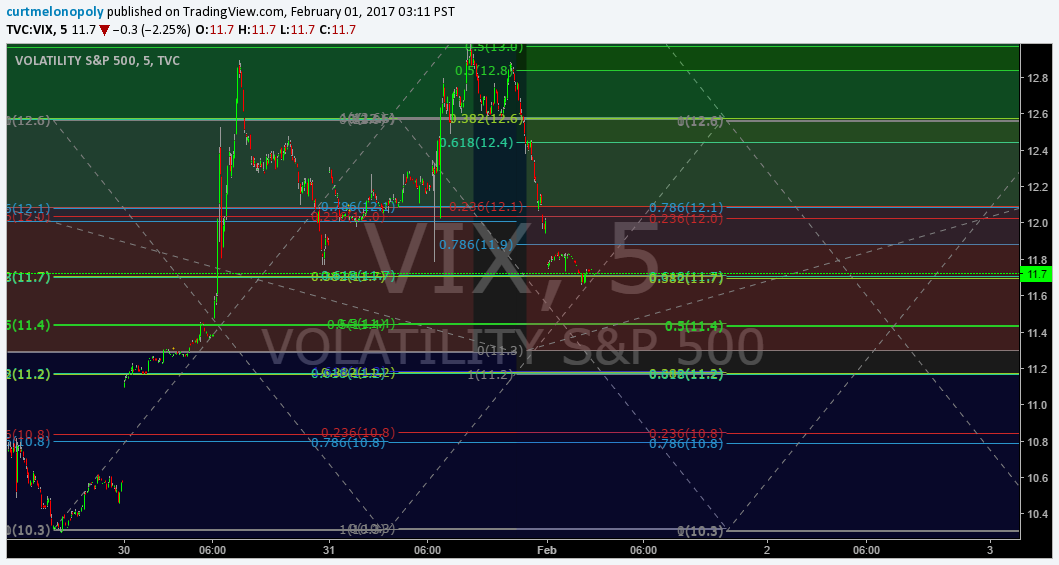
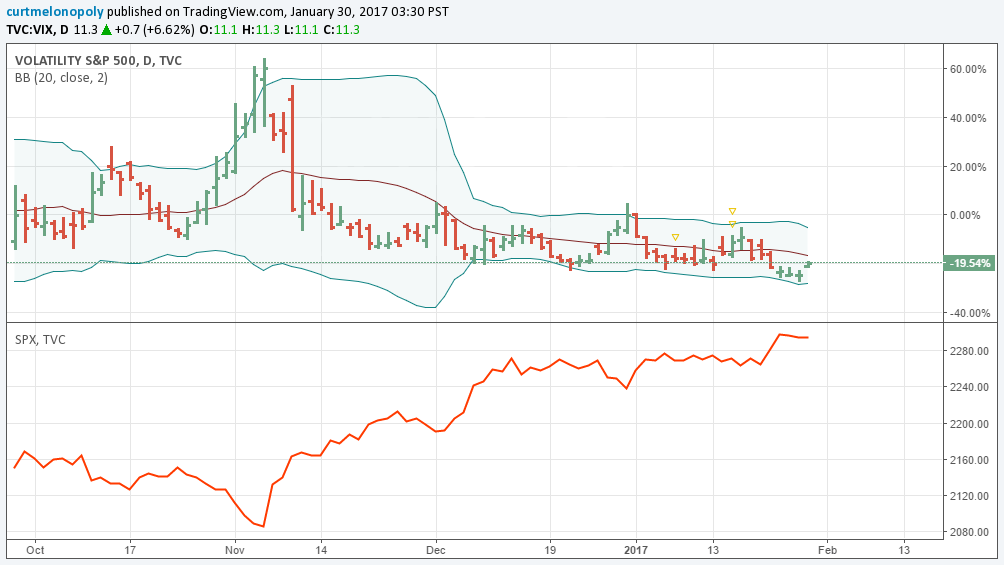
Below is classic charting, models / scenarios, and will be such until Monday. We have the math in play, we just need a few days. This weekend $SPY and $VIX will be our focus. When they are done this weekend then all six are finished.
Midweek Update:
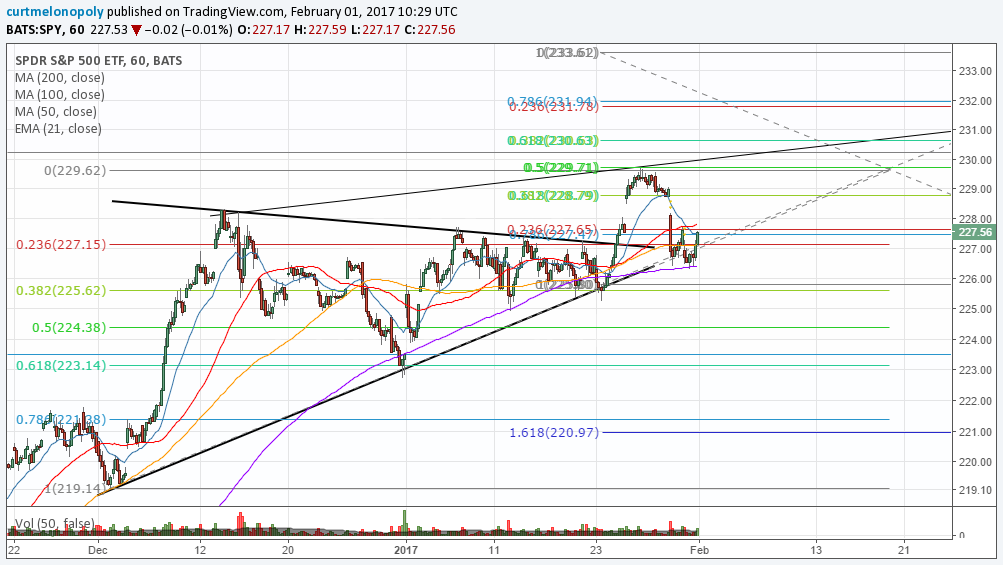
Ascending Trade Scenario 1 – S&P 500 $SPY Trade Charting Feb 2 603 AM $ES_F, $SPXL, $SPXS
$SPY Live Trading Chart: https://www.tradingview.com/chart/SPY/DEMaG0dg-Ascending-Trade-Scenario-1-S-P-500-SPY-Trade-Charting-Feb-2-6/
Price action in this model is intact. Notice price used the 200 day ma as support in recent trade!

Sideways Trade Scenario 1 – S&P 500 $SPY Trade Charting Feb 2 609 AM $ES_F $SPXL, $SPXS
This scenario is also intact.
$SPY Live Trading Chart: https://www.tradingview.com/chart/SPY/x5FEa3EI-Sideways-Trade-Scenario-1-S-P-500-SPY-Trade-Charting-Feb-2/

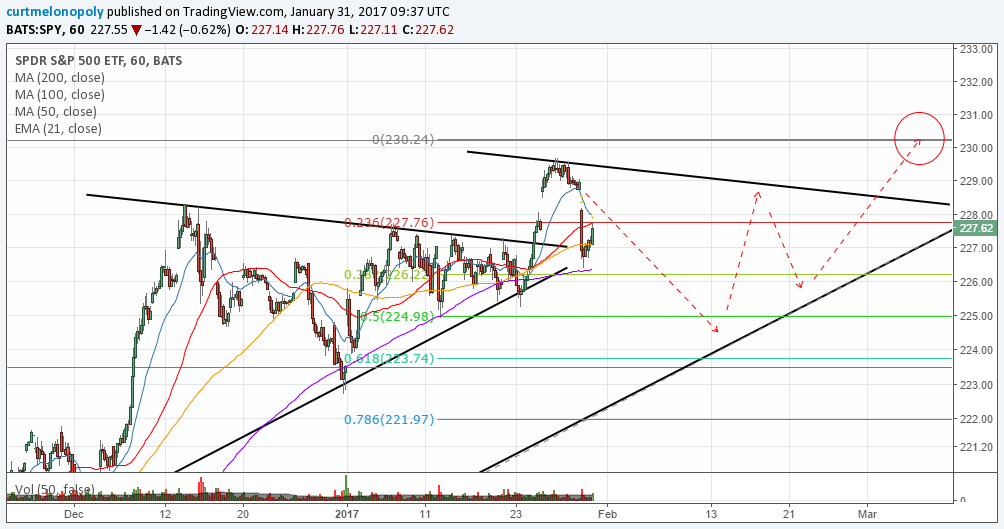
Descending with Fib, Symmetry and Time Price Cycle Trade Scenario 1 – S&P 500 $SPY Trade Charting Feb 2 615 AM $ES_F $SPXL, $SPXS
Live $SPY Trading Chart: https://www.tradingview.com/chart/SPY/dIJqIFq8-Descending-with-Fib-Symmetry-and-Time-Price-Cycle-Trade-Scenari/
This chart model is also intact. The important parts are not the general trade direction red dotted lines or that prospective black downward trendline – the downward channel and its associated trading width is the important indicator to watch on this chart.

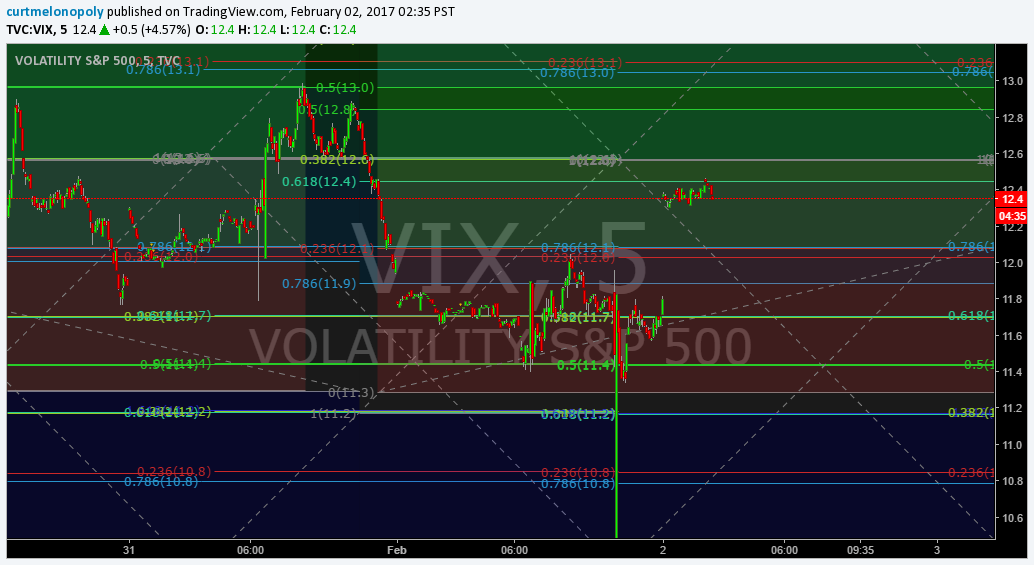
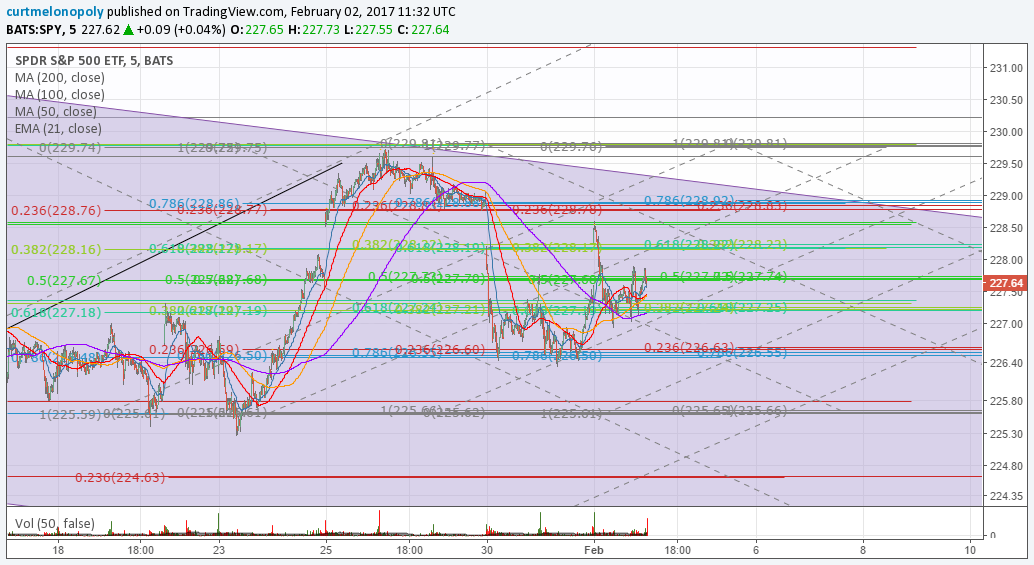
Tight Fibonacci Lines for Intrad Day Trading our Traders will use Feb 2 – 633 AM S&P 500 $SPY Trade Charting $ES_F $SPXL, $SPXS
Live $SPY Chart: https://www.tradingview.com/chart/SPY/NriLZXx5-Tight-Fibonacci-Lines-for-Intrad-Day-Trading-our-Traders-will-us/

Good luck with your trades and look forward to seeing you in the room!
Freedom the $SPY Algo
Article Topics: Freedom, $SPY, Algo, Fibonacci, Stocks, Wallstreet, Trading, Chatroom, Gold, Algorithms, $SPY, $ES_F, $SPXL, $SPXS