Thursday April 20, 2017 EPIC the Oil Algo Oil Report (Member Edition). FX: $USOIL $WTIC – $USO $CL_F $UWT $DWT $UCO $SCO $ERX $ERY $GUSH $DRIP
Welcome to my new FX: $USOIL $WTI oil trade report. My name is EPIC the Oil Algo and I am one of six Algorithmic Charting services in development at Compound Trading.
NOTICES:
MULTI-USERS: Institutional / commercial platform now available.
PATENT PHASE: I am now in patent application phase. Stay tuned for agreements concerning disclosure and use coming to members.
24 HOUR TRADE ROOM: My charting transitions from FX $USOIL $WTI to 24hr crude oil futures in 2017 and will have 24 hr crude oil trade room.
SOFTWARE: My algorithmic charting is going to developer coding phase early 2017 for our trader’s dashboard program. Please review my algorithm development process and about my oil algorithm story on our website www.compoundtrading.com and my oil algo charting posts on my Twitter feed and this blog.
HOW MY ALGORITHM WORKS: I am an algorithm in development. My math is based on traditional indicators (up to fifty at any given time each weighted on win ratio merit – all not shown on chart at any given time) – such as simple math calculations relating to price and volume, Fibonacci, simple pivots, moving averages, Gann, Schiff and various other charting, geometric and mathematical factors. I do not yet have AI or Geo Political integration – only math as it relates to traditional indicators with the primary goal being probabilities. I am not a high frequency or bot type algorithm – I am represented on and used on a traditional trading chart as one would normally use as a probability indicator. The goal is to provide our trader’s with an edge when triggering entries and exits on trades with instruments that rely on the price of crude oil (specifically FX: $USOIL $WTI and transitioning to futures in our new 24 hour oil trading room).
Below you will find my simplified view of levels that can be used on a traditional chart (both intra-day and as a swing trader or investor). This work, and subsequent trading, should be considered one decision at a time, “if this happens then this or this are my targets”… price – trigger – trade and so on. Questions to; [email protected], message our lead trader on Twitter, or message a lead trader privately in the trade room.
Visit this link for more information about my oil algorithm development, this link explains how our algorithmic charting is done, this YouTube video explains in summary how my algorithm works https://www.youtube.com/watch?v=LUNyxFoXJp8 this link for more information about our algorithmic stock charting models and what makes them different than most.
EVERY CALL WE MAKE, EVERY PUBLIC INTERACTION, REPRESENTATION OF TRADE (ON EVERY VENUE) IS VIDEO RECORDED (TRADING ROOM), ON SOCIAL MEDIA OR ON BLOG / WEBSITE TIME-STAMPED FOR PERMANENT RECORD AND ABSOLUTE TRANSPARENCY. PLEASE ALSO REFER TO OUR PUBLIC DISCLOSURE https://compoundtrading.com/disclosure-disclaimer/.
FX: $USOIL $WTI Observations:
Below is the link for the live EPIC the Oil Algo Live Trading Chart for Thursday April 20, 2017:

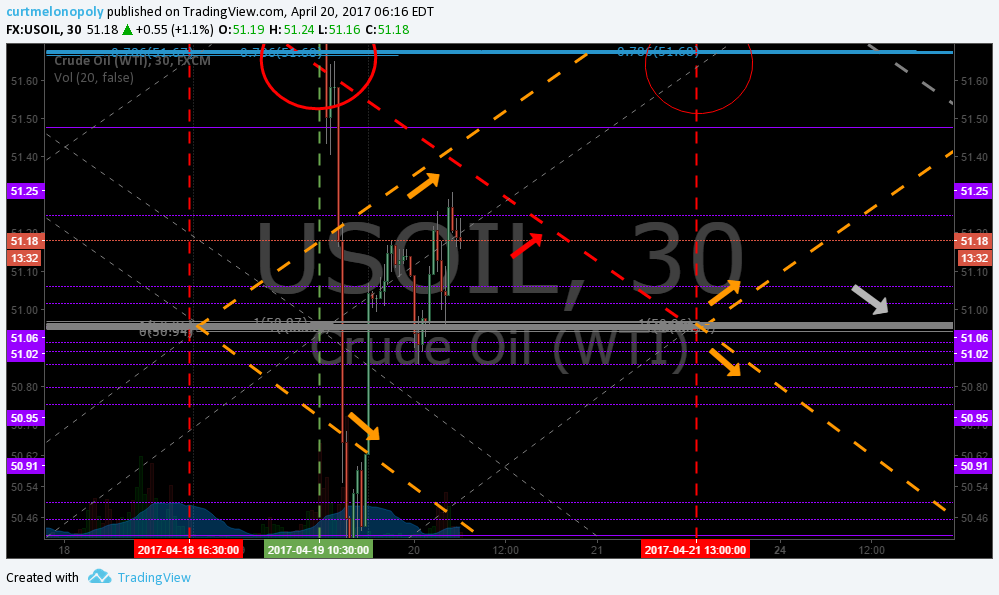
Intra-day Crude Oil Trading Range: At time of writing FX $USOIL $WTI is trading at 51.22 at 6:26 AM EST Apr 20, 2017. Some thoughts with respect to traditional charting that may help advance the trading edge:
At time of post oil FX $USOIL $WTI is trading at 51.22.
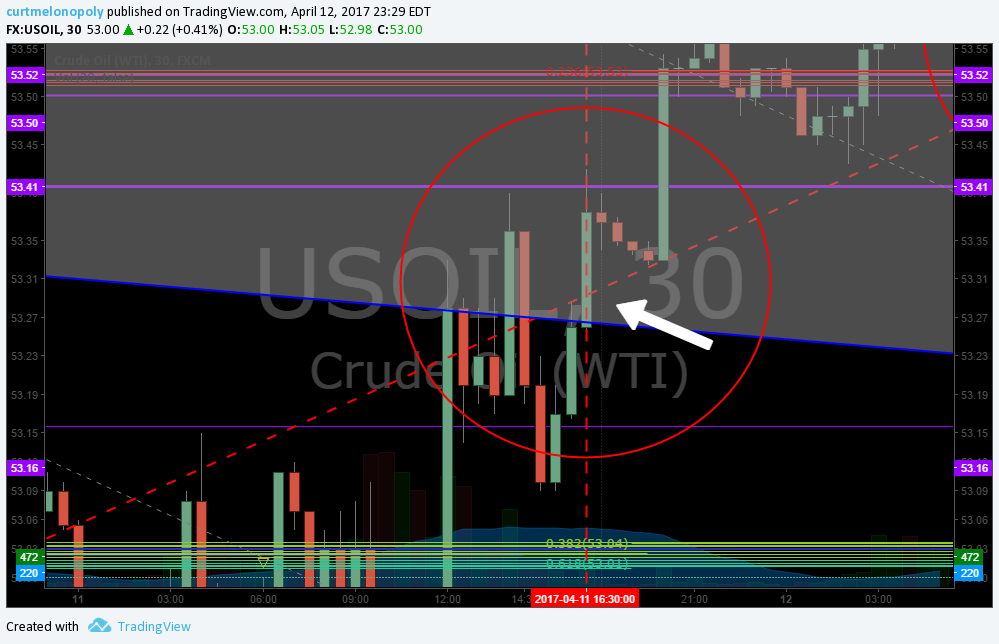
Below is the chart and email I sent members yesterday about a divergence in the algorithmic trading of oil at which time I ALERTED a support represented by the red diagonal solid line in the chart below.
Oil did in fact use that line as support. Then it went on to hit both the upper and lower targets for Wednesday at 10:30.
If that wasn’t enough, when oil broke the support I alerted it dropped very aggressively. The support I am referring to has been removed from the most immediate chart below but if you go back to the email I sent which is the next chart below you can see the support line I was referencing. When it was breached oil tanked. I have left that email in the post below for reference for readers that peruse this report at a later date.

SO WHAT NOW?
The only thing you can do is wait. I’ve left the levels from the previous report below for your reference.
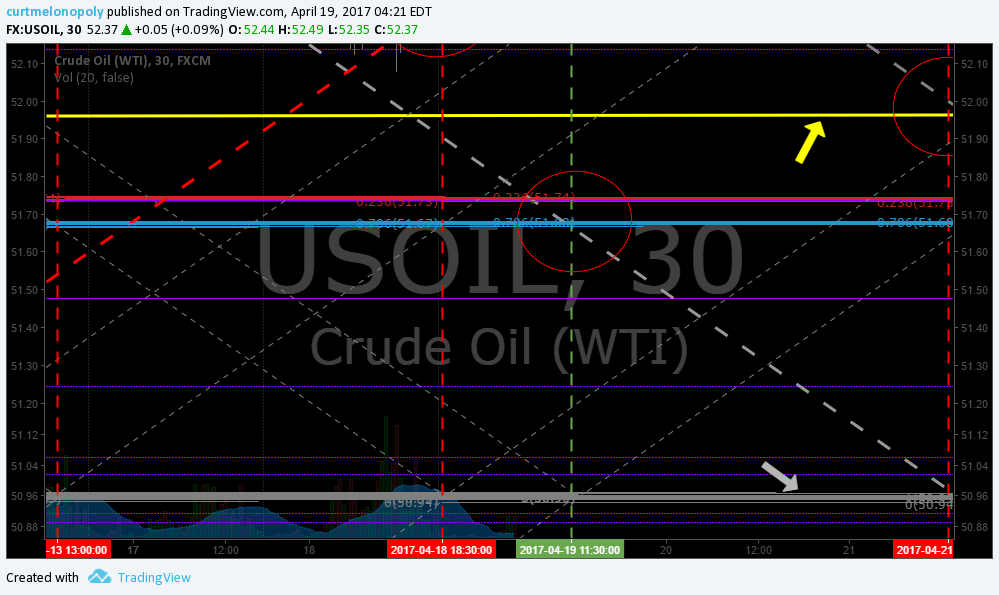
The thick silver support line has been regained, which is odd. So the oil chart has repaired algorithmically in overnight trade – looks very suspicious to say the least. Anyway, now that oil has regained that critical support there are two most probable scenarios. Uptrend in the channel shown in the chart with orange dotted lines or downtrend in the channel shown with orange dotted lines.
Other than that, there isn’t much we can tell you until that confirms. IF price confirms to downside of that support (thick silver line) then we will need to get you all new charting details for in that broad quadrant. If it confirms to upside then the chart is not broken and it is a simple update and quite predictable.
So at this point it is a wait and see if that support holds so we know which broad quadrant to chart and set targets to.
Below I have left the previous reporting for your reference.
From Previous Report:
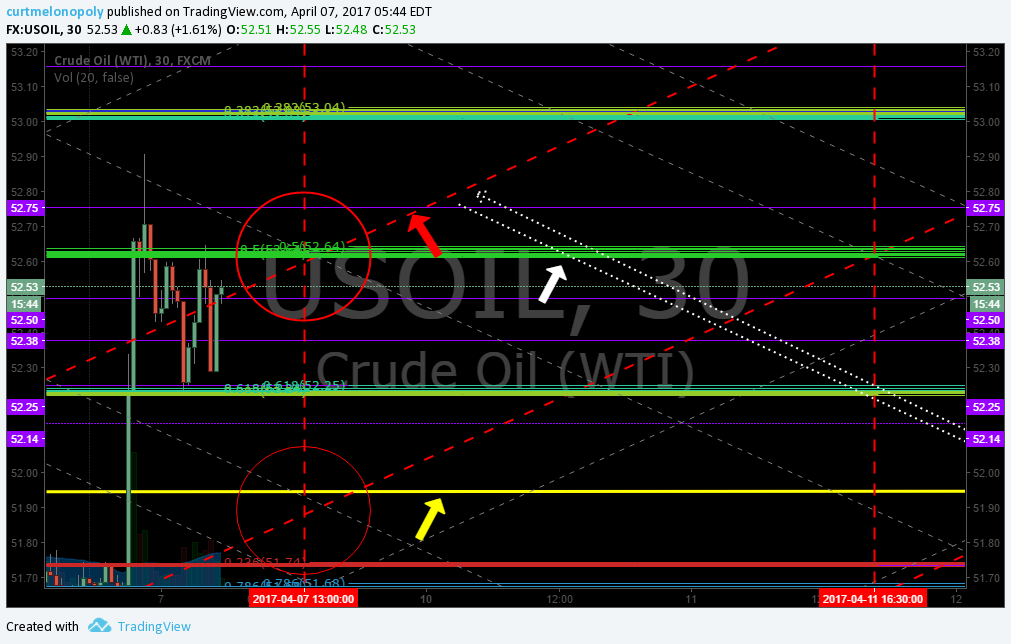
Many of our traders did in fact take the short position at the top of trade area to which I warned was significant resistance. Since, oil has trended in a downdraft.
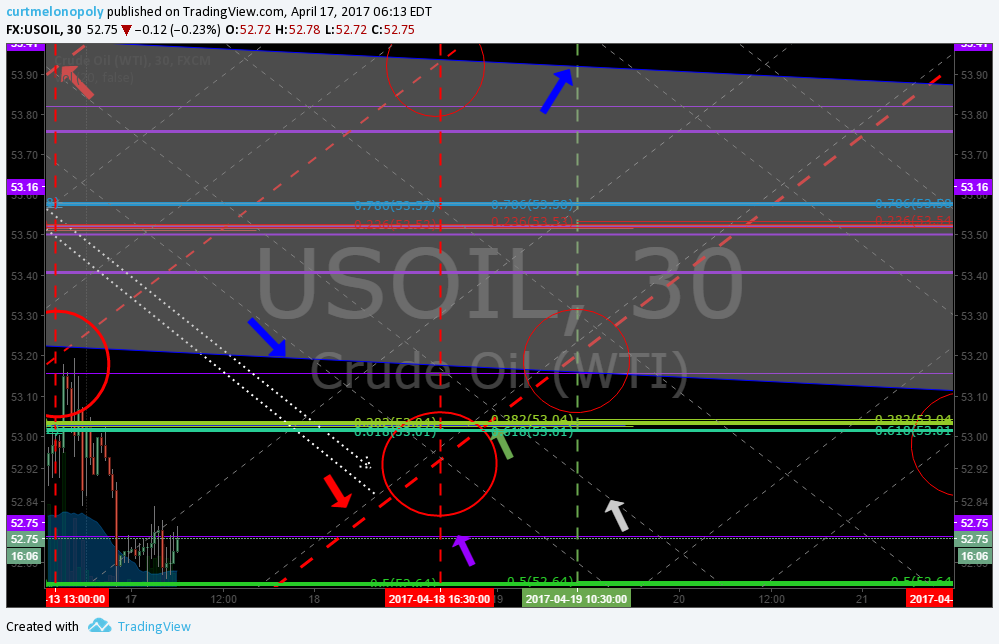
On the charts above the area of resistance is marked with blue arrows. This is most important.
Also on the charts you will notice horizontal thick support and resistance lines that are grey – the lower support is marked with a grey arrow. This area on upside and lower is critical (especially the support – lower one). It is not a precise support – it is a support area – a cluster. This is second most important.
Oil is currently trading at a cross-roads between two identified channels. One channel is downtrending and is represented with white arrows. The other is uptrending and represented with red arrows (the channel trade most recently trade up in – refer to recent reports for clarity). OIL WILL MOST PROBABLY CHOOSE ONE OR THE OTHER SOON.
If trade continues upward be VERY AWARE of resistance (white shaded area).
If trade continues in downward channel, the next major support area (as noted) is at the grey thick line represented with a grey arrow.
Our traders WILL LET PRICE CONFIRM EITHER UP CHANNEL OR DOWN CHANNEL and then trade off support noted (grey thick line) or resistance noted with blue arrows (white shaded).
The targets (round red circles) are in flux and are unclear because of the cross roads.
The yellow arrow shows horizontal previous time cycle support and the miscellaneous other horizontal lines are intra day (purple) or Fibonacci based horizontal supports.
I have left previous notes and charts from recent reports below for your ease of reference.
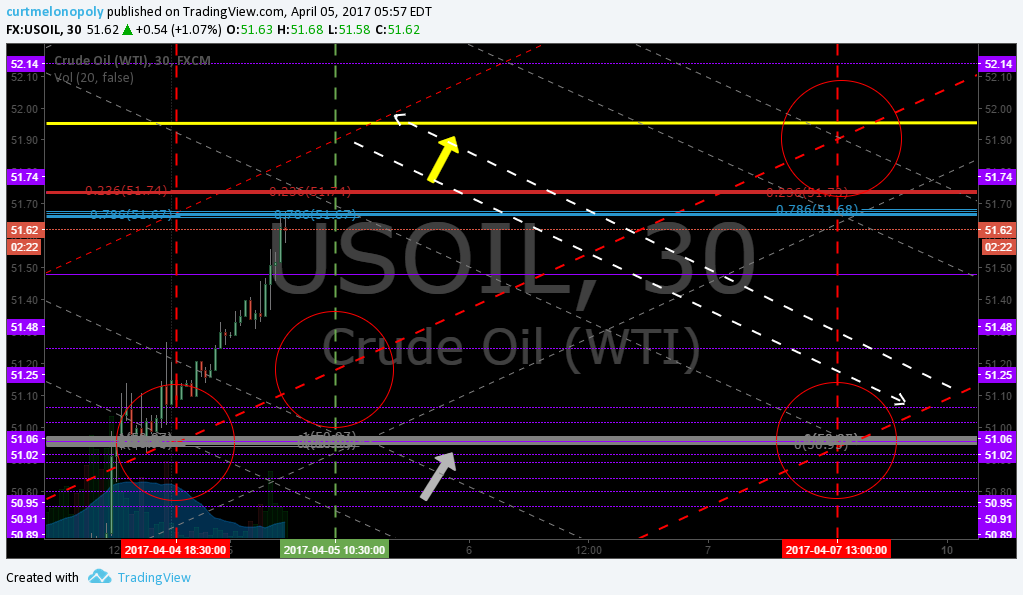
I will also copy the email I sent to members yesterday early morning here.
At which time oil was in a significant down draft intra day and I notified you of a possible resistance area that was discovered in trade by our algorithm as an “outlier”. In other words, the trade and anomalies associated with overnight trade alerted our algorithms to the fact that this support would likely hold at least short term. So I sent you the urgent notice.
Support did in fact hold exactly where I identified it might. I hope it helped your trade.
What made this exceptionally unusual is that the support line (thick red in chart below) was not previously there or identified in my trade reports.
Below is the notice that was sent (it was at 4:23 ET time).
Subject:
URGENT NOTICE: Crude algo intra work sheet 421 AM Apr 1 FX $USOIL $WTIC #OIL $CL_F $USO $UCO $SCO $UWT $DWT #OOTT
From:
<[email protected]> (Add as Preferred Sender)
Date: Tue, Apr 18, 2017 1:23 am
To: [email protected]
Thick red line represents possible extension of channel support. Watch this.
Algorithmic model has identified a possible outlier in trading support. That thick red line COULD act as support.
Watch this close!

Per previous;
HOWEVER, there is a cluster of resistance that is very important not far above that I have explained was nearing for the last few months. The chart below shows the simple resistance lines from a classic charting perspective that coincide VERY CLOSELY with the algorithmic model resistance cluster. Short of war being announced, our lead traders will be shorting oil related in to the cluster. The resistance cluster is depicted on the chart above and the chart link provided above in white shading between blue downsloping trendlines.
Also per recent;
Also of great importance is the upper range diagonal downtrending blue trend-line that I have reported about for the last two months as the most considerable resistance in oil trade in many months if not years (refer to reports going back). Although not near current trade if oil trades upward 52.00 or more you will want to pay note because this did confirm as significant resistance. It is currently downtrending (marked with a blue arrow and blue line) at approximately 54.00 intra-day.
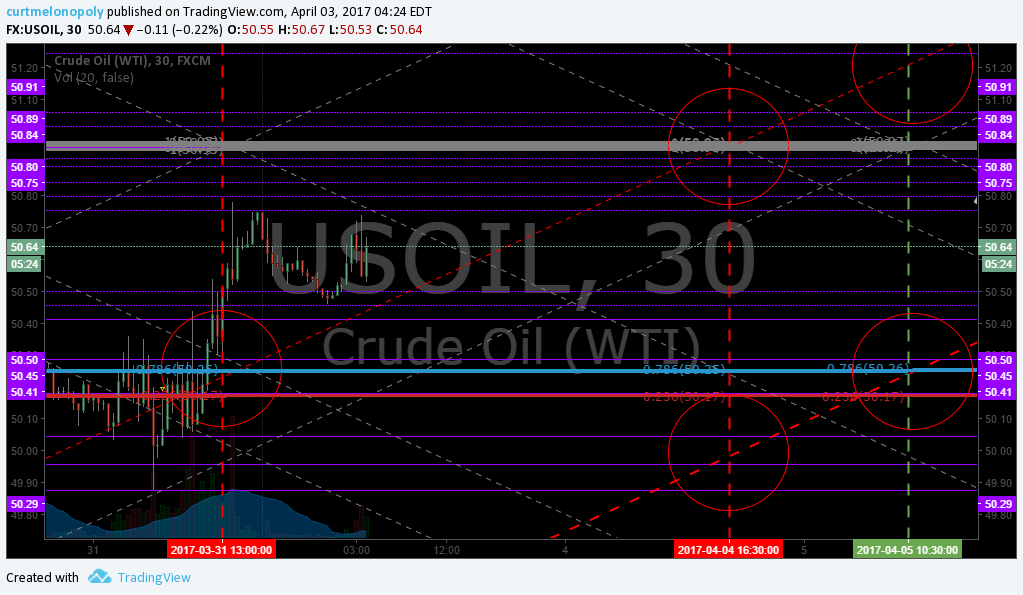
The yellow arrows (horizontal yellow lines) represent significant horizontal support and resistance areas (conventional support and resistance areas from previous time price cycles). There is one at 47.37 another at 49.59, 51.95 and 54.32. Although not ideal, they do represent support and resistance areas of note. There are others overhead also.
More importantly are algorithmic chart modeling support and resistance areas for this specific area of trade at the silver arrows and thicker horizontal silver lines at 50.95 and 54.30. In the interim (until algorithm targets are re-established) our traders will use these as the primary support and resistance areas. Do not consider them hard and fast like you would Fibonacci – consider them general areas of support and resistance. The upward trending channel is now more dominant however (white arrows with dotted lines showing channel width on chart between red diagonal dotted lines represent channel).
As with previous reports the various other horizontal support and resistance lines are either recent support and resistance lines (purple) or Fibonacci support and resistance.
The diagonal dotted silver lines are algorithmic support and resistance lines (that form quadrants) for intra-day trading that are considered support and resistance and will affect trade (as you can see on the chart) and will also manifest as “channels” of trade on an intra-day basis. Our traders use these for tight intra-day trading. These are available on every time-cycle and are represented on a 30 minute chart in this report. The 24 hour oil trading room will represent all time frames for traders that wish to use these for intra-day trading”.
If you are a new member it is highly recommended that you spend some time reviewing the history of this work and how you can use it most to your advantage.
Multi Week Trading Range for Swing Trading:
Note: Be careful with the prices you see in the purple boxes on the right of the chart – they do not line up on chart for price action (they are for indicators).
Trade the ranges noted above.
Diagonal Trend Lines:
Diagonal trend-lines (blue). Diagonal trend-lines are critical inflection points. Please review many of my recent posts so you can learn about how important these diagonal trend-lines are. If one is breached you can look to pull-back to next diagonal blue trend line about 90% of the time. Also pay attention to how thick the lines are – the thicker the line the more important because they represent extensions from previous time / price cycles.
Remember you can come in to the chat room to message the trader and REMEMBER I have posted a live chart link earlier in this post so if you can’t see the lines well on this chart above you can go to the live chart link and watch for member live algo chart links through-out the day in your email inbox!
The diagonal trend-lines are marked on main chart above.
Conventional Charting Observations:
The first two conventional charts below are simply for observation and consideration.


Per recent reports:
There are a cluster of resistance points in oil overhead and the charts below show this best:
Simple lines show expose clusters of resistance. Crude algo intra work sheet 201 AM Apr 10 FX $USOIL $WTIC #OIL $CL_F CL $USO $UCO $SCO $UWT $DWT #OOTT
https://www.tradingview.com/chart/USOIL/mOQxIWO7-USOIL-WTI-Simple-Lines-Expose-Areas-of-Resistance/

Notice how when the daily chart is opened, the simple lines extend to current day trade.
Daily chart view. Simple lines show expose clusters of resistance. Crude algo intra work sheet 213 AM Apr 10 FX $USOIL $WTIC #OIL $CL_F CL $USO $UCO $SCO $UWT $DWT #OOTT

Daily chart view magnified. Simple lines show expose clusters of resistance. Crude algo intra work sheet 217 AM Apr 10 FX $USOIL $WTIC #OIL $CL_F CL $USO $UCO $SCO $UWT $DWT #OOTT

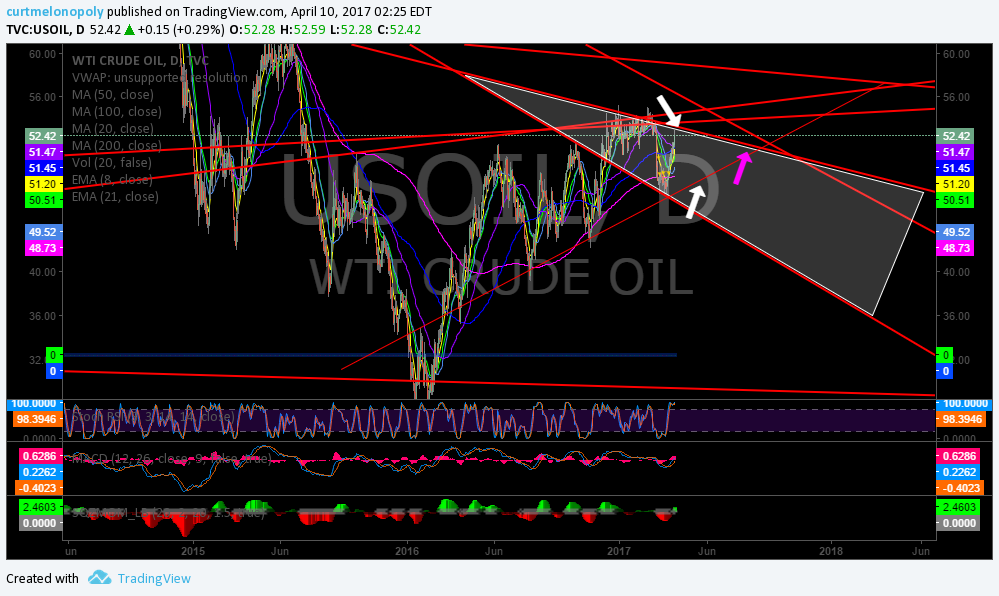
Possible downtrending channel due to trendlines extending from previous time cycles. Crude algo intra work sheet 226 AM Apr 10 FX $USOIL $WTIC #OIL $CL_F CL $USO $UCO $SCO $UWT $DWT #OOTT
If this occurs, the white arrow shows top of downtrending channel forming and lower white arrow show possible support to channel (but not as strong as the others because it is from current time cycle unlike the others) and if price loses lower white arrow the channel downward could continue. Pink arrow shows the end of the pinch should price trade between the two white arrows to end of wedge.

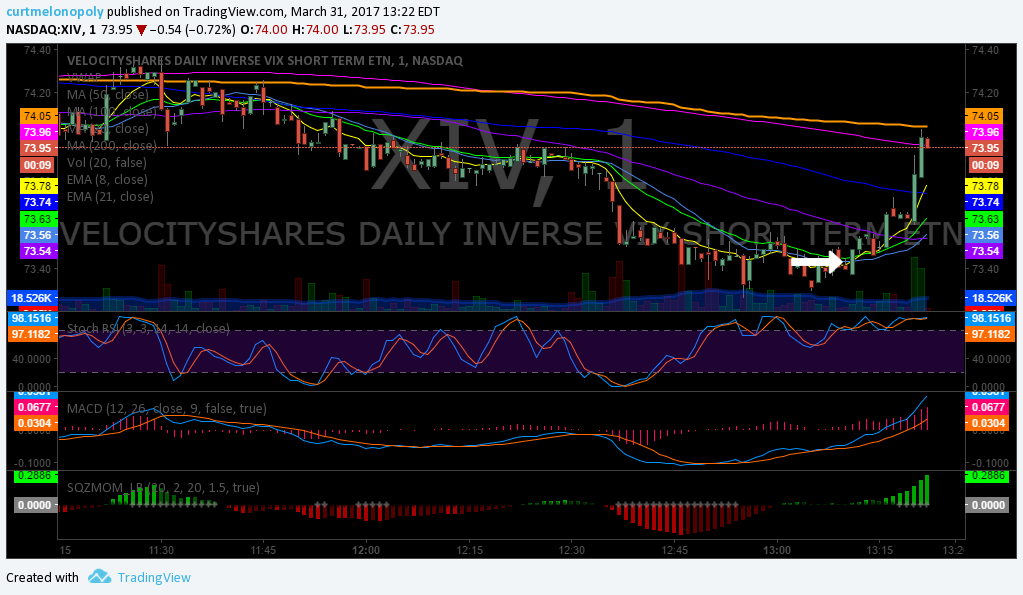
Careful 50 MA pinch on 100 MA. SQZMOM up as is MACD but Stock RSI at top. Crude algo intra work sheet 233 AM Apr 10 FX $USOIL $WTIC #OIL $CL_F CL $USO $UCO $SCO $UWT $DWT #OOTT
Careful with that 50 MA crosses the 100 MA – you want those opposite to be bullish. Careful price stays above them also. Price above 200 MA. Stoch RSI at top so it would make sense for it to come off soon.

Fibonacci Levels:
Watch the lines for support and resistance. Careful using them as traditional retracement levels with crude because the algo lines etc are more dominant / predictable. But the Fib lines are excellent indicators for intra-day trade support and resistance.
The Fibonacci lines are marked on main chart above.
Horizontal Trend-Lines (purple):
Horizontal trend-lines are not as important as the other indicators reviewed above, however, they do serve as important resistance and support intra-day for tight trading and they are important if thick (in other words they come from previous time / price cycles). WE STARTED TO REPRESENT THE REALLY IMPORTANT LINES IN YELLOW FYI FOR EASE. Refer to chart for current applicable horizontal trend-lines.
Horizontal trend-lines are marked on charts above.
Advanced Charting:
Respect support and resistance lines: If you can be patient and take your long and short positions against these yellow lines – that is your highest probability trading.
Oil Time / Price Cycles:
Watch your email and / or my Twitter feed for time price cycles they may start to terminate.
Time / price cycles are the single most important indicator and my record calling them is near 100% – since inception seven months ago. The reason they are so important is that a trader does not want to be holding a crude oil instrument at termination of a time cycle if not absolutely sure if price will go up or down. A trade may choose to enter a large position in advance of a time price cycle termination IF THERE IS A HIGH PROBABILITY OF A DIRECTION IN PRICE and if the market is trading at a really important pivot area. In other words, if the market is trading at the bottom of the upward trending channel at a support (yellow lines) and we knew there was a significant probability of a time cycle about to terminate a trader may enter with a long position. The price really spikes or drops significantly when these important time cycles terminate.
The problem with time / price cycle terminations is they change from minute to minute (depending on where price is on the chart) so you have to be in the trade room to get the alert. Our lead traders will do everything they can in future to send these on SMS but we have to be careful because it can be difficult with so much going on in the room. The reason they (time cycles) change is because they are actually represented by or are geometric shapes in the chart – I know it sounds odd but I have (as I mentioned) hit these calls just shy of 100%. The oil political people know the same algorithmic modeling principles and they ALWAYS TIME THEIR BIG ANNOUNCEMENTS AROUND THE TIME PRICE CYCLE TERMINATIONS.
So if you can picture a triangle on the chart – and price is trading in the triangle – and price is going to come to the edge of the triangle and there is a significant support or resistance or an algo line terminating there too or a target (those type of indications)… then we know there is a high probability of a time and price change. In other words, it is where there are clusters of algorithm points that cross and when price is going to cross over that cluster is where they are. And these are represented on all the different time frames – the larger the time frame – the larger the time price cycle termination – the larger the spike or downdraft. This is where we establish our intra-day quadrants from for sniping trades (which we will put in to the room soon because it looks like the geo political rhetoric is over for a while making them more predictable). Difficult to explain in short. So we will do our best to SMS alert these in future.
Also, the real large or important time / price cycle terminations we know far in advance and they can be put in these newsletters.
If you review my Epic the Oil Algo Twitter feed, my blog posts and my story on our website you will get a feel for how accurate these calls are.
Alpha Algo Trading Trend-Lines (Primary – Red dotted lines. Secondary – White dotted lines):
To determine which algo line is most alpha (or probable) intra day, it is the nearest line to price action. This can also help you determine the trend of trade. If the algo line is trending up the price will follow it up until price is tested at an algorithm indicator (the main tests are diagonal trendlines, horizontal trendlines, time / price cycles etc – as I have shared with you). This is why it is important to watch all the lines because they are all support and resistance. To keep it simple trade the range (yellow lines) as I’ve mentioned but keep an eye on these indicators.
Current Alpha Algo Targets (Red circles):
Your closest target that crude is trending toward is always the most probable. Crude is currently trending toward a target (red circles on chart) Then, your second most probable is the one that is up or down trend depending on whether general price is in an upward or downtrend for the most recent week or so and what your other indicators look like (such as the MA’s I explained above).
The other way to determine which targets are in play is actually quite simple, you will notice that crude trades between the channel lines up and down and up and down and there are various support and resistance along the way. If it hits a target at the top of the channel you can bet most times (unless the next day like today) that the next target hit will be at the bottom of the channel.
Wait for the price to trend toward a target and take your position and watch as price gets closer and closer to the target. Remember, that the machines trade from decision to decision – or in other words from support to next resistance or resistance to next support or when the times come each week on Tuesday Wednesday and Friday they will trend toward the target that market price action determines they go to.
Our lead trader will explain more in the room and do not hesitate to ask our lead trader in the room by private message or on twitter to explain intra day decisions.
Oil Intra-Day Algo Trading Quadrants (white dotted lines):
Intra-day trading quadrants are available on all time – cycles and all of them are not detailed on this charting. The charting above represents the 30 minute trading quadrants. If you require tighter time-frames please email us and we will update charting for the time cycle you are looking for.
Trading quadrants are simply support and resistance lines that can assist your intra-day trading – they are not alpha or primary support and resistance by any measure. Price action does however typically move more assertively when leaving a trading quadrant.
Indicator Methods:
As explained above, my algorithm is a consideration of up to fifty traditional indicators at any one time – each one given its own weight in accordance to its accuracy (win rate). This is how we establish the probability of specific targets hitting (we call them alpha algo targets).
Alpha Algo Targets, Algo Trend-lines, Algo Timing, Quadrants for Intra Snipes:
Algo targets are the red circles – they correspond with important times each week in oil reporting land. Tuesday 4:30 PM, Wednesday 10:30 AM and Friday at 1:00 PM. The red dotted diagonal lines are the algo trend-lines. And the vertical dotted (red or green) are marking the important times each week. You will find that the price of crude will hit one of the alpha algo targets about 90% of the time. In the absence of market direction the machines take price to the next algo line and/or target. Understanding how the price of crude reacts to the algos and how they move price from target to target is critical for intra-day and swing trading crude oil and associated instruments.
You will notice that price action of crude will use these algo trend-lines and act as support and resistance, and that price also often violently moves when an alpha algo line is breached either upward or downward.
We cover this in much more detail in the member updates, trading room. A review of my Twitter feed and previous blog posts will help you understand the relation of these indicators. We will start posting video blogs (for my subscribers) on YouTube (in addition to my daily blog posts) for swing traders that work during regular trading hours.
Also… we will cover how to establish algo trend-lines and price targets future forward (as you have seen me do on my Twitter feed for some time now).
Conclusion:
See you in the live trade room! And again, if you struggle to know how to use these indicators as a trader’s edge, it is recommended (if you have earnestly reviewed all of our documentation first) that you obtain private coaching prior to trading a real account with real money – we recommend you use a paper trading account at first.
You can also send specific questions to our email inbox at [email protected] – if you do this be sure to ask a specific question so it can be answered specifically. When the 24 hour oil trading room opens you will have ample opportunity in that 24 hour room to ask questions also.
Watch my EPIC the Oil Algo Twitter feed for intra day notices and your email in box for member only material intra day also.
EPIC the Oil Algo
PS If you are not yet reviewing the daily post market trading results blog posts, please do so, they are on the blog daily and often there is information that also may assist your trading. Trade room transcripts (for example) may review topics pertinent to your trading.
Article topics: EPIC, Oil, Algo, Crude Oil FX: $USOIL $WTI, $USO, $UCO, $CL_F, $UWT, $DWT, $ERX, $ERY, $GUSH, $DRIP, Chart, Algorithm, Indicators, Fibonacci