My Stock Trading Plan for Monday Jan 9, 2017 in Trading Chat room. $MSTX $MACK $ARWR $BIOC $EXAS Gold $GLD, Gold Miners $GDX, Silver $SLV, Oil $USOIL $WTI, Natural Gas, US Dollar Index $USD/JPY $DXY, S&P 500 $SPY, Volatility $VIX… more.
Welcome to the morning Wall Street trading day session!
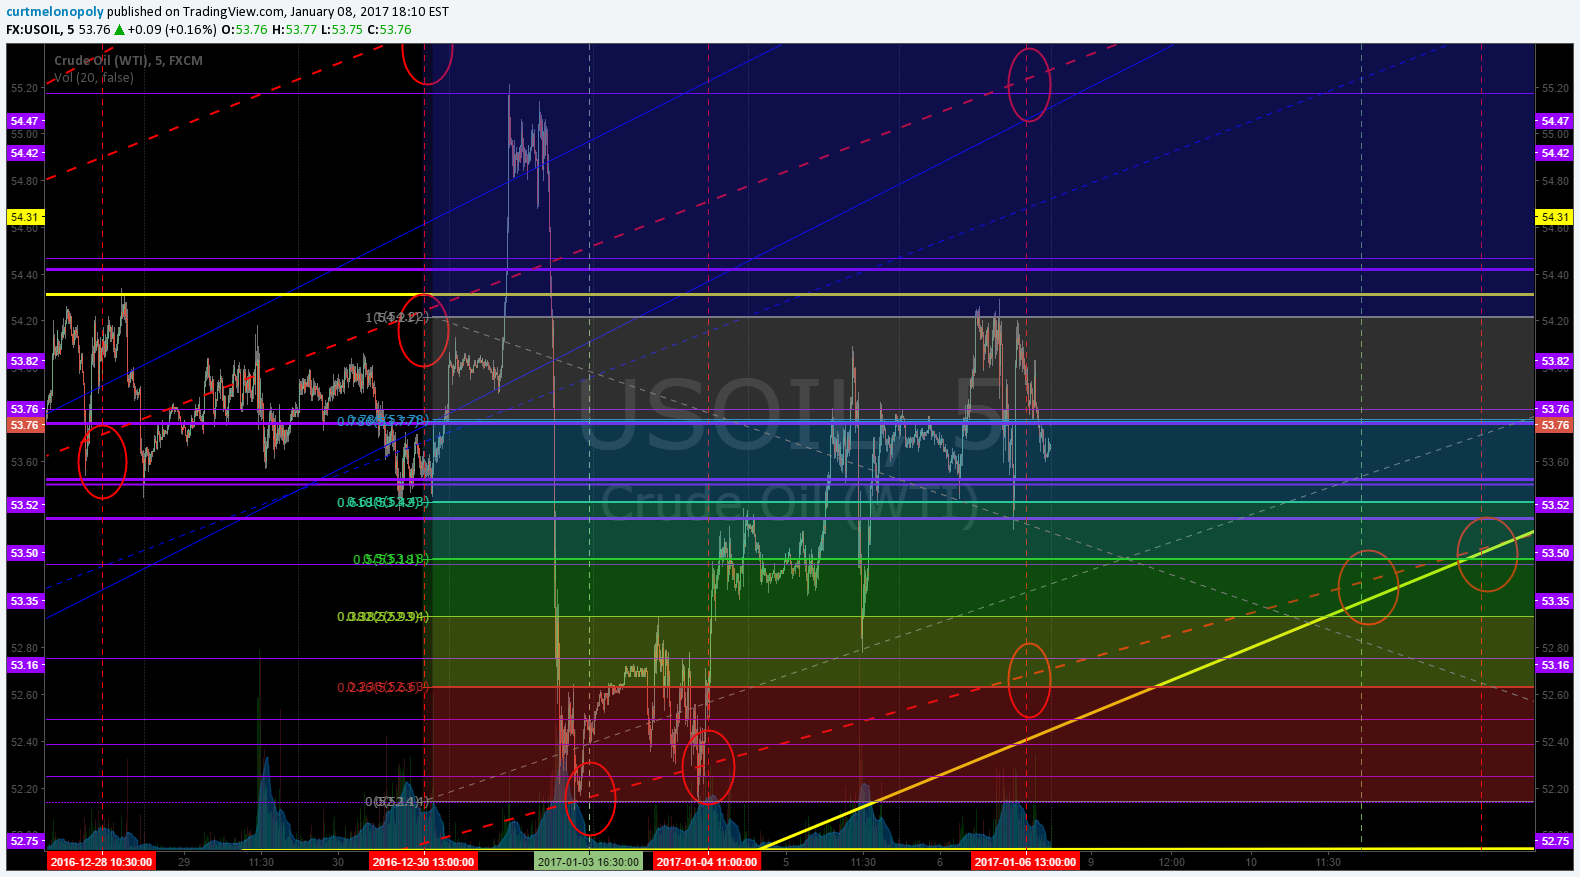
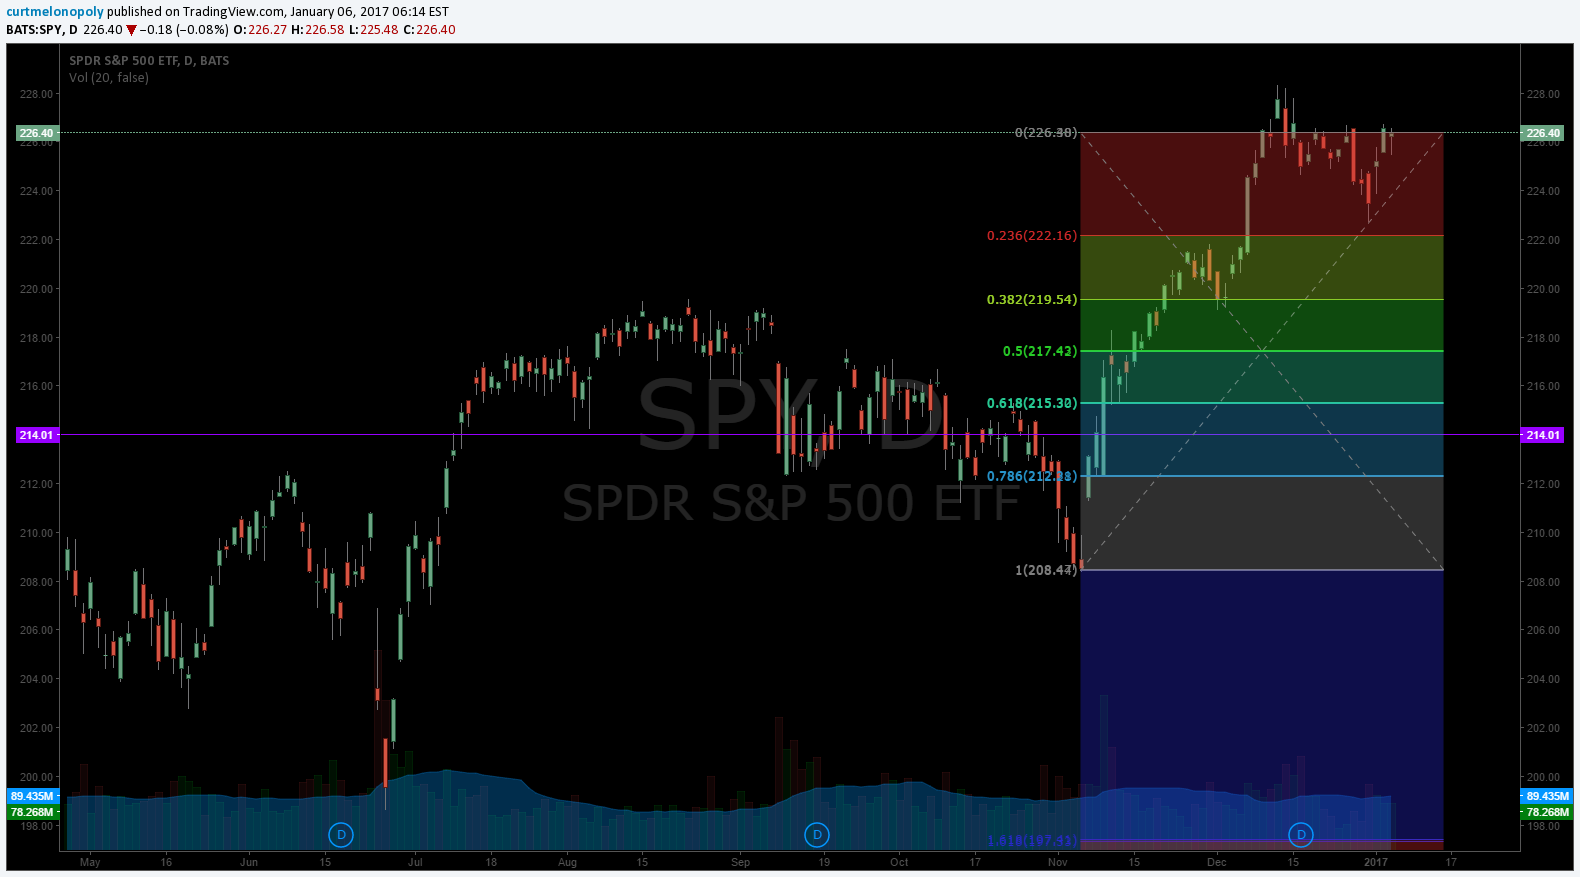
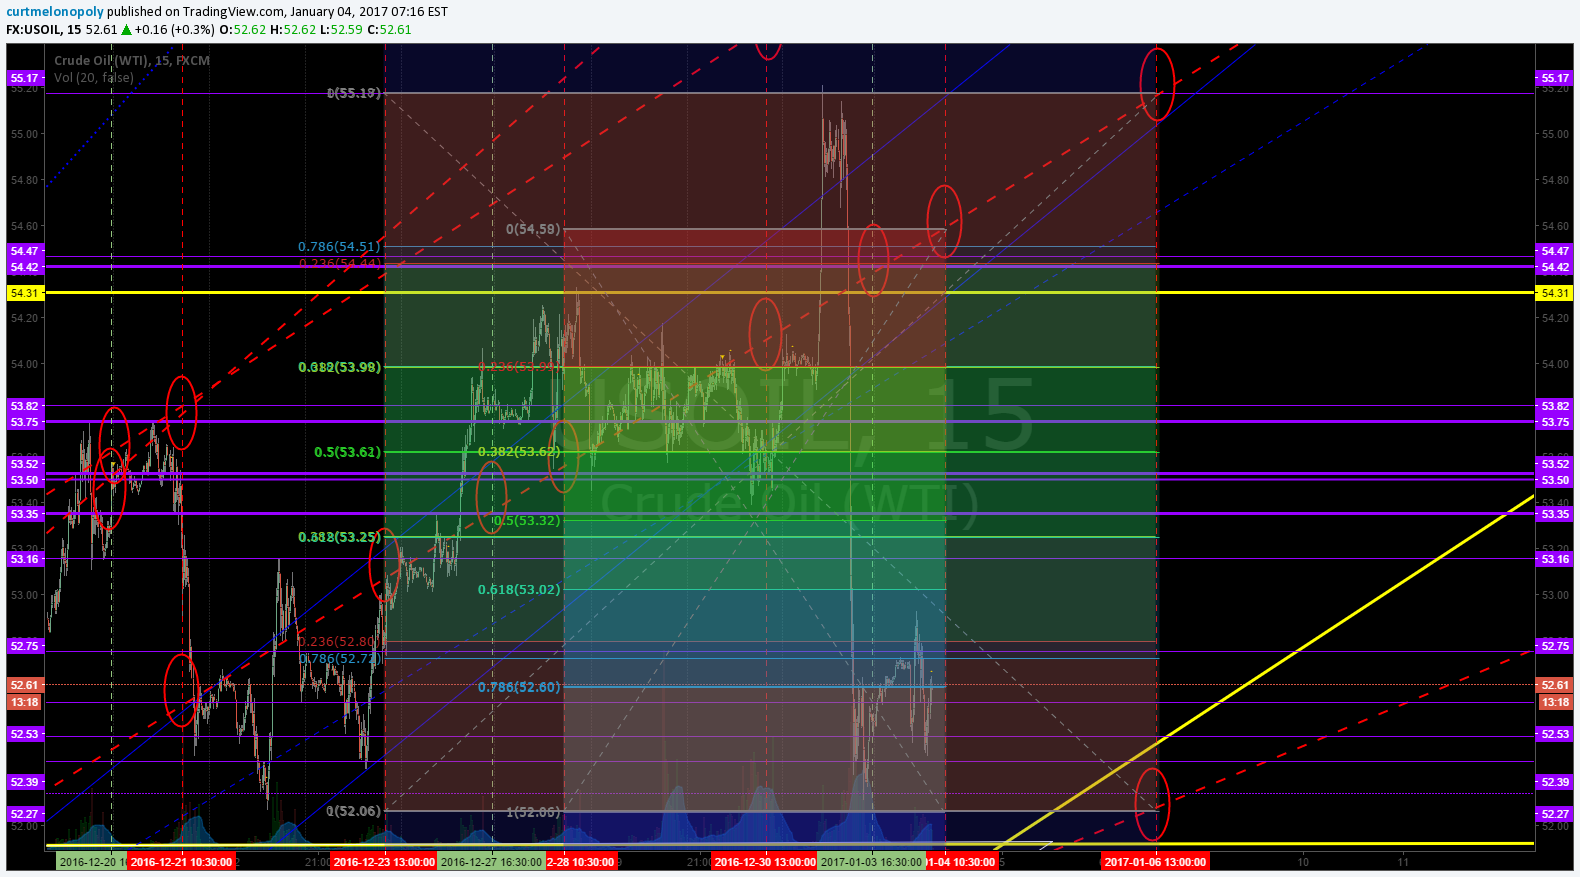
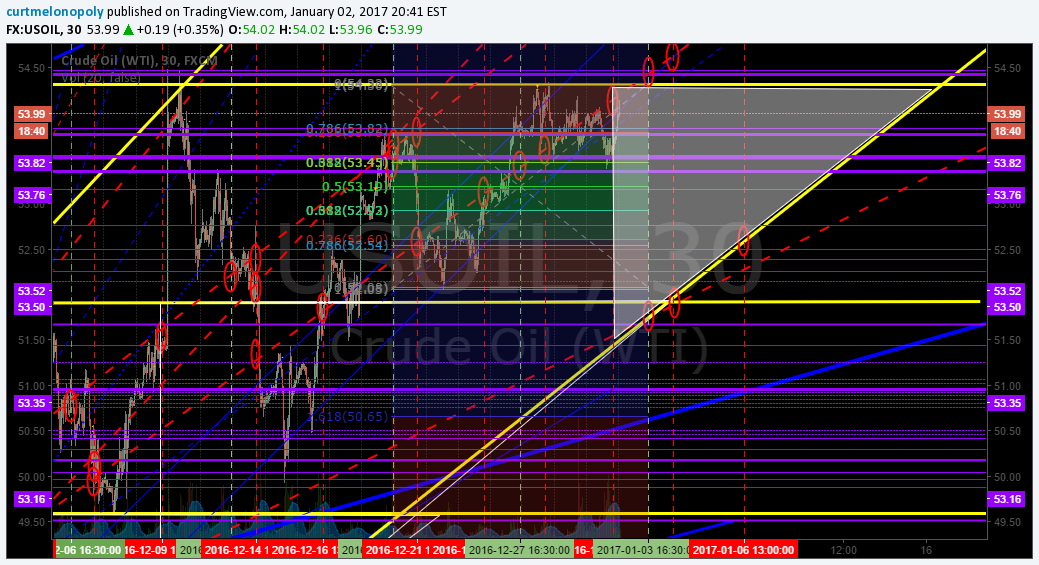
A super quick premarket newsletter below! You all have charting for regular trades I follow (sent overnight on email and/or on Compound Trading Twitter feed) so I won’t include below for Oil, Gold, Silver, VIX, SPY, etc.
Notices:
Big week coming. Official Launch @CompoundTrading Monday. All algorithms published for launch. Two week double account challenge live.
Big week coming🔥 Official Launch @CompoundTrading Monday🎉 All algorithms published for launch🚀 2 week double account challenge live🎥 #stocks pic.twitter.com/MGPCTAdDsx
— Melonopoly (@curtmelonopoly) January 7, 2017
Monday is free room access first Monday each month. Join us for official launch?. https://compoundtrading.com #stockmarket #stocks #wallstreet
https://twitter.com/CompoundTrading/status/817847904337432576
Goal: Double accounts between now and when Trump sworn in. Range opening in our focus areas for scalps that will add quick.
Goal: Double accounts between now and when Trump sworn in. Range opening in our focus areas for scalps that will add quick. Start tomorrow.
— Melonopoly (@curtmelonopoly) January 5, 2017
Per previous;
Feature Post: “Why our Stock Algorithms are Different than Most“. If you are using our algorithmic model charting it is a must read.
Review: If you are not reviewing the post market trading results along with this please do so. We assume our trading room subscribers review it everyday. There is often information applicable to and not included in this premarket report. You will find the post market trading result reports on our blog daily.
New Service Options: We now also offer a stand-alone trading room option now vs. bundle incl. trading room, premarket newsletter, alerts). Plans from $1.22 per day w/ promo code.
New Service Options: EPIC the Oil Algo now has an Oil Report only option vs. bundle w/ 24 hr trading room. Plans from $4.10 per day w/promo code.
New Service Options: Entry-Level trader one-on-one trade coaching and entry-level trade academy options now available in addition to intermediate / advanced trading academy and coaching.
Current Holds:
Per previous;
$CBMX, $JUNO, $DUST (looking for a way out on $DUST – was expecting one final significant spike in USDJPY before drop). $CBMX and $JUNO are holds till spring if necessary (you would have to do your own DD on the companies and make your own determination).
General Market Outlook:
Lots of width in what we are trading between now and Jan 20, 2017 (and likely at least short-term thereafter) IMO. Should be really active. My focus will be toward morning momentum plays and scalping range in $NUGT $DUST $JNUG $JDST $USLV $DSLV $UWT $DWT $UGAZ $DGAZ $TVIX $UVXY $XIV.
Per previous;
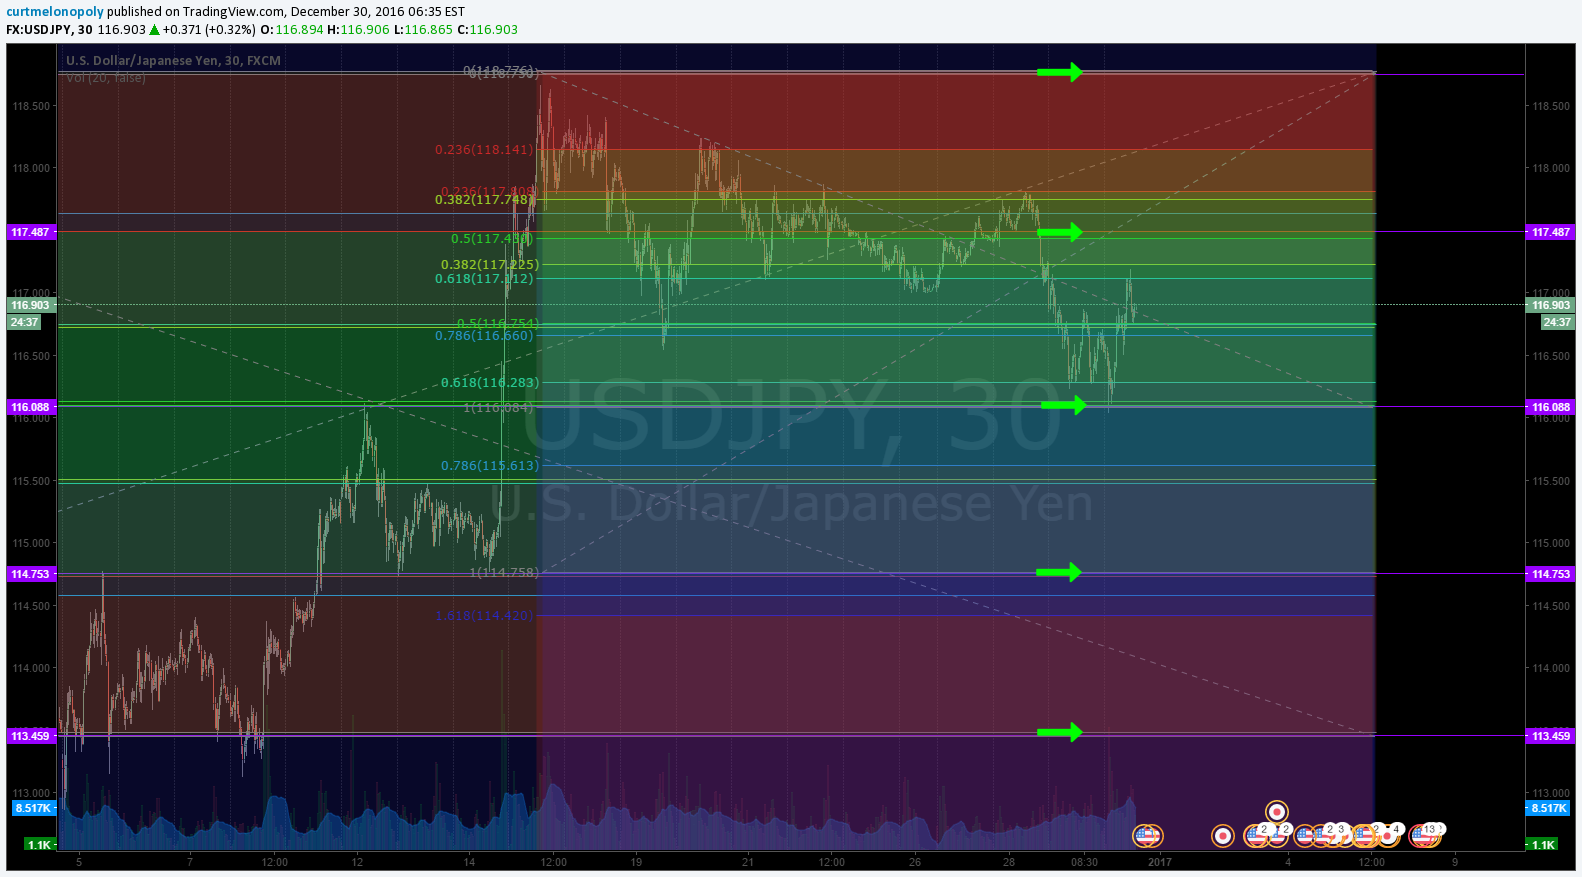
Early in 2017 I will be watching very closely bonds, $USDJPY, markets in general for direction (of course there are hundreds of variables).
Generally speaking I am looking for some volatility between now and late January. My instinct tells me that even if there is some downdraft in the markets that the Trump train will sweep them up in positive momentum at some point.
Metals, energy and financials are three areas I am looking to for 2017 for trading margin – with bio in fourth place on my list. And per previous we’re expecting some action in bonds to the upside a high probability.
As a trader, it is the margin / volatility I am focused toward and getting on the right side of a market / sector turn and scaling in to that.
Per previous;
All algos (Oil, SPY, Gold, Silver, Dollar, VIX) have hit their targets now (long term since July and short term) so we are running calculation targets for all six algos for all time charting time-frames and expect these reports to start rolling out first week of January 2017.
Morning Momo / News Bits:
Momo Stocks: $MSTX $MACK $ARWR $BIOC $EXAS
$DNAI changes its corporate name to Sierra Oncology.
New ticker $SRRA
ER’s
$JPM $BAC $WFC $BLK $KBH $DAL
—
#JPM17
$CELG $AMGN $VRX $JUNO
$BLUE $KITE $ONCE $CLVS
$GILD $REGN $SGEN $BIIB
$BMRN $JAZZ $RDUS $HALO
ARIA aquired by Takeda for $24/sh. 5.2 billion deal
Mars to Acquire VCA Inc $WOOF for $9.1B
If you are new to our trading service you should review recent blog posts and at minimum our algorithm Twitter feeds because they do tell a story in terms of the market and how the inflections of the market determine our day to day trading. You will notice the algorithmic modelling has been undeniably accurate with many time-frames (intra-day, weeks and months out) so I myself have learned to respect their math (they have taken me from a 60% hit rate to 80% in my trading – all publicly posted live trades).
The algorithm Twitter feeds can be found here:$WTI (@EPICtheAlgo), $VIX (@VexatiousVIX), $SPY (@FREEDOMtheAlgo), $GLD (@ROSIEtheAlgo), $SLV (@SuperNovaAlgo), $DXY (@DXYUSD_Index). . Our lead trader Twitter feed is here @curtmelonopoly, lead developer @hundalSHS, and newest trader @quadzilla_jr.
Momentum Stocks (Market Open and Intra-Day):
I do trade morning momo stocks, but I do avoid risk – so often I avoid the first 30 minutes (gap and go) and trade momentum stocks later in the day after the wash-out looking for a snap-back. Just prior to open and shortly after open I post momentum stocks to the trade chat room (and Twitter and Stocktwits if I have time).
Some of my Favorite Set-Ups:
(1) Momentum Stock Wash-Outs for Snap Back, (2) Bad News Wash-outs on Stocks with High Institutional Ownership, (3) Getting on the Right Side of a Trend Change and scaling in my position and (4) Our Algorithm Set-Ups.
The momentum stocks (from previous days and morning trade) I continue to watch through the day for indicators that allow a trade.
Morning Stock Watch-Lists for my Favorite Set-Ups:
(1) Pre-Market Gainers Watch-List: Gainers:$MSTX 82%, $MACK 38%, $ARWR 14%, $BIOC 13% $EXAS 9% $CRNT $ABIL $ASM $JNUG $DRYS $NUGT $ZFGN $PTLA $NAK $DWT $DGAZ
I will update before market open or refer to chat room notices.
(2) Pre-market Decliners Watch-List: Losers: I will update before market open or refer to chat room notices.
(3) Other Watch-List:
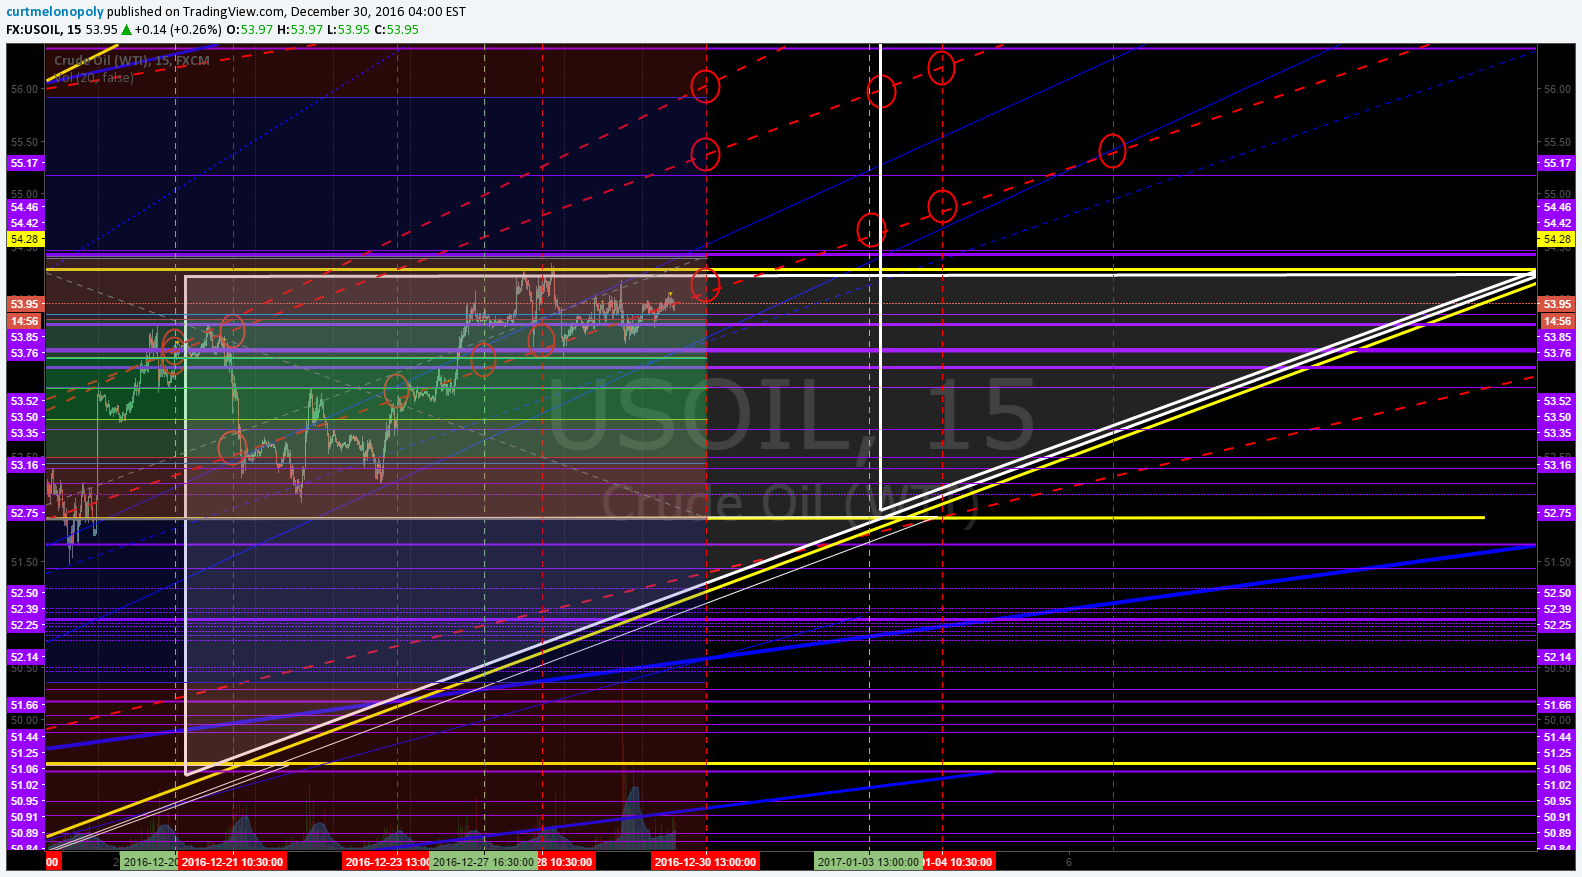
(4) Regular Algo Charting Watch-List: Gold $GC_F $GLD, Miners $GDX ($NUGT, $DUST, $JDST, $JNUG), Silver $SLV $SI_F ($USLV, $DSLV), Crude Oil FX: $USOIL $WTI ($UWTI, $DWTI, $USO, $UCO, $CL_F, $UWT, $DWT), Natural Gas $NG_F ($UGAZ, $DGAZ), S & P 500 $SPY $ES_F ($SPXL, $SPXS), US Dollar Index $DXY ($UUP), Volatility $VIX ($TVIX, $UVXY, $XIV)
(5) Upgrades: $UNP $OAS $MPEL $AMP $NE $TRUE $VER $FMSA $NUE $ZEUS $DRQ $RS $RYI $ROK $DO $SJR $BRKS $WRE $SRCL $AMTD $RJF $CMI $KMI $KRG $LHO $TXN $CLX $IT $VALE $BCS $ST $JD $BIDU $VVC $DPS $KO $VIAB $NI $EHTH $NMBL $ETN $ITT $ROKA as time allows I will update before market open or refer to chat room notices.
(6) Downgrades: $AXS $DTE $AHL $NLS $JBHT $BCE $WFT $MAIN $MRCC $FDUS $ACAT $EGRX $CXP $GPT $WHLR $RTEC $MANH $OFC $EGP $O $CDR $DEA $REG $IFF $SLG $SPG $RPAI $RPT $GGP $DLR $BXP $LMCA $ERIC $VMW $ETP $RCI $PM $SAM $PG $BCE $AIZ $VOYA $JNPR $PAAS $EXKA as time allows I will update before market open or refer to chat room notices.
Stay tuned in Stock Chat Room for more pre-market stocks on watch.
Study:
For new readers, a review of our unlocked posts on our blog would help you get in to the story we are following with the securities listed in this newsletter.
Free scanners to find momentum stocks that you can easily review charts of for indicators that bring probability of your trade being successful up considerably. These are not useful for first 30 minute market open gap and go type plays (you need a good momentum scanner, level 2, and best to have hot-keys for the first 30 mins of gap and go trading)… but are very useful for intra day scalping and swing trading (start with trending stocks and then look at indicators intra for simple set-ups – study scan study scan study scan).
http://finviz.com/
https://finance.yahoo.com/screener/predefined/ec5bebb9-b7b2-4474-9e5c-3e258b61cbe6
http://www.highshortinterest.com/
http://www.gurufocus.com/short-stocks.php
http://www.3xetf.com/all/
http://www.etf.com/channels/gold-etfs
GL!
Curtis
Article Topics: $MSTX, $MACK, $ARWR, $BIOC, $EXAS, $UGAZ, $DGAZ, $NUGT, $DUST, $USLV, $DSLV, $UWT, $DWT, $JNUG, $JDST, Stockmarket, Pre-Market, Trading Plan, Wall Street, Stocks, Day-trading, Watchlist, Chatroom, $CBMX, $JUNO, $GLD, $GDX, $NUGT, $JNUG, $USLV, $DUST, $UWT, $GOLD, $SILVER, $USD/JPY, $USOIL, $WTI, $VIX, $SPY, $NATGASUSD, $NG_F, $DWT, $SLV, $GLD, $DXY, $XAUUSD, $GC_F