Good morning swing traders and welcome to the Compound Trading weekly Swing Trading stock picks memo for the week of March 12, 2017! $VCF, $GOOGL, $AMZN. $SPY $WTIC, $GLD, $GDX, $SLV, $DXY, $VIX, $CELG, $GOOGL, $AMZN, $CALA, $XLT and more.
Email us at [email protected] anytime with any questions about any of the swing trades listed below. Or, if we get bogged down private message Curtis in trade room or direct message him on Twitter. Market hours are tough but we endeavor to get back to everyone after market each day.
Notices:
The markets are in a difficult position right now for new swing trading entries, so I have spent time cleaning up the charting and expanded on various indicators I am looking for. We are closing as many swing positions as we can (or recently have) and are looking to our six standards ($SPY, $WTI, $VIX, Gold, Silver, $DXY) and related products to primarily swing trade until the market consolidates and / or pulls back temporarily. You will notice increased charting and/or links below for those plays.
So most of this charting is in a wait and see mode but the indicators we are looking for are outlined, you may recall in recent reports we were waiting for the oil resistance to play out and it has – it failed. So now its a temporary wait scenario. Stay close to our email updates we will be sending our swing trading members in the coming days. With as many of these plays waiting for decisions we expect another round of numerous swings again very soon. In the meantime, get to know the pending charts below well and the indicators so you are ready when the indicators line up.
Any updates below specific to recent reports are highlighted in red to simplify the process for you.
$CELG
Mar 12, 2017 – The Stoch RSI hasn’t cooled, in fact it has heated since last report. Also below is the MACD, it’s near pinching so it may be best to take a short position soon and flip to long when MACD turns to buy signal.
$CELG MACD Swing Trade Chart: https://www.tradingview.com/chart/CELG/KS53j1IE-CELG-MACD-almost-on-sell-Short-at-cross-and-long-at-turn-up/

Mar 7, 2017 – Looking for Stoch RSI to cool to bottom range for swing trade.
$CELG Live Trading Chart: https://www.tradingview.com/chart/CELG/u99gKSpz-CELG-looking-for-Stoch-RSI-to-cool-to-bottom-for-swing-trade/

$LITE
Mar 12, 2017 – 20 MA did not hold and MACD on a sell. Wait for MACD to signal buy and review then.
$LITE MACD Chart https://www.tradingview.com/chart/LITE/6mOiMa4Z-20-MA-did-not-hold-MACD-on-sell-Wait-for-MACD-to-signal-buy/

Mar 7, 2017 – $LITE I’m looking for 20 MA to hold for entry long swing trade.
$LITE Live Swing Trading Chart : https://www.tradingview.com/chart/LITE/nU0igzAu-LITE-I-m-looking-for-20-MA-to-hold-for-entry-long-swing-trade/

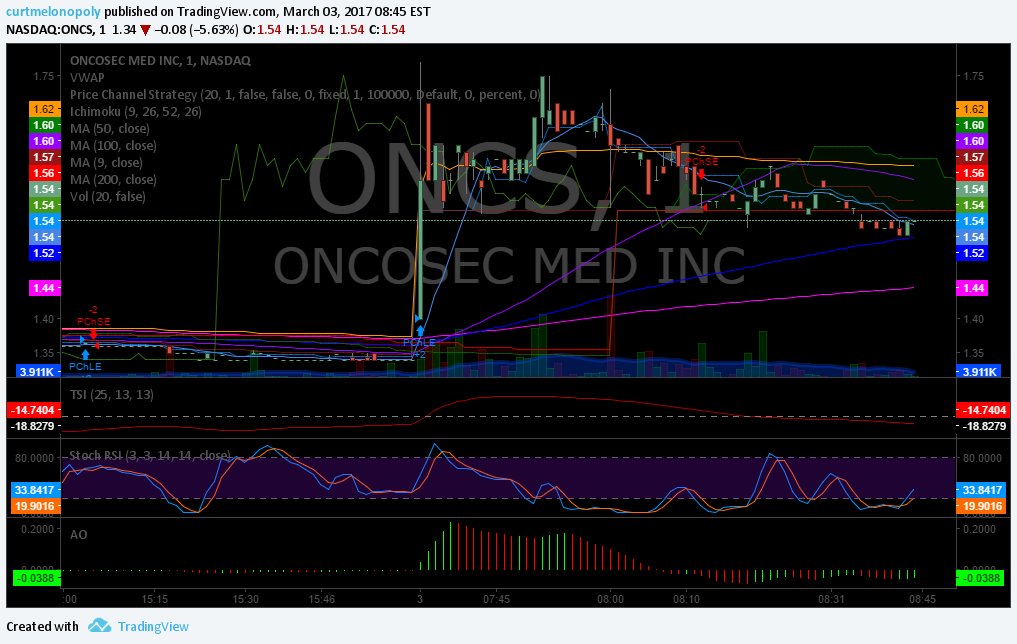
$CALA
Mar 12, 2017 – $CALA Declining volume, MACD likely turn down, 9 MA just holding. No resolution. Caution.
$CALA chart https://www.tradingview.com/chart/CALA/ma6v15V7-CALA-Declining-vol-MACD-likely-turn-down-9-MA-just-holding/

Mar 7, 2017 – $CALA Waiting for Stoch RSI to cool for a swing trade.
$CALA Live trading chart: https://www.tradingview.com/chart/CALA/8q5LxIls-CALA-Waiting-for-Stoch-RSI-to-cool-for-a-swing-trade/

$XRT – SPDR S&P Retail ETF
Mar 12, 2017 – The Stoch RSI is starting to pinch at bottom of range (see Mar 7 chart), MACD is still on sell however. On close watch here.

Mar 7, 2017 – Watching close for a bounce. Stoch RSI on chart is near bottom so on high watch here.
Feb 27, 2017 – Trading at 43.72 this beat up sector seems to be ripe for a bounce. If we execute a trade on Monday it will be to test the waters and watch the market sentiment day to day – this and price action will determine how long we are in it. An interim target however would be 46.80 and would likely change as the trade progresses.
$XRT Retail Live Chart – https://www.tradingview.com/chart/0oELdpX1/

$EXP Building Materials
March 12, 2017 – $EXP Eagle Building Materials MACD still on sell, but expanding volume in play with 100 MA test. On watch for bounce.

Mar 7, 2017 – $EXP Building Materials watching close for a bounce.
Feb 27, 2017 – “Eagles Materials Posted Record Revenues, Record Net Earnings and Record Net Earnings per Diluted Share. Its stock grew 60% in 2016 and still looks cheap.”
Eagle Materials is a riskier play than most we will add to our swing portfolio, but our DD on this one has us excited and we likely will take a long position early this week with a target of minimum 10% upside in next 90 days. We will however keep our stop tight.
http://finance.yahoo.com/news/post-earnings-coverage-eagles-materials-131500431.html
$EXP Live Trading Chart – https://www.tradingview.com/chart/EXP/TpeK4yNK-EXP-Building-Materials-Watching-close-for-bounce-swing-trading/

$FIT
Mar 12, 2017 – $FIT FitBit Under 9 MA, MACD pinch, no volume expansion yet. On high watch.

Mar 7, 2017 – It hasn’t got its bounce yet – still watching. Trading at 6.00.
Feb 27, 2017 – We find the $FIT trade interesting. Although we would never otherwise consider it and if we do enter today a long position it will be looked at as short term, we think there may be opportunity to swing trade it because it should be much lower considering its recent quarter… lower in that we expected a panic that did not occur. This seems bullish, or at minimum a likely “bargain” in our opinion.
$FIT Swing Trade Target 6.99. Trading at 6.15.

$VFC
Mar 12, 2017 – $VFC Holding but trade tentative as MACD pinching and declining volume.

Mar 7, 2017 – Holding long per Feb 23, 2017.
Feb 23, 2017 – $VFC Swing long 53.50 average with 58.10 as first upside target. More targets in upcoming reports.

$NE – Noble Corp
Mar 12, 2017 – $NE Trade has turned against us with a sell signal on MACD. Holding on conviction. We believe it is near over-sold and this sector of the industry is near a turn in profit divergence.
Mar 7, 2017 – Holding long. Trading at 6.46.
Feb 23, 2017 – $NE Swing long opened 6.95 average for a 9.00 upside target.

Alphabet (Google) $GOOGL, $GOOG
Mar 12, 2017 – $GOOGL Swing trade going well. In at 848.91 – holding and adding on dips (will advise). MACD on buy.

Mar 12, 2017 – $GOOGL Quarterly Swing Trading Performance Review. Long Feb 22 848.91 200 Shares. Unrealized gain 2570.00. Hold.

Mar 7, 2017 – Holding long per Feb 22, 2017. Trading at 847.27.
Feb 22, 2017 – We entered a long position starter at 848.91 200 shares. Stops will be managed manually and will be held tight until trade is to upside of current range. Pensive about short term market range.
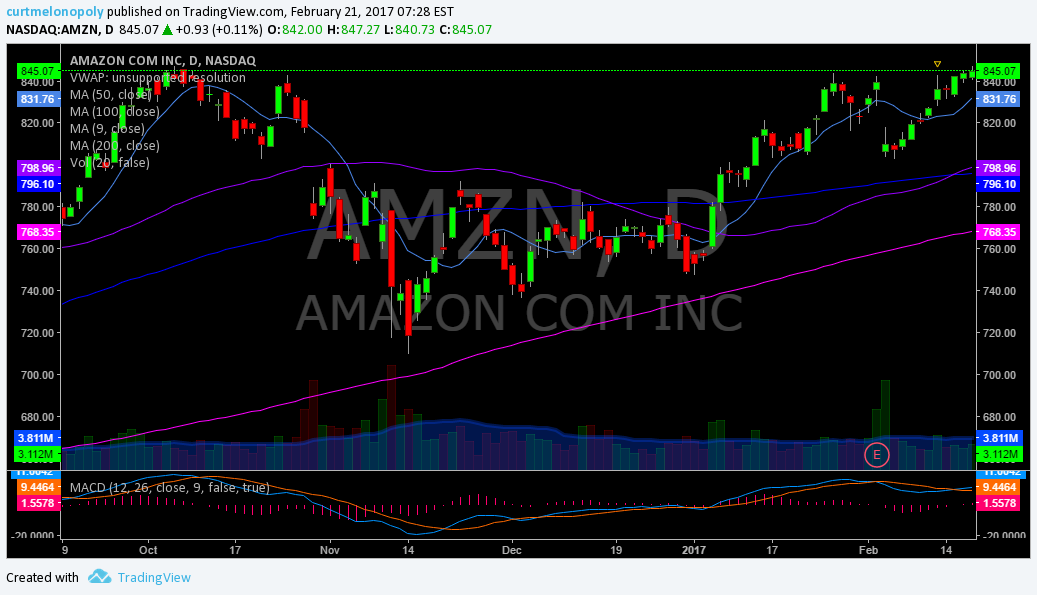
Feb 21, 2017 – Price is to the topside of the break-out and I will likely enter a long position over the next day or two. Bullish on this stock.
Feb 12, 2017 – We still like the $GOOGL stock / chart. Price recently broke to the upside of the triangle and didn’t hold but is threatening to trade above again at Friday close. We’re watching for an upside break that holds for an entry or a visit to the 200 MA (pink line) for an entry.
Feb 7, 2017 Member Update: We expect a signal from the Trump camp soon (late this week), and if positive, this will be a very strong play – watch close! This needs to be high on your radar going forward!
We like this chart. Watch for an upside break out of the triangle. The principles apply the same to $GOOG and $GOOGL charts fyi. Also, watch the MACD close, it looks primed for a move. Earnings are Thursday. If price breaks to downside I will update with levels to watch. Also, the is a chart below that shows upside target.

Link to live $GOOGL chart in TradingView.
https://www.tradingview.com/chart/GOOGL/isvDnbTQ-Swing-Trading-Member-Chart-GOOGL/
1003.17 Price Target in 2017 with upside break-out. Alphabet (Google) $GOOGL
Technically, the price target (should price break to upside) is 1003.17 before Jan 29 2018.

Amazon $AMZN
Mar 12, 2017 – $AMZN Amazon Swing Trade going well. In at 822.72 trading 852.46. MACD on sell will add when MACD bottoms and turns (will advise).

Mar 12, 2017 – $AMZN Quarterly Swing Trading Performance Review. Long Feb 10 822.72 100 Shares. Unrealized gain 2930.00. Hold.

Mar 7, 2017 – Holding long and may add on dips now. Trading at 846.46.
Feb 21, 2017 – Trading at 839.48 in premarket we’re on the right side of this swing so far. Depending on price action I will look to add at pull backs. Very bullish this stock.
Feb 12, 2017 – Trade Alert! We entered a trade long at a cost average 822.72 for 100 shares as soon as price was upside the 20 MA. This is an aggressive trade (being that we didn’t wait for a pull-back to 50, 100 or 200). We have a tight stop on the trade at 804.00 (just below its recent low (this would be a broken trade in our opinion at that point). So we are hoping this week is a strong week for Amazon. If not our aggressive move will cost us.
Amazon Swing Trading Live Chart: https://www.tradingview.com/chart/AMZN/ZQt7CJMs-AMZN-Amazon-Swing-Trading-Member-Chart/

Feb 7, 2017 Member Alert! We haven’t got a pull back to the 200 day and depending on how tech does with Trump we may or may not, however, in overnight trade (premarket) price is close to the 100 day and I may take a test long position. This is one of our favorite picks so we will be quite aggressive with our attempts to get in at an inflection – so we are thinking sometime in the next few days looks decent.
My fourth priority is Amazon. I don’t want to over simplify this trade – but the bottom line is I’m looking for a pull-back and an entry as close to that 200 day (pink line with green arrow) as possible. I don’t think this stock will stop anytime soon. DD to follow soon.

Juno $JUNO
Mar 12 – Member Alert! We will look at a re-entry on this when MACD turns back up!
Feb 21, 2017 – On Feb 16 we closed our position at 23.88.
Feb 12, 2017 – We have been long since late December at 18.32 (1000 shares) and it trades at 21.95 now – will be ratcheting up stops soon, the trade has done well but in the short term we don’t see a lot of upside for entries now, unless trade returns to the 50 day MA.
$JUNO Another Swing Trade Winner. Swing Trade Member Stock Pick is up 20%.

Feb 7, 2017 Member Update: $JUNO since my first entry mid December 2016 has consistently moved in an upward trend, and from that perspective has been a good stock pick. But it hasn’t been excellent like many of my other picks. It does have a gap fill coming soon so if you are long I would ratchet up your stops as you near 22.70 area.
$JUNO Live Chart Link: https://www.tradingview.com/chart/JUNO/W0WEYDQJ-JUNO-Swing-Trade-Member-Stock-Pick/

CombiMatrix Corp $CBMX
Mar 12 – Member Alert! We will look at a re-entry on this when MACD turns back up!
Mar 12, 2017 – $CBMX Quarterly Swing Trading Performance Review. Long Dec 6 2.59. Closed Feb 22 5.01. 10000 Shares. + 24,200.00 P/L 93% gain.

Feb 22, 2017 – We closed our long positions in late trade and extended hours at 5.01 average.
Feb 21, 2017 – It is trading at 3.90 in premarket and recently as high as 4.23. Holding.
Feb 12, 2017 – This stock hasn’t slowed down since our entry at 2.59 (10000 shares) and doesn’t seem to want to return to the trendline support so our swing trade members can get in. It is trading perfectly in our prescribed range (albeit at the top) and closed at 3.90 on Friday – we have a 5.57 PT on it so I don’t if it is best to enter now – I wouldn’t unless it returns to the support line but some of the more aggressive swing trading members may want to consider it. Also, we will be ratcheting stops before earnings and even though earnings are expected to be strong we likely will not hold through earnings (or if we do it will be with tight stops).
$CBMX news – http://finance.yahoo.com/news/cbmx-expect-record-revenue-profit-140000918.html
$CBMX Swing Trade Stock Pick Doing Well up 50% Now.

My second priority is $CBMX. I am already in this swing and plan to enter in dips at the diagonal trend line (blue). Initial target area is around 5.57 with much greater potential upside. The Trump factor may cause this to come off a bit so my bias is toward late spring for first price target.
https://www.tradingview.com/chart/CBMX/qtdyUyY0-CBMX-Swing-Trade/

OakTree Capital $OAK
Mar 12, 2017 – $OAK on swing trade high watch now. 200 MA may cross 50 MA. Watch MACD for turn up.

Feb 21, 2017 – We closed our position last week at 46.04 because sentiment in this sector started to turn. We may look at a re-entry, however, we are waiting for the crude oil resistance test to play out and would like to monitor sentiment.
Feb 12, 2017 – This has been a fantastic swing trade and many of our members have profited from it. We are holding and have moved up stops to a 5% drop.
It is currently trading at 45.70 and is up considerably for our members – our 2017 price target was 49.58 and our short term price targets were easily met.
It is also currently trading just above its 200 MA so we are watching close – if it loses the 200 MA we will exit likely. So if you are thinking of adding or a long trade here you want to watch the 200 MA.
$OAK OakTree Capital Group Swing Trading Alert for Members has done well with 25% gains in 2017

Oaktree Capital Group, LLC (OAK) today announced that it will report fourth quarter and full year 2016 financial results prior to the opening of the New York Stock Exchange on Tuesday, February 7, 2017.
http://finance.yahoo.com/news/oaktree-schedules-fourth-quarter-full-133000267.html
Was trading at 37.57 – 38.00 when we originally started to look at it, currently trades at 41.65.
42.71 – 43.50 is our short term swing target (less than 3 months).
Feb 7, 2017 Member Alert! $OAK has met this swing trade target for our members – caution forward please!
49.58 is our 2017 target. No target date.
Our traders will be watching earnings (much like we did with Google last week and we will be doing with Amazon this week). Pending earnings and price action this will be when we enter a trade. Some of our swing traders have obviously seen decent gains since we first put this on our swing trading list a number of weeks back (good timing actually), but our traders have not taken a position yet.

Oaktree Capital Trading View Live Charting:
https://www.tradingview.com/chart/OAK/w2CBerv2-Swing-Trading-Newsletter-Oaktree-Capital-OAK/
VanEck Vectors Russia ETF $RSX
March 12, 2017 – $RSX On high watch now. Price testing 200 MA, increasing volume, MACD may turn, 20 MA to cross 200 MA.

Feb 21, 2017 – Still monitoring – no position.
Feb 12, 2017 – Decided considering geo political sentiment that I will consider a long at 50 MA or a break to upside now.
Feb 7, 2017 Alert! Although this has done exceptionally well since my first entry late 2016 I am now out of my position and am awaiting a pull back to 100 day at minimum.
$RSX Swing Trade Stock Pick – Waiting for Test of 50 MA or break to upside.
$RSX Live Chart – https://www.tradingview.com/chart/RSX/rjR7GATQ-RSX-Swing-Trade-Stock-Pick-Waiting-for-Test-of-50-MA-or-break/

BOFI Holdings $BOFI
Mar 12, 2017 – $BOFI Waiting for MACD to turn up for another long entry.

Feb 21, 2017 – Watching.
Feb 12, 2017 – $BOFI Swing Trading Stock Pick After Dec Entry – Now Waiting for 200 MA PB test on 60 minute chart below or break out.
$BOFI Live Chart: https://www.tradingview.com/chart/BOFI/krBzI22u-BOFI-Swing-Trading-Stock-Pick-After-26-18-Dec-Entry-Waiting-for/

Feb 7, 2017 Member Update! Here is another I have done well since my first entry late 2016 and I am now waiting for another pullback to at least the 50 day if not 100 day to add. Holding full position and expect a return of 6% approximately (from today’s price) in 2017. If I can get a pullback I will be very happy.

Sunoco Logistics Partners $SXL
Mar 7, 2017 – Holding Long.
Feb 21, 2017 – Watching the 200 MA – may add pending crude oil price action.
Feb 12, 2017 – $SXL Sunoco Swing Trading Stock Pick is Performing Excellent Since Late Dec Long Position and Jan addition to this list. We are currently waiting for a test of the 200 MA on the 60 day for an add to 1000 shares or a sell. Excellent trade so far.
$SXL Live Trading Chart: https://www.tradingview.com/chart/SXL/Zxq4BCtJ-SXL-Sunoco-Swing-Trading-Stock-Pick-is-Performing-Excellent-Sin/
$SXL Sunoco Swing Trading Stock Pick is Performing Excellent Since Late Dec Long Position

US Silica Holdings $SLCA
Mar 12, 2017 – $SLCA On long position high alert watchlist for 200 MA to hold and MACD to turn up (will advise).

Mar 7, 2017 – We stopped out flat and are keeping it on watch list for now.
Feb 21, 2017 – Hold, managing stop. We like it, but it may stop out flat.
Feb 12, 2017 – We have our first entry in $SLCA at the 50 day 55.77 500 shares. We are going to watch how it handles the 20 MA. If it returns to our buy at 55.77 area we may cut bait.
$SCLA Live Trading Chart: https://www.tradingview.com/chart/SLCA/kYwi9RAO-SLCA-Swing-Trade-Member-Stock-Pick-Entry-at-50-MA-long-for-a-t/

Feb 7, 2017 Member Alert! We never did get that pull back, and I appreciate the notes from members that have done well with this swing nonetheless! However, caution is warranted entering this play with-out a pull-back.
My fifth priority is $SLCA. Again, another simple chart and it will require some patience. I see a pull-back coming and huge upside under the Trump inertia in to summer. I am looking for a pull-back to the 50 day (yellow arrow) or the 100 day preferably (blue arrow). If it gets away on me I’ll likely chase it and scale in 1/5th at a time.

$EOG EOG Resources
Mar 12, 2017 – $EOG On high alert watchlist for swing trade. 200 MA test has held. Waiting for MACD to turn up.

Feb 21, 2017 – Stopped flat. Keeping on watch.
Feb 12, 2017 – New Entry! $EOG Resources Long entry 98.77 at 100 MA 300 shares starter. Swing Trade Stock Pick. If it fails at our entry price we will exit and re-evaluate.
$EOG Resources Live Chart – https://www.tradingview.com/chart/EOG/5pnQP44r-EOG-Resources-Long-entry-98-77-at-100-MA-Swing-Trade-Stock-Pic/

$GREK Global Greece ETF
March 12, 2017 – On high alert watchlist now – MACD about to pinch. Watching for MACD turn up.
Feb 21, 2017 – Watching.
$TRCH Torchlight Energy
Mar 12, 2017 – Holding position. MACD turned down and will add when MACD turns up. Holding 2000 at 1.50 trading at 1.36. Near the stop loss area but for myself this is a conviction trade based on Trump and this specific company. It is also a relatively small position.

Mar 7 2017 – Holding.
Feb 21, 2017 – Holding, watching for possible add.
https://www.tradingview.com/chart/TRCH/xxpZ4uPM-TRCH-Swing-Trade/

$NG Nova Gold
March 12, 2017 – $NG Quarterly Swing Trading Performance Review. Long Jan 12 5.14. Closed Feb 27 5.81. 2000 Shares. +1340.00 PL 13% gain.

March 7, 2017 – We figured in our last report we may close. Feb 27, 2017 we closed for 5.81.
Feb 21, 2017 – Hold, watching, may close position.
Feb 7, 2017 – $NG Nova Gold Swing trade members are pleased with stock pick 5.14 buy alert trade up to 6.21 (22% gain) at 5.98 now.
$NG NovaGold Live Chart – https://www.tradingview.com/chart/NG/7sroM8Ai-NG-Nova-Gold-Swing-trade-members-are-pleased-with-stock-pick-5/

The first swing of 2017 I will be entering (likely today) is NovaGold. First target is 6.46 area and second target is 7.30 area. It is currently trading at 5.10. It’s full extension is over 8.50.
https://www.tradingview.com/chart/NG/1Sz7RDKg-NG-Novagold-Swing-Trade/

$ASM.
Mar 12, 2017 – $ASM Quarterly Swing Trading Performance Review. Long Feb 6 1.95 2000 Shares. Unrealized loss 280.00. Will hold and add at turn on $MACD.

Mar 7, 2017 – Holding our small position.
Feb 21, 2017 – Holding, watching 200 MA.
Feb 6, 2017 $ASM comes to us by reference of HedgeHog trader who has spent some time in our trading room lately and is a close friend of ours. His due diligence on this one is solid in our opinion and the chart is about to break out – it is just shy of the 200 day! Here’s the transcript of his attendance in our trading room yesterday if you wish to view. He also mentions in that transcript other picks he likes (such as $NG, $THM, $NAK, $CPO.V).
$ASM Chart Live on Trading View: https://www.tradingview.com/chart/ASM/Wn17X1qn-ASM-Swing-Trade-Member-Chart/

Our Standard Algorithmic Modeling Securities I will be providing Swing Trade levels for are:
$SPY
Mar 12, 2017 – Waiting for MACD to turn up for long position $SPXL.

Feb 17, 2017 – Watching, no position.
Feb 12, 2017 – This is interesting, price action late last week was promising, we are watching indicators for a long position.
$SPY Live Trading Chart – https://www.tradingview.com/chart/SPY/rwRqqh0q-SPY-Swing-trade-stock-pick-based-on-MACD-signals-Long-at-the-g/
$VIX
Mar 12, 2017 – Waiting for MACD to turn up for long position and even that has only moderate success – caution warranted.
Feb 12 – $VIX has done nothing. Watching.
My seventh priority is the VIX. I see a pull-back in the market coming and a lift in VIX. The primary trade I am looking for is actually a short in the VIX when it gets upside it’s bolllinger band (it’s a little more complicated than that – specifically with timing and I will be putting an alert out when I do it anyway) – I’ll also play some short term longs in $TVIX or $UVXY.
https://www.tradingview.com/chart/VIX/t6YF7SQY-VIX-Short-Swing-Trade-Above-Bollinger-Band/

$DXY
Mar 12, 2017 – Swing Trading $DXY #USD #Dollar KISS MACD Nets Decent Annual ROI – waiting for test of MACD and for it to turn up to take a long position in $UUP – could happen any moment. But the MACD is key here, it could fail. See chart at link below.
Feb 21, 2017 – Watching, no position, watch for update over the next few days to include this.
$SLV SILVER
Mar 12, 2017 – Waiting for MACD to turn up before considering a long trade.
Feb 21, 2017 – Watching, no position, watch for update over the next few days to include this.
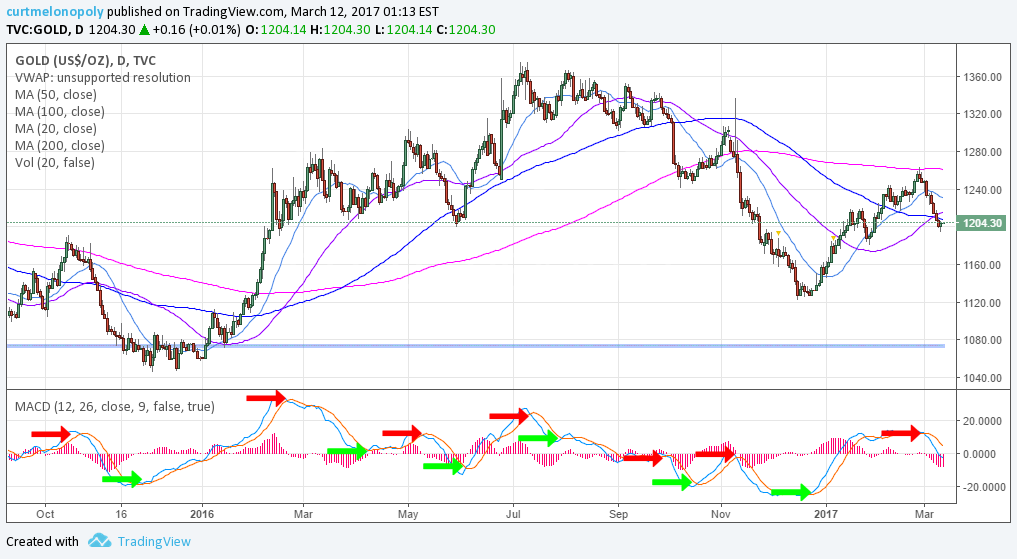
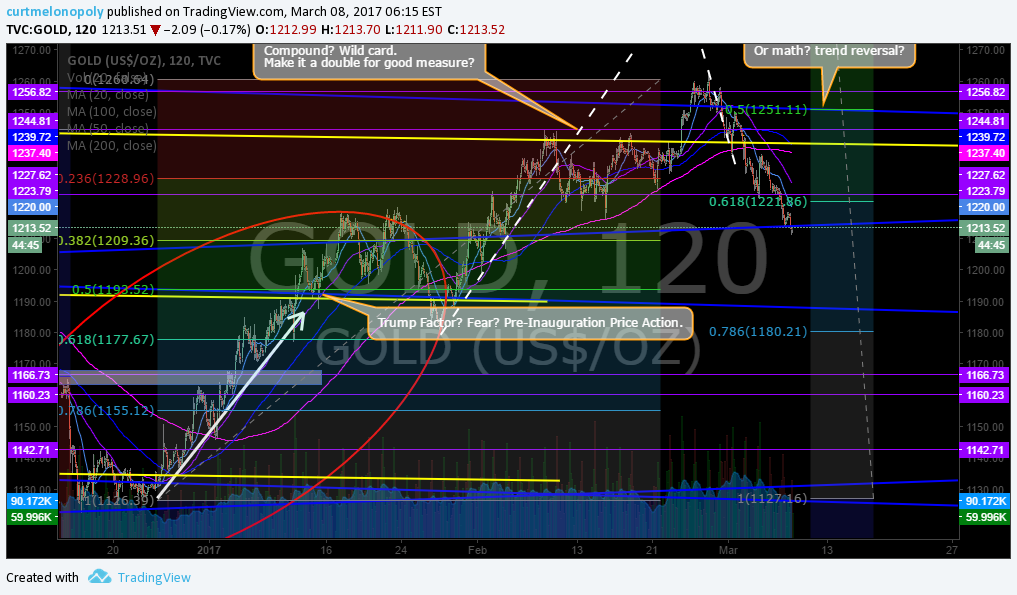
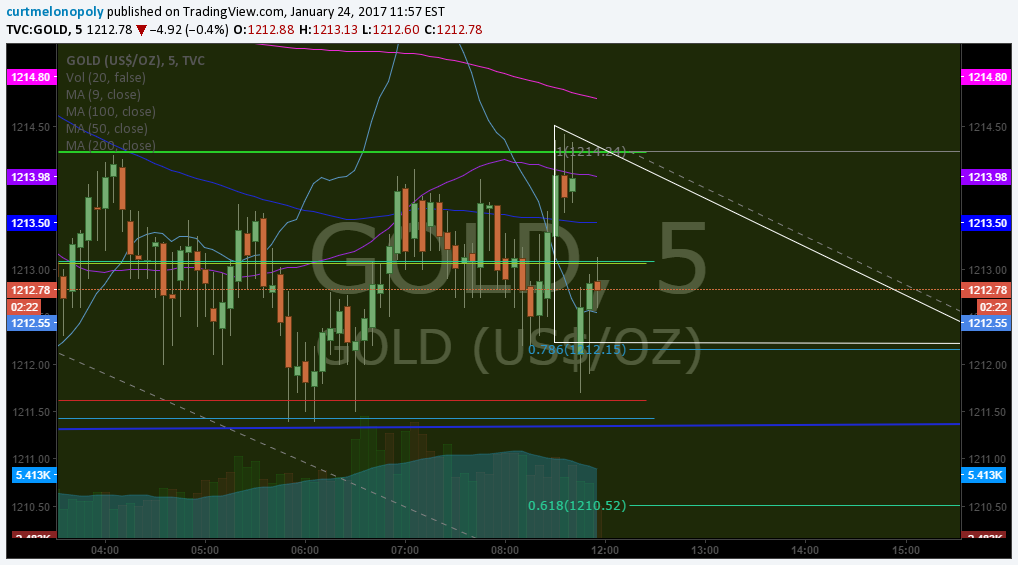
$GLD – Gold (and miner’s $GDX)
Mar 12, 2017 – Waiting for the MACD to turn up before considering another trade in $GDX and Gold.
Mar 7, 2017 – We closed the last 25% on Feb 27 23.80. Nice trade.
Feb 21 – Friday we trimmed 75% at 25.18. Watching.
Feb 14, 2017 $GDX trade went exactly as planned. Waiting for trading this week for further trade decisions.
$GDX Swing Trade Member Stock Pick went exactly as planned – a 13% gain. Waiting for trading this week for further trade decisions.

Feb 7, 2017 $GDX Alert – Members, this trade went exactly as planned and is now beyond our call so caution please!
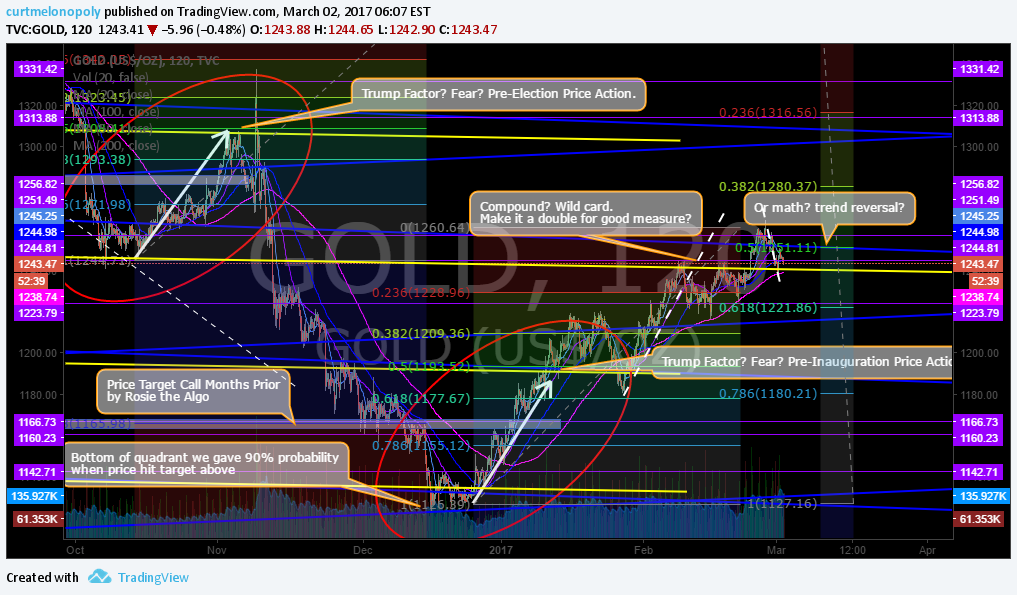
My third priority on this list are the miner’s – $GDX and leveraged friends. This one is risky but comes with large gains if miner’s get moving and price breaks in to next quadrant above the yellow one outlined on the chart below. And for the risk taker it can be traded with leveraged ETN’s. There are inherent risks however; one is that price is not at bottom of the trading quadrant so an entry here is not ideal and the obvious issue is the Trump factor.
https://www.tradingview.com/chart/8QOM4r5s/

$USOIL / $WTI
Mar 12, 2017 – Waiting for MACD to turn up before considering a trade.
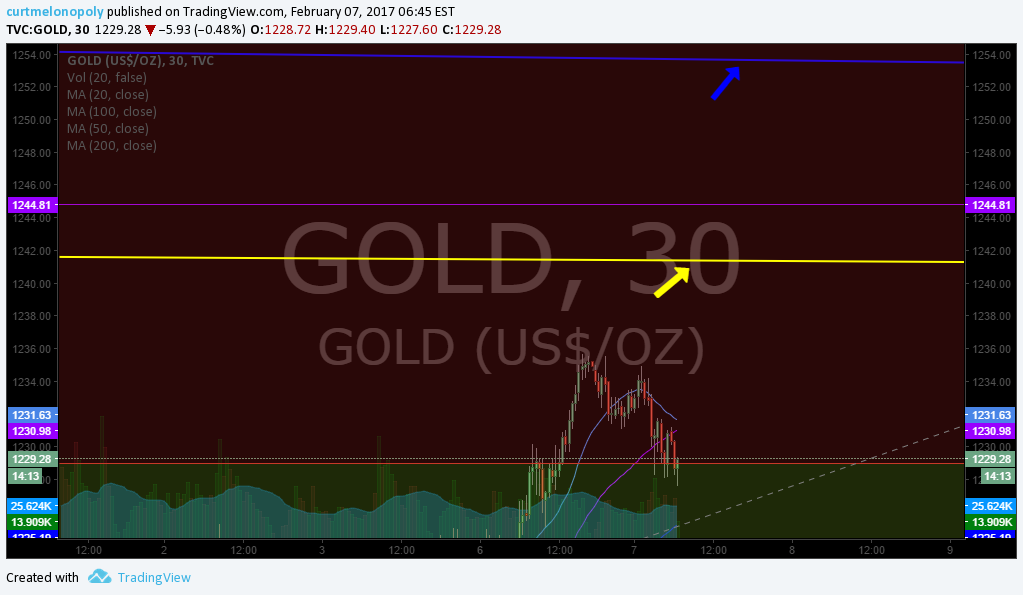
Feb 21, 2017 – On the daytrading side I have been adding to a long that I though would be only days and turned in to a bit of a swing but did not alert it on the swing side because of the risk element. However, crude oil is over the resistance in overnight trade as I write and getting very close to the most significant resistance it has encountered in years. Stay tuned to updates this week, I expect to be putting out a number of updates this week because of this specific scenario. If crude does not handle resistance well I will short it heavily and will post a number of picks surrounding that play. If crude oil gets up over this significant resistance then I will go long and will post an alternate list of stock pics surrounding that play.
Feb 12 – Crude oil traded at resistance on Friday, some may opt to short here but we are waiting to see if price breaks to upside. Will advise.
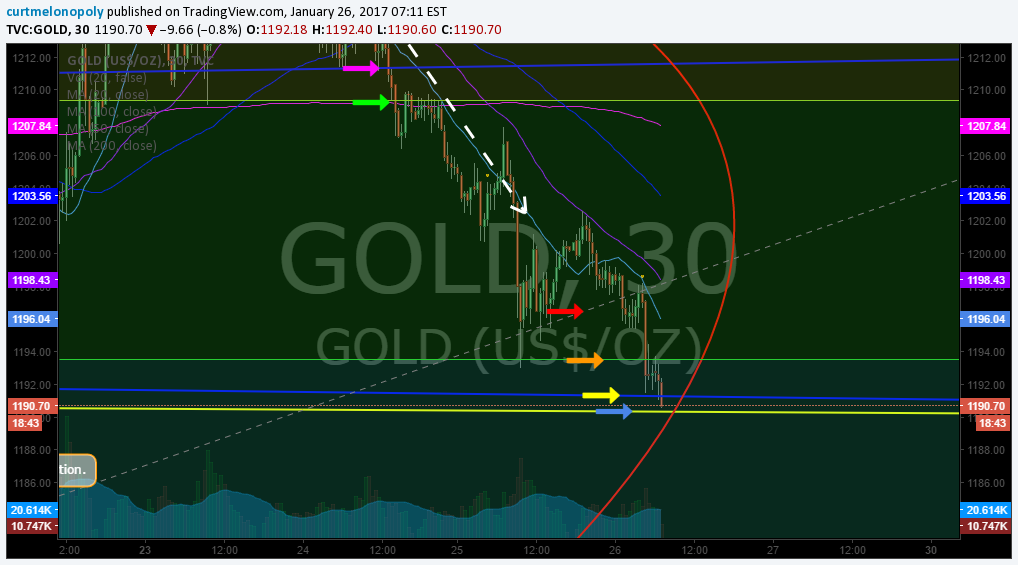
Feb 7, 2017 Update: In overnight trade $USOIL is trading at 52.19 and there is a diagonal support trendline intra-day below at approximately 52.28 – we will be looking at taking a long position in that area if we can get it – with a tight 1% stop.
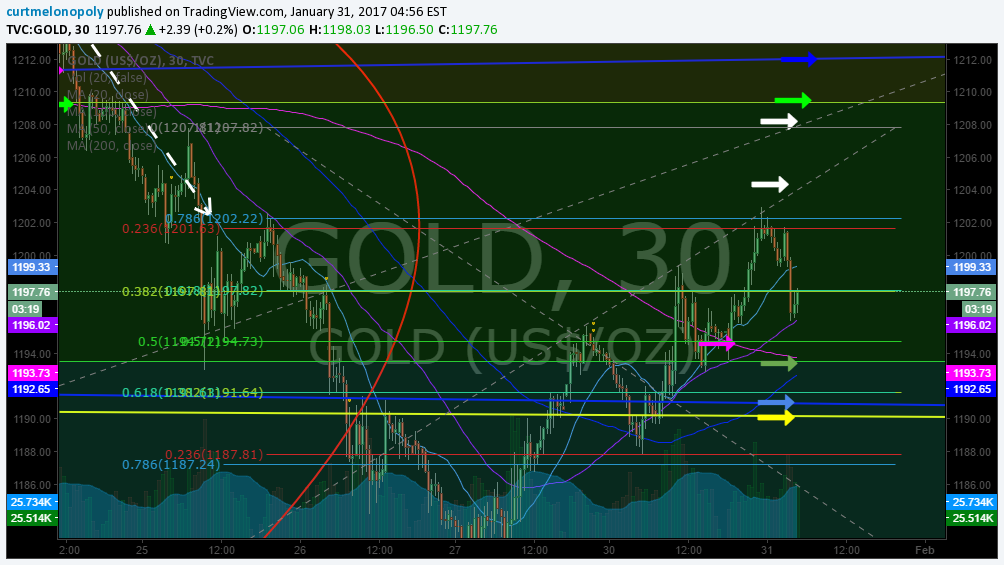
In overnight lab work our developers established a diagonal trendline (blue line in chart that has a blue arrow pointing at it) that has established itself as strong support. If you take a swing trade against that support (as as close to it as possible) then look to the upside of that white dotted arrow line as your target long. Ratchet up stops there.

So that’s it for today, however, when the crude trade plays out in the short term I will be posting an updated list either way (for upside or downside scenario crude oil). Again, I apologize for the unexpected pivot but I have no choice but to see how this crude break-out plays and that won’t take more than two days. So expect all the new plays sometime between now and Thursday.
Email or DM me on Twitter anytime with thoughts or questions!
Cheers!
Curtis
Article Topics; Compound Trading, Swing, Trading, Stock, Picks, $CELG, $LITE, $CALA, $SBUX, $XRT, $EXP, $FIT, $NE, $VFC, $ASM, $GOOGL, $AMZN, $JUNO, $CBMX, $OAK, $RSX, $BOFI, $SXL, $SLCS, $EOG, $NG, $TRCH, $GREK, Crude, Oil, $USOIL, $WTI, Gold, $GLD, Silver, $SLV, $SPY, S&P 500, USD, Dollar, $DXY, Volatility, $VIX