Tag: Volatility
PreMarket Trading Plan Mon Aug 13: Turkey Lira, Elliott Stake Boosts Nielsen, $VIX, OIL, $TSLA, $HOG, $NLSN, $WMT, $ABIL, $DBD, $RSLS, $XBIO more.
Compound Trading Premarket Trading Plan & Watch List Monday August 13, 2018.
In this edition: Turkey Lira, Elliott Stake Boosts Nielsen, $VIX MACD, OIL, $TSLA, $HOG, $NLSN, $WMT, $ABIL, $DBD, $RSLS, $XBIO and more.
Welcome to the morning Wall Street trading day session at Compound Trading.
Notices:
Notes in red text in this report are more recently important.
Scheduled Events:
- Monday Aug 13 – Live Trading Room with lead trader and/or other team members as follows and as available (constant change in the markets);
- 9:25 Market Open – access limited to live trading room members
- 12:00 Mid Day Trade Review – access limited to live trading room members
- Any other live trading sessions will be notified by email.
- The above listed times are expected live trading time blocks only. Live voice broadcast will only occur if there is a trade set-up to discuss by the lead trader. Screen sharing will be active through-out each time frame.
- Link: https://compoundtrading1.clickmeeting.com/livetrading
- Password: **** (email for access if you do not have it, password changes will be emailed when changed only)
- For membership access, options here: https://compoundtrading.com/overview-features/
- July 23-Aug 17 – Swing trading reports to include video chart analysis recaps for the 100 equities we cover (from mid day swing trading reviews) and sent to our subscribers daily in lieu of the weekly swing trading report (mailing list subscribers receive a delayed complimentary version without algorithmic real-time charting and with or without charts).
- Before Sept 1 – New pricing published representing next generation algorithm models (existing members no change).
- Before Sept 1 – Next generation algorithm models roll out (machine trading Gen 1).
- Before Sept 1 – Trading Profit and Loss Published for Q1 and Q2 2018 (a report detailing trading / alert performance of our team).
- Aug 25-26, Santo Domingo – Oil Algorithm (EPIC) Multi-User License Trade Execution & Integration (private invitational, institutional).
- Sept 14-16, Cabarete – Trade Coaching Event – Learn How to Trade or Take Your Trading to the Next Level (public, retail).
Machine Trading Coding Team Mandate: In current development and roll-out (1) Intelligent Assisted #IA Trading Platform (Code Algorithm Models), (2) Run 24 Hour Crypto Trading Desk, (3) Alert Trade Set-ups to Member Alert Feeds (for all models) and near future (4) Machine Learning.
Premarket Report: On lead trader availability basis only (the premarket reports are not published every market day).
Promos:
Promo Discounts End Aug 14 (for new members only).
Weekly Swing Trading Newsletter service Reg 119.00. Promo 83.30 (30% off). Promo Code “30P”. #swingtrading
Swing Trading Alerts Reg 99.00. Promo 69.37 (30% off). Promo Code “Deal30”. #swingtradealerts
https://twitter.com/CompoundTrading/status/1025205887034699776
Private Member Discord Server Chat Rooms: BE SURE to get in to each private Discord server specific to your specific subscription type (bundles) – many of the updates as we go forward will be posted in there and detailed trading plans for alerted trades are often discussed by our lead trader in the rooms. This includes the SWING TRADING platform also. IF YOU NEED A LINK / INVITE email us.
https://twitter.com/CompoundTrading/status/880670140454637569
Real-time Trade Alerts:
Real-time Trade Alerts for Oil, Swing Trading, Day Trading, Bitcoin are available to subscribers by following specific alert Twitter feeds. Oil Trading Alerts, Swing Trading Alerts, Day Trading Alerts, Bitcoin Trading Alerts.
Disclaimer / Disclosure:
Subscribers must read disclaimer.
Recent Blog / Video / Social Posts:
#BitcoinTrading 101: A Beginner’s Guide to Getting Started $BTCUSD $XBTUSD $BTC https://compoundtrading.com/bitcointrading-101-beginners-guide-getting-started-btcusd-xbtusd-btc/ …
https://twitter.com/CompoundTrading/status/927397024315662336
How to Use EPIC Oil Algorithm: $USOIL, $WTI, $CL_F, $USO, $UCO, $SCO, $UWT, $DWT, #OIL, #OOTT: http://youtu.be/hawVV31G9bg?a via @YouTube
https://twitter.com/CompoundTrading/status/889148655785177088
How to Use ROSIE Gold Algorithm: #GOLD, $GLD, $XAUUSD, $GDX, $GDXJ, $NUGT, $DUST, $JNUG, $JDST
https://twitter.com/CompoundTrading/status/889147527278333952
Some Recent Chart / Trade Set-Up Reports:
See You Tube, member email direct reports and blog for other recent videos or blog posts. Listed from most recent. Much of the premium member reporting posted below is delayed and may or may not require password.
Aug 12 – Crude Oil Trading Face-Off Results “Pro Trader” (Man) vs. EPIC Oil Algorithm (Machine Trading Tech)
Earnings Season Charting July 24 $RIOT, $CELG, $ARWR, $EXTR, $EDIT, $SOHU, $ESPR, $LPSN, $XOMA …
Swing Trading Special Report $CELG, $RIOT, $ARWR, $EXTR, $EDIT, $MBRX, $SOHU, $ESPR, $LPSN, $XOMA.
Swing Trading Special Report $SPY, OIL, $VIX, $DXY, $GOOGL, $HCLP, $ARRY, $ARWR, $CDNA, $XXII, $SSW
Swing Trading Set-ups Special Report; $VIX, $DXY, $SPY, $DIS, $RCL, $RKDA, $SQ, $HEAR, $TGTX, $SMIT
“The Nut Hand” Today’s Huge Oil Trade Win. Exactly How It Was Done. How I Knew & How You Can Too.
How to Swing Trade Like the Pros and Win Most Trades.
Protected: How to Trade Allergan (AGN) Stock Move (Exclusive) $AGN
Recent Educational Articles / Videos:
I get a lot of Q’s on How to Trade our models, this vid has 5 min explanation at 1:00 min-6:00 min. https://www.youtube.com/watch?v=QrXbE7lojAg&t=3s … – Fib Trendlines, Trading structure/quads, Price targets, Main support resistance (buy sell triggers), Time cycles, Moving averages, Trading trims/adds.
I get a lot of Q's on How to Trade our models, this vid has 5 min explanation at 1:00 min-6:00 min. https://t.co/oqezvVcn0y … – Fib Trendlines, Trading structure/quads, Price targets, Main support resistance (buy sell triggers), Time cycles, Moving averages, Trading trims/adds.
— Melonopoly (@curtmelonopoly) May 13, 2018
Trading Plan (Buy, Hold, Sell) Watch Lists. Morning Momentum / Gap / News / PR / IPO / SEC Filings / Earnings Stocks on Watch:
Stocks making the biggest moves premarket: VFC, HGV, WMT, HOG & more –
Stocks making the biggest moves premarket: VFC, HGV, WMT, HOG & more – https://t.co/wkAoBtDONV
— Melonopoly (@curtmelonopoly) August 13, 2018
#Stocks – Harley Davidson Drops in Pre-market; Tesla Gains; Nielsen Soars –
#Stocks – Harley Davidson Drops in Pre-market; Tesla Gains; Nielsen Soars – https://t.co/ZK6jAWvk43
— Investing.com News (@newsinvesting) August 13, 2018
Market Observation:
Markets as of 8:08 AM: US Dollar $DXY trading 96.35, Oil FX $USOIL ($WTI) trading 67.39, Gold $GLD trading 1199.90, Silver $SLV trading 15.16, $SPY 283.16, Bitcoin $BTC.X $BTCUSD $XBTUSD 6453.00 and $VIX trading 14.1.
Momentum Stocks / GAPS to Watch: $ABIL $DBD $CLRB $CLDC
Nielsen is up 11.5% in pre-market trading after WSJ reported Elliott Management has taken an 8% stake in the company and wants it to sell itself. https://www.benzinga.com/news/18/08/12190488/26-stocks-moving-in-mondays-pre-market-session … $SSC $NLSN $IMMY $DY $SECO $RYB $TAL $STG $BEDU $REDU $ALNY
Nielsen is up 11.5% in pre-market trading after WSJ reported Elliott Management has taken an 8% stake in the company and wants it to sell itself. https://t.co/F4LUQCjTw8 $SSC $NLSN $IMMY $DY $SECO $RYB $TAL $STG $BEDU $REDU $ALNY
— Benzinga (@Benzinga) August 13, 2018
News:
OPEC lifted crude production in July https://bloom.bg/2B6AFjN
OPEC lifted crude production in July https://t.co/gLe2YH7LM2 pic.twitter.com/DRfSHnn202
— Bloomberg Markets (@markets) August 13, 2018
Saudi cuts oil output as OPEC points to 2019 surplus.
https://twitter.com/EPICtheAlgo/status/1028979288257818624
Recent SEC Filings / Insiders:
Satya Nadella unloads 30% of his Microsoft common stock in his biggest sale as CEO
$MSFT https://cnb.cx/2OvfBFB
Recent IPO’s:
Earnings:
Sysco’s stock rallies after earnings, revenue top expectations.
Dycom’s stock plunges after profit, sales warning.
#earnings for the week
$NVDA $JD $HD $AMAT $WMT $CSCO $JCP $M $YY $SYY $BZUN $DE $TSG $CGC $GWGH $SPCB $CRON $AAP $VIPS $JKS $NTAP $NINE $SWCH $CSIQ $HQCL $AG $BLRX $TPR $JWN $A $CREE $EAT $CNNE $ESES $ARRY $TGEN $CAE $GDS $ROSE $SNES $SORL $EAST $AVGR
#earnings for the week$NVDA $JD $HD $AMAT $WMT $CSCO $JCP $M $YY $SYY $BZUN $DE $TSG $CGC $GWGH $SPCB $CRON $AAP $VIPS $JKS $NTAP $NINE $SWCH $CSIQ $HQCL $AG $BLRX $TPR $JWN $A $CREE $EAT $CNNE $ESES $ARRY $TGEN $CAE $GDS $ROSE $SNES $SORL $EAST $AVGRhttps://t.co/r57QUKKDXL https://t.co/PfPzmWSmLy
— Melonopoly (@curtmelonopoly) August 12, 2018
Trade Set-up Alerts, Charts & Reports. Recent / Current Holds, Open and Closed Trades:
Please refer to the date at top left of each chart (charts are often carried forward for sometime).
$VIX on daily chart MACD crossing up. $TVIX $UVXY #volatility #VIX

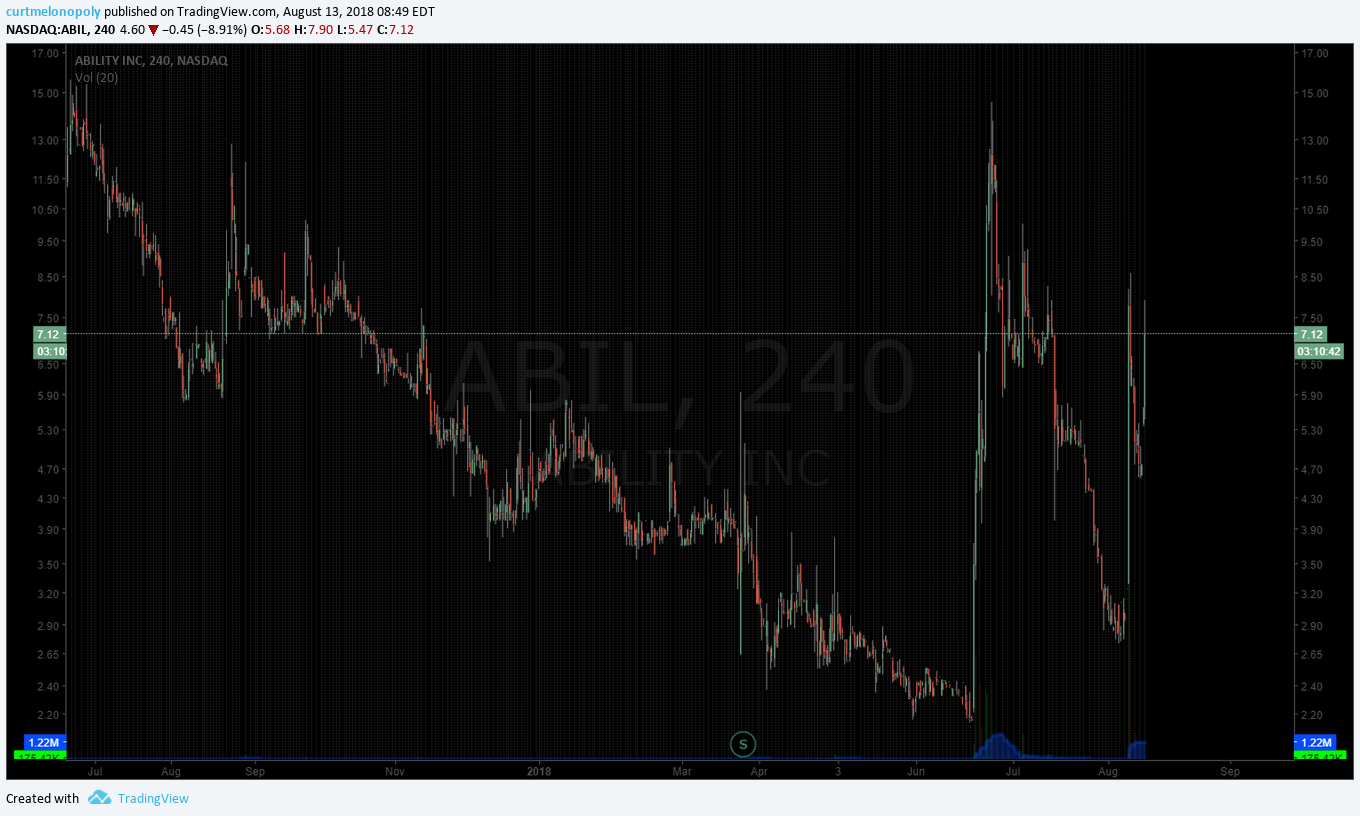
$ABIL premarket trading 7.27 up 58% #premarket #daytrading

Oil Daily Chart. MACD cross up failed, trade under 50 MA. Bearish trend continues. Aug 12 947 PM FX $USOIL $WTI $USO $UWT $DWT $CL_F #OIL #chart

Good start for a Friday. EPIC the Oil Algorithm – Recorded, time stamped, live alerts. FX $USOIL $WTI $CL_F $USO #oil #oiltradingalerts #algorithm #OOTT #Machinetrading
Good start for a Friday. EPIC the Oil Algorithm – Recorded, time stamped, live alerts. FX $USOIL $WTI $CL_F $USO #oil #oiltradingalerts #algorithm #OOTT #Machinetrading pic.twitter.com/RHWh9I0Pd4
— Melonopoly (@curtmelonopoly) August 10, 2018
Earning my keep with EPIC the Oil Algorithm – still on personal 100% win side for months, ask for a tour of recorded, time stamped, live alerts (a tech had two losses in that time). FX $USOIL $WTI $CL_F $USO #oil #oiltradingalerts #algorithm #OOTT #Machinetrading
Earning my keep with EPIC the Oil Algorithm – still on personal 100% win side for months, ask for a tour of recorded, time stamped, live alerts (a tech had two losses in that time). FX $USOIL $WTI $CL_F $USO #oil #oiltradingalerts #algorithm #OOTT #Machinetrading pic.twitter.com/mfmhip2r0r
— Melonopoly (@curtmelonopoly) August 9, 2018
PS Dollar trading HOD $DXY 95.47 and if 95,61 breached held it will rip some faces off.
PS Dollar trading HOD $DXY 95.47 and if 95,61 breached held it will rip some faces off.
— Melonopoly (@curtmelonopoly) August 9, 2018
One of our best swing trades of the year by far…. blew through our most bullish target today and then some and more and more some. $GTHX #swingtrading
One of our best swing trades of the year by far…. blew through our most bullish target today and then some and more and more some. $GTHX #swingtrading pic.twitter.com/Y9MBk0hE7F
— Melonopoly (@curtmelonopoly) August 9, 2018
ROKU (ROKU) hit the chart model resistance perfect and came off today $ROKU #daytrading

G1 THERAPEUTICS (GTHX) What a fantastic swing trade. Blew through our most bullish price target today. $GTHX #swingtrade #chart

SP500 (SPY) Chart continues trend with MACD flat on high side about to test previous highs. $SPY $ES_F $SPXL $SPXS

Gold on 50 percent retrace, MACD may cross up here. Aug 9 1243 AM #Gold $GLD $GC_F $XAUUSD $UGLD $DGLD #chart

It bounced and hasn’t looked back. #swingtrading $AAOI
It bounced and hasn't looked back. #swingtrading $AAOI https://t.co/vhSzw9TK58
— Melonopoly (@curtmelonopoly) August 8, 2018
$TSLA Swing target price hit. #swingtrading
$TSLA Swing target price hit. #swingtrading https://t.co/AoyhwOjYkz
— Melonopoly (@curtmelonopoly) August 8, 2018
The TESLA swing trading report from previous $TSLA #swingtrading #towin
The TESLA swing trading report from previous $TSLA #swingtrading #towin https://t.co/zXi67L3O60
— Melonopoly (@curtmelonopoly) August 8, 2018
FACEBOOK (FB) Closed 177.78 Friday with 181.80 trajectory price target Aug 8 then 195.00 Aug 27. $FB #swingtrade #chart

Health Innovations (HIIQ) ripped through the chart structure in a fantastic way. Careful above channel resistance. $HIIQ chart. #swingtrade

ALPHABET (GOOGL) Daytrading chart with lower time frame support and resistance levels for daytraders. $GOOGL #daytrading #chart

$BTC 8300’s to 6900’s…. always know where that 200MA is. #Bitcoin #premarket #crypto
$BTC 8300's to 6900's…. always know where that 200MA is. #Bitcoin #premarket #crypto pic.twitter.com/HneG44UaSs
— Melonopoly (@curtmelonopoly) August 6, 2018
US Dollar Index (DXY) Pinch in play for the dollar, expect a move near term. $DXY #Chart #USD #Algorithm
US Dollar Index (DXY) Pinch in play for the dollar, expect a move near term. $DXY #Chart #USD #Algorithm pic.twitter.com/mrwq8KDiNB
— $DXY US Dollar Algo (@dxyusd_index) August 3, 2018
Oil trade alert to start the week 68.61 long, 68.85 closed. Win rate high 90% – ask for a tour. Time stamped, recorded, live alerts. EPIC Oil Algorithm $USOIL $WTI $CL_F #OilTradeAlerts $UWT $DWT #OOTT
Market Outlook, Market News and Social Bits From Around the Internet:
Stock Futures Lower On Turkey, Lira; Elliott Stake Boosts Nielsen http://dlvr.it/QfkS8w
Stock Futures Lower On Turkey, Lira; Elliott Stake Boosts Nielsen https://t.co/QH9jxLhPOL pic.twitter.com/xerf0Bjkuq
— Investors.com (@IBDinvestors) August 13, 2018
#5things
-Lira rout continues
-Risk spreads beyond Turkey
-Saudis eye Tesla investment
-Markets drop
-Quiet data week
https://bloom.bg/2B87eOo
Despite the recent raw-material rally, hedge funds that trade commodities just keep closing down https://www.wsj.com/articles/how-the-last-commodity-funds-will-survive-the-algo-age-adapt-or-die-1529919003 … via @WSJ
https://twitter.com/EPICtheAlgo/status/1028697150639747075
If you are new to our trading service you should review recent blog posts, the Compound Trading YouTube Channel and at minimum our algorithm Twitter feeds because they do tell a story in terms of the market and how the inflections of the market determine our day to day trading. You will notice the algorithmic modelling has been undeniably accurate with many time-frames (intra-day, weeks and months out) so I myself have learned to respect the math (they have taken me from a 60% hit rate to 80%+ all publicly posted live trade alerts).
Momentum Stocks (Market Open and Intra-Day):
I do trade morning momo stocks, but I do avoid much of the day trading risk (preferring to daytrade only what is structurally set-up also on the swing trade side and to my advantage in the algorithmic model charting). I often avoid the first 30 minutes (gap and go) and trade momentum stocks or structured (per explanation in previous sentence) stocks later in day after a wash-out looking for a snap-back trade that can possibly also become a strong swing or longer term trade that I can leg in to. Just prior to open and shortly after open I post momentum stocks to the trade chat room (and Twitter and Stocktwits if I have time).
Some of my Favorite Intra-day Trading Set-Ups:
(1) Momentum Stock Wash-Outs for Snap Back, (2) Bad News Wash-outs on Stocks with High Institutional Ownership, (3) Getting on the Right Side of a Trend Change and scaling in my position and (4) Our Algorithm Charting Model Set-Ups.
The momentum stocks (from previous days and morning trade) I continue to watch through the day for indicators that allow a trade.
Morning Stock Watch-Lists for my Favorite Set-Ups:
(1) Pre-Market Gainers Watch-List: $ABIL $RSLS $XBIO $CLDC $NLSN $CLRB $DBD $MDGS $TLRY $SYY $FOLD $TVIX $DUST $YANG $CWH $NVFY
(2) Pre-market Decliners Watch-List :
(3) Other Watch-List:
(4) Regular Algo Charting Watch-List: Gold $GC_F $GLD, Miners $GDX ($NUGT, $DUST, $JDST, $JNUG), Silver $SLV $SI_F ($USLV, $DSLV), Crude Oil FX: $USOIL $WTI ($UWT, $DWT, $USO, $UCO, $CL_F, $UWT, $DWT), Natural Gas $NG_F ($UGAZ, $DGAZ), S & P 500 $SPY $ES_F ($SPXL, $SPXS), US Dollar Index $DXY ($UUP), Volatility $VIX ($TVIX, $UVXY), $BTCUSD Bitcoin.
(5) Recent Upgrades:
$CRNX Leerink Partners analyst Joseph Schwartz initiates coverage on Crinetics (NASDAQ: CRNX) with a Outperform rating and a price target of $43.00.
ADP $ADP PT Raised to $150 at Argus
FreightCar America $RAIL PT Raised to $19 at Buckingham Research
Endo International plc $ENDP PT Raised to $16 at BMO Capital
Domtar $UFS PT Raised to $52 at BMO Capital
Tecnoglass $TGLS PT Raised to $12.50 at B.Riley/FBR
(6) Recent Downgrades:
$NFLX PT Lowered to $494 at Imperial Capital on Lower Global Subscriber Estimates for FY18 & FY19
Intel target lowered to $49 at Cowen
Stay tuned in Stock Chat Room for more pre-market stocks on watch.
Study:
For new readers, a review of our unlocked posts on our blog would help you get in to the story we are following with the securities listed in this newsletter.
Free scanners to find momentum stocks that you can easily review charts of for indicators that bring probability of your trade being successful up considerably. These are not useful for first 30 minute market open gap and go type plays (you need a good momentum scanner, level 2, and best to have hot-keys for the first 30 mins of gap and go trading)… but are very useful for intra day scalping and swing trading (start with trending stocks and then look at indicators intra for simple set-ups – study scan study scan study scan).
http://finviz.com/
https://finance.yahoo.com/screener/predefined/ec5bebb9-b7b2-4474-9e5c-3e258b61cbe6
http://www.highshortinterest.com/
http://www.gurufocus.com/short-stocks.php
http://www.3xetf.com/all/
http://www.etf.com/channels/gold-etfs
GL!
Curtis
Algorithm Twitter feeds can be found here: $BTC (@CryptotheAlgo) $WTI (@EPICtheAlgo), $VIX (@VexatiousVIX), $SPY (@FREEDOMtheAlgo), $GLD (@ROSIEtheAlgo), $SLV (@SuperNovaAlgo), $DXY (@DXYUSD_Index). Our Swing Trading Twitter feed is found here: https://twitter.com/swingtrading_ct. Our lead trader Twitter feed is here @curtmelonopoly
Article Topics: Premarket, Watchlist, Stocks, Trading, Plan, Turkey Lira, Elliott Stake Boosts Nielsen, $TSLA, $HOG, $NLSN, $WMT, $ABIL, $DBD, $RSLS, $XBIO, $VIX
Volatility (VIX) Algorithm Report Thurs July 12 $VIX $TVIX, $UVXY, $VXX
Volatility (VIX) Algorithm Chart Model Observations & Report Thursday July 12, 2018 $VIX, $TVIX, $UVXY, $VXX
Good day. My name is Vexatious $VIX the Algorithm. Welcome to my new $VIX algorithmic model charting report for Compound Trading Group.
Volatility (VIX) Charting / Observations:
Buy sell swing trading triggers for $VIX:
23.2
22.4
21.6
20.8
20.1
19.3
18.5
17.7
16.9
16.1
15.3
14.5
13.7
12.9
12.1
11.4
10.6
9.8
9.0
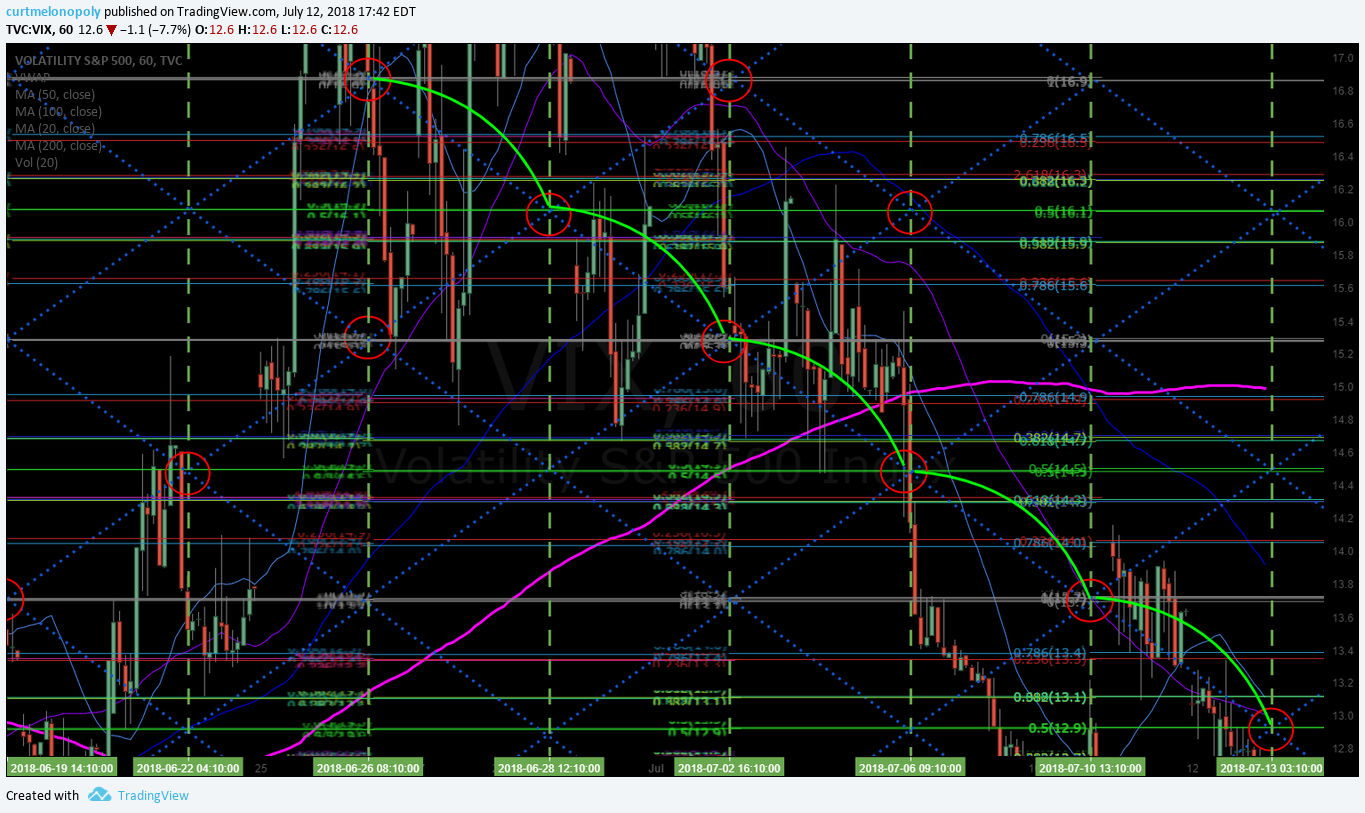
July 12 – Volatility S&P 500 Index (VIX) Structured symmetry on 60 min last time cycle has been awesome. $VIX #volatility $TVIX $UVXY

JUly 12 – Volatility S&P 500 Index (VIX) Continued down channel symmetry scenario – watch for time cycle completion however. $VIX #volatility $TVIX $UVXY

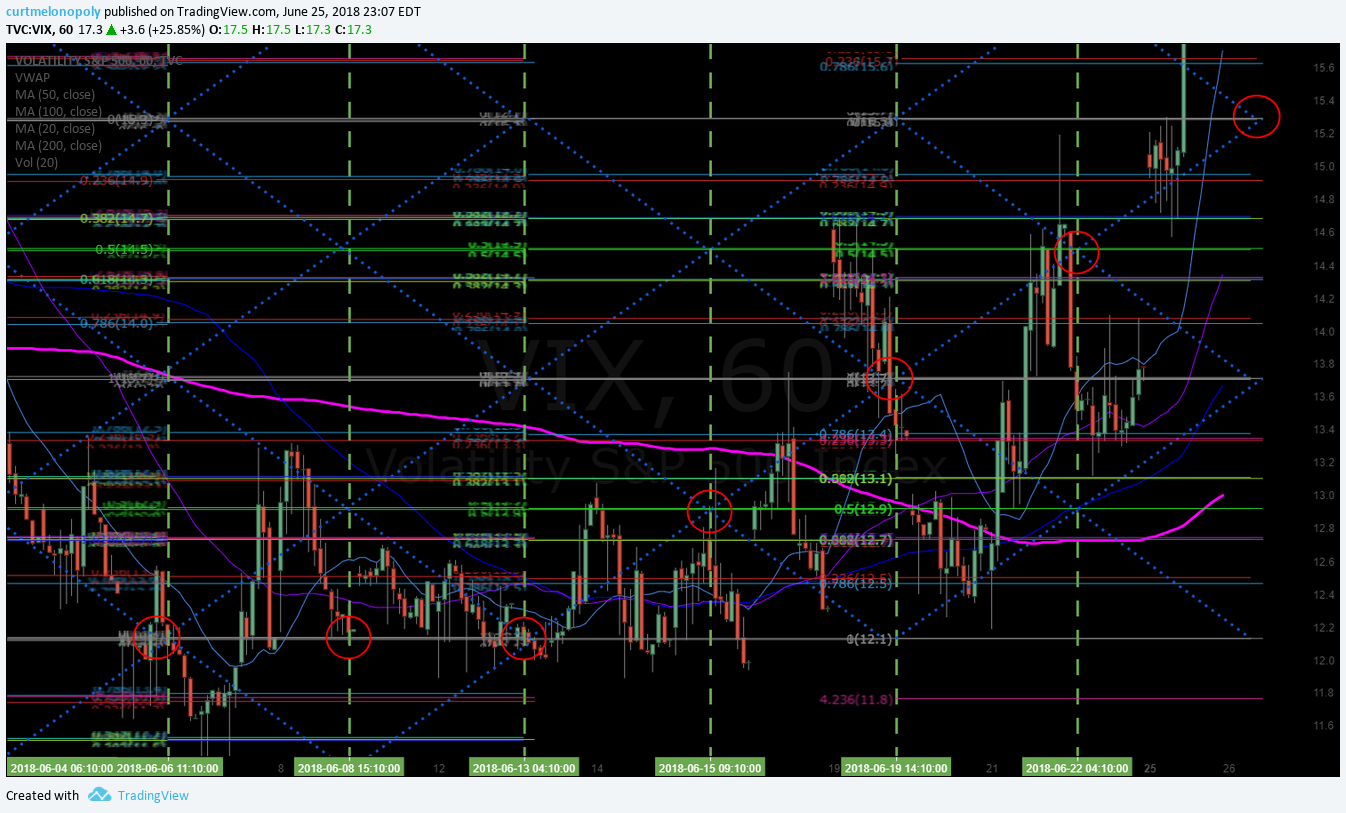
Volatility S&P 500 Index (VIX) Structured take-off on 60 minute model in to time-cycle peak. June 25 1108 PM $VIX #volatility $TVIX $UVXY

Volatility Index (VIX) Charting. Conventional Technical Observations.
Volatility S&P 500 Index (VIX) Within Bollinger bands under 200 MA. MACD down. July 12 728 PM $VIX #volatility $TVIX $UVXY

Volatility S&P 500 Index (VIX) Above bollinger bands on daily but use caution shorting. MACD up also. June 25 1136 PM $VIX #volatility $TVIX $UVXY

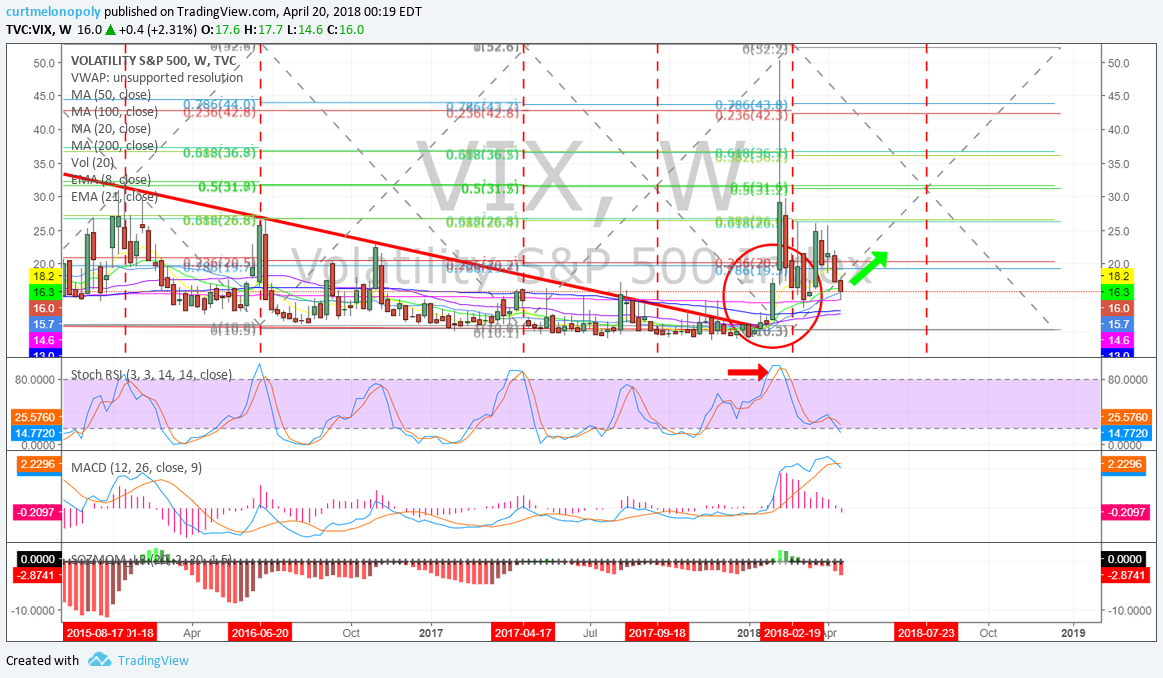
$VIX Weekly Chart
Volatility Index (VIX). Nearing completion of time cycle, watch for a possible reversal. 735 PM July 12 $VIX #chart #timecycle

Volatility Index (VIX). Weekly chart moving in to next time cycle peak with VIX spiking. $VIX #chart #symmetry

Per recent;
Volatility Index (VIX). Weekly chart suggests mid July time cycle peak could bring long side RR advantage soon. 216 AM June 5 $VIX #chart #symmetry https://www.tradingview.com/chart/VIX/zS0lmIbC-Volatility-Index-VIX-Weekly-chart-suggests-mid-July-time-cycl/

Per recent;
Simple symmetrical time cycle on weekly, Volatility reversal leading in to July 14 – 23 ish probable. $VIX $UVXY $TVIX

Simple symmetrical time cycle on weekly chart, Volatility reversal leading in to July 23 ish is probable. $VIX $UVXY $TVIX #volatility #trading

Per recent;
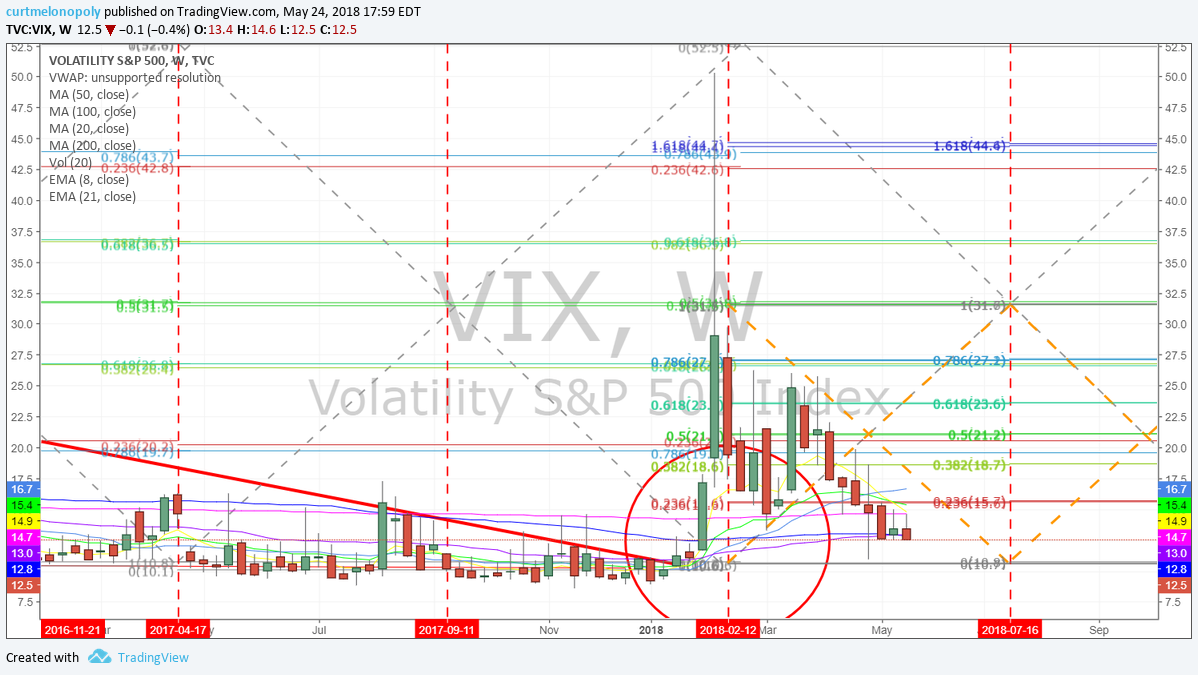
$VIX weekly chart has MACD trending down and structure broke.

Per recent;
$VIX structure on the last bullish move is now all but gone. Likely continued decline.

Volatility News:
Wall Street’s ‘fear index’ jumps as stocks slide, could see biggest one-day move in 4 months.
https://twitter.com/CompoundTrading/status/1011453669160648704
Fear index VIX jumps by 26% on trade worries w/ S&P 500 fell most since Apr.
Fear index VIX jumps by 26% on trade worries w/ S&P 500 fell most since Apr. pic.twitter.com/gFQH3se5an
— Holger Zschaepitz (@Schuldensuehner) June 25, 2018
Good luck with your trades and look forward to seeing you in the room!
Vexatious the $VIX Algorithm
Article Topics: Vexatious, VIX, Algorithm, Volatility, Chart, Trading, $TVIX, $UVXY, $VXX
Volatility (VIX) Algorithm Report Tues June 26 – Fear index VIX jumps by 26% $VIX $TVIX, $UVXY, $VXX
Volatility (VIX) Algorithm Chart Model Observations & Report Tuesday June 26, 2018 $VIX, $TVIX, $UVXY, $VXX
Good day. My name is Vexatious $VIX the Algorithm. Welcome to my new $VIX algorithmic model charting report for Compound Trading Group.
Volatility (VIX) Charting / Observations:
Buy sell swing trading triggers for $VIX:
23.2
22.4
21.6
20.8
20.1
19.3
18.5
17.7
16.9
16.1
15.3
14.5
13.7
12.9
12.1
11.4
10.6
9.8
9.0
Volatility S&P 500 Index (VIX) Structured take-off on 60 minute model in to time-cycle peak. June 25 1108 PM $VIX #volatility $TVIX $UVXY

Per recent;
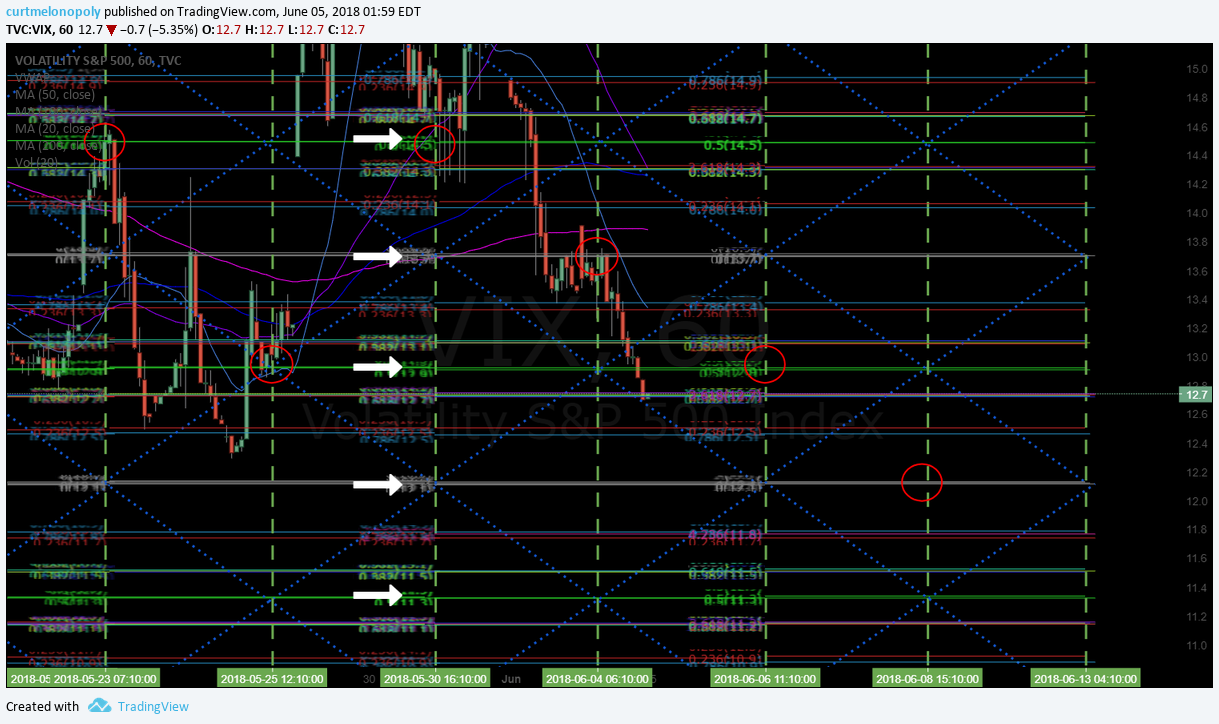
Volatility Index (VIX). Chart – 60 min trading quads w buy sell triggers. 200 AM June 5, 18 $VIX $TVIX $UVXY #VIX #Chart #Algorithm

Per recent;
$VIX 60 min quads with buy sell triggers. . $TVIX $UVXY May 24 513 PM
Volatility Index (VIX) Charting. Conventional Technical Observations.
Volatility S&P 500 Index (VIX) Above bollinger bands on daily but use caution shorting. MACD up also. June 25 1136 PM $VIX #volatility $TVIX $UVXY

Per recent;
Volatility Index (VIX). Daily chart trade has MACD crossed up and calm and between Bollinger Bands. 210 AM June 5 $VIX

Per recent;
$VIX MACD on daily chart flat – limited short side opportunity left. Bottom range of Bollinger.

$VIX Weekly Chart
Volatility Index (VIX). Weekly chart moving in to next time cycle peak with VIX spiking. $VIX #chart #symmetry

Per recent;
Volatility Index (VIX). Weekly chart suggests mid July time cycle peak could bring long side RR advantage soon. 216 AM June 5 $VIX #chart #symmetry https://www.tradingview.com/chart/VIX/zS0lmIbC-Volatility-Index-VIX-Weekly-chart-suggests-mid-July-time-cycl/

Per recent;
Simple symmetrical time cycle on weekly, Volatility reversal leading in to July 14 – 23 ish probable. $VIX $UVXY $TVIX

Simple symmetrical time cycle on weekly chart, Volatility reversal leading in to July 23 ish is probable. $VIX $UVXY $TVIX #volatility #trading

Per recent;
$VIX weekly chart has MACD trending down and structure broke.

Per recent;
$VIX structure on the last bullish move is now all but gone. Likely continued decline.

Volatility News:
Wall Street’s ‘fear index’ jumps as stocks slide, could see biggest one-day move in 4 months.
https://twitter.com/CompoundTrading/status/1011453669160648704
Fear index VIX jumps by 26% on trade worries w/ S&P 500 fell most since Apr.
Fear index VIX jumps by 26% on trade worries w/ S&P 500 fell most since Apr. pic.twitter.com/gFQH3se5an
— Holger Zschaepitz (@Schuldensuehner) June 25, 2018
Good luck with your trades and look forward to seeing you in the room!
Vexatious the $VIX Algorithm
Article Topics: Vexatious, VIX, Algorithm, Volatility, Chart, Trading, $TVIX, $UVXY, $VXX
Volatility (VIX) Algorithm Report Tues June 5 $VIX $TVIX, $UVXY, $VXX
Volatility (VIX) Algorithm Chart Model Observations & Report Tuesday June 5, 2018 $VIX, $TVIX, $UVXY, $VXX
Good day! My name is Vexatious $VIX the Algorithm. Welcome to my new $VIX algorithmic model charting report for Compound Trading Group.
Volatility (VIX) Charting / Observations:
Buy sell swing trading triggers for $VIX:
23.2
22.4
21.6
20.8
20.1
19.3
18.5
17.7
16.9
16.1
15.3
14.5
13.7
12.9
12.1
11.4
10.6
9.8
9.0
Volatility Index (VIX). Chart – 60 min trading quads w buy sell triggers. 200 AM June 5, 18 $VIX $TVIX $UVXY #VIX #Chart #Algorithm

Per recent;
$VIX 60 min quads with buy sell triggers. . $TVIX $UVXY May 24 513 PM

Volatility Index (VIX) Charting. Conventional Technical Observations.
Volatility Index (VIX). Daily chart trade has MACD crossed up and calm and between Bollinger Bands. 210 AM June 5 $VIX

Per recent;
$VIX MACD on daily chart flat – limited short side opportunity left. Bottom range of Bollinger.

Per recent;
$VIX under moving averages on Daily Chart and under lower bollinger. Long bias RR setting in.

$VIX Weekly Chart
Volatility Index (VIX). Weekly chart suggests mid July time cycle peak could bring long side RR advantage soon. 216 AM June 5 $VIX #chart #symmetry https://www.tradingview.com/chart/VIX/zS0lmIbC-Volatility-Index-VIX-Weekly-chart-suggests-mid-July-time-cycl/

Per recent;
Simple symmetrical time cycle on weekly, Volatility reversal leading in to July 14 – 23 ish probable. $VIX $UVXY $TVIX

Simple symmetrical time cycle on weekly chart, Volatility reversal leading in to July 23 ish is probable. $VIX $UVXY $TVIX #volatility #trading

Per recent;
$VIX weekly chart has MACD trending down and structure broke.

Per recent;
$VIX structure on the last bullish move is now all but gone. Likely continued decline.

Per recent;
$VIX losing structure for bull move. MACD about to cross down.

Per previous;
$VIX Weekly chart structure in place yet but MACD nearing top. #volatility #chart

Good luck with your trades and look forward to seeing you in the room!
Vexatious the $VIX Algo
Article Topics: Vexatious, VIX, Algorithm, Volatility, Chart, Trading, $TVIX, $UVXY, $VXX
Volatility $VIX Chart Models Thurs May 24 $TVIX, $UVXY, $VXX
Volatility $VIX Charting / Algorithm Observations Report Thursday May 24, 2018 $TVIX, $UVXY, $VXX
Good day! My name is Vexatious $VIX the Algo. Welcome to my new $VIX algorithmic modeling charting trade report for Compound Trading.
Volatility Charting Observations:
$VIX 60 min quads with buy sell triggers. . $TVIX $UVXY May 24 513 PM

Buy sell swing trading triggers for $VIX:
23.2
22.4
21.6
20.8
20.1
19.3
18.5
17.7
16.9
16.1
15.3
14.5
13.7
12.9
12.1
11.4
10.6
9.8
9.0
Per recent’
$VIX 60 min quads with buy sell triggers. . $TVIX $UVXY Apr 30 332 AM

$VIX Volatility Index Conventional Charting
$VIX MACD on daily chart flat – limited short side opportunity left. Bottom range of Bollinger.
https://www.tradingview.com/chart/VIX/YxKSP12r-VIX-MACD-on-daily-chart-flat-limited-short-side-opportunity-l/

Per recent;
$VIX under moving averages on Daily Chart and under lower bollinger. Long bias RR setting in.

$VIX trading above 200 MA on trend with MACD completely flat and absent.

$VIX Weekly Chart
Simple symmetrical time cycle on weekly, Volatility reversal leading in to July 14 – 23 ish probable. $VIX $UVXY $TVIX

Simple symmetrical time cycle on weekly chart, Volatility reversal leading in to July 23 ish is probable. $VIX $UVXY $TVIX #volatility #trading

Per recent;
$VIX weekly chart has MACD trending down and structure broke.

Per recent;
$VIX structure on the last bullish move is now all but gone. Likely continued decline.

Per recent;
$VIX losing structure for bull move. MACD about to cross down.

Per previous;
$VIX Weekly chart structure in place yet but MACD nearing top. #volatility #chart

Per recent;
$VIX Weekly chart model provides bullish outlook also.
https://www.tradingview.com/chart/VIX/CbShhY1p-VIX-Weekly-chart-model-provides-bullish-outlook-also/

Good luck with your trades and look forward to seeing you in the room!
Vexatious the $VIX Algo
Article Topics: Vexatious, $VIX, Algo, Volatility, Stocks, Trading, Algorithms, $TVIX, $UVXY, $VXX
Volatility $VIX Chart Models Mon May 14 $TVIX, $UVXY, $VXX
Volatility $VIX Charting / Algorithm Observations Report Monday May 14, 2018 $TVIX, $UVXY, $VXX
Good day! My name is Vexatious $VIX the Algo. Welcome to my new $VIX algorithmic modeling charting trade report for Compound Trading.
Volatility Charting Observations:
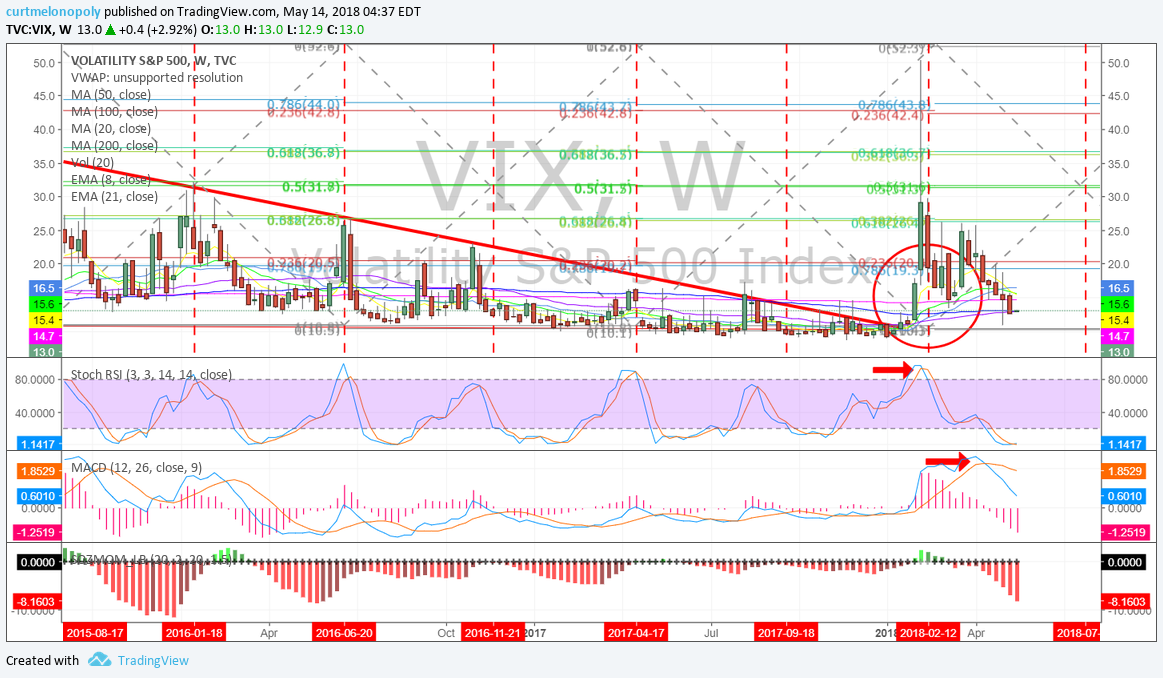
$VIX 60 min quads with buy sell triggers. . $TVIX $UVXY May 14 427 AM

Per recent’
$VIX 60 min quads with buy sell triggers. . $TVIX $UVXY Apr 30 332 AM

Per recent;
$VIX 60 min quads with buy sell triggers. VIX struggling with 16.9 main resistance. $TVIX $UVXY Apr 24 233 AM

Buy sell swing trading triggers for $VIX:
23.2
22.4
21.6
20.8
20.1
19.3
18.5
17.7
16.9
16.1
15.3
14.5
13.7
12.9
12.1
11.4
10.6
9.8
9.0
$VIX Volatility Index Conventional Charting
$VIX under moving averages on Daily Chart and under lower bollinger. Long bias RR setting in.

$VIX trading above 200 MA on trend with MACD completely flat and absent.

Per recent;
$VIX Daily MACD still trending down, getting close to bottom. Riding 100 MA. Price near bottom bollinger.

$VIX Weekly Chart
Simple symmetrical time cycle on weekly chart, Volatility reversal leading in to July 23 ish is probable. $VIX $UVXY $TVIX #volatility #trading

Per recent;
$VIX weekly chart has MACD trending down and structure broke.

Per recent;
$VIX structure on the last bullish move is now all but gone. Likely continued decline.

Per recent;
$VIX losing structure for bull move. MACD about to cross down.

Per previous;
$VIX Weekly chart structure in place yet but MACD nearing top. #volatility #chart

Per recent;
$VIX Weekly chart model provides bullish outlook also.
https://www.tradingview.com/chart/VIX/CbShhY1p-VIX-Weekly-chart-model-provides-bullish-outlook-also/

Good luck with your trades and look forward to seeing you in the room!
Vexatious the $VIX Algo
Article Topics: Vexatious, $VIX, Algo, Volatility, Stocks, Trading, Algorithms, $TVIX, $UVXY, $VXX
Volatility $VIX Chart Models Mon Apr 30 $TVIX, $UVXY, $VXX
Volatility $VIX Charting / Algorithm Observations Report Monday April 30, 2018 $TVIX, $UVXY, $VXX
Good day! My name is Vexatious $VIX the Algo. Welcome to my new $VIX algorithmic modeling charting trade report for Compound Trading.
Volatility Charting Observations:
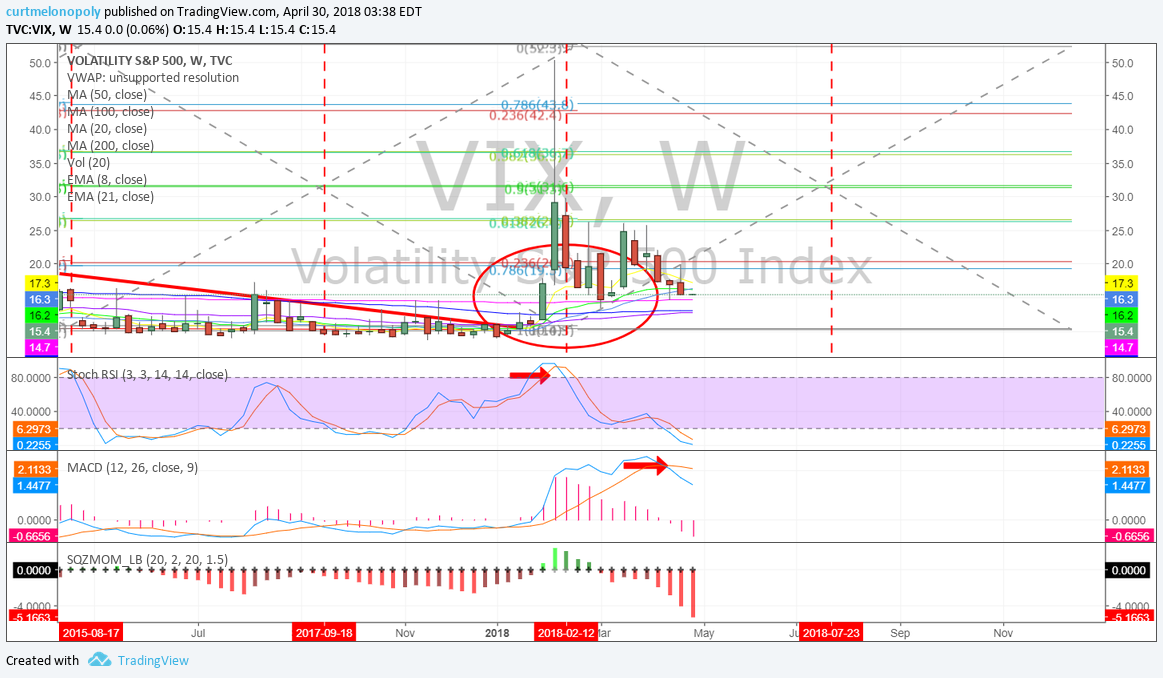
$VIX 60 min quads with buy sell triggers. . $TVIX $UVXY Apr 30 332 AM

Per recent;
$VIX 60 min quads with buy sell triggers. VIX struggling with 16.9 main resistance. $TVIX $UVXY Apr 24 233 AM

Per recent;
$VIX 60 min quads with buy sell triggers. $TVIX $UVXY Apr 20 1205 AM

Buy sell swing trading triggers for $VIX:
23.2
22.4
21.6
20.8
20.1
19.3
18.5
17.7
16.9
16.1
15.3
14.5
13.7
12.9
12.1
11.4
10.6
9.8
9.0
$VIX Volatility Index Conventional Charting
$VIX trading above 200 MA on trend with MACD completely flat and absent.

Per recent;
$VIX Daily MACD still trending down, getting close to bottom. Riding 100 MA. Price near bottom bollinger.

Per recent;
$VIX Daily MACD still trending down (bearish). Price near bottom Bollinger band.

$VIX Weekly Chart
$VIX weekly chart has MACD trending down and structure broke.

Per recent;
$VIX structure on the last bullish move is now all but gone. Likely continued decline.

Per recent;
$VIX losing structure for bull move. MACD about to cross down.

Per previous;
$VIX Weekly chart structure in place yet but MACD nearing top. #volatility #chart

Per recent;
$VIX Weekly chart model provides bullish outlook also.
https://www.tradingview.com/chart/VIX/CbShhY1p-VIX-Weekly-chart-model-provides-bullish-outlook-also/

$VIX Look at that Stochastic RSI and MACD is stil trending and quad wall TL but SQZMOM says it all #Crooks #Castles #Aholes $XIV $TVIX $UVXY

$VIX price hit weekly quad support Stochastic RSI trend down still but look for possible bounce. $TVIX $UVXY #volatility

Per recent;
$VIX Weekly Stochastic RSI trending down consistently now.

Good luck with your trades and look forward to seeing you in the room!
Vexatious the $VIX Algo
Article Topics: Vexatious, $VIX, Algo, Volatility, Stocks, Trading, Algorithms, $TVIX, $UVXY, $VXX
Volatility $VIX Chart Models Tues Apr 24 $TVIX, $UVXY, $VXX
Volatility $VIX Charting / Algorithm Observations Report Tuesday April 24, 2018 $TVIX, $UVXY, $VXX
Good day! My name is Vexatious $VIX the Algo. Welcome to my new $VIX algorithmic modeling charting trade report for Compound Trading.
Volatility Charting Observations:
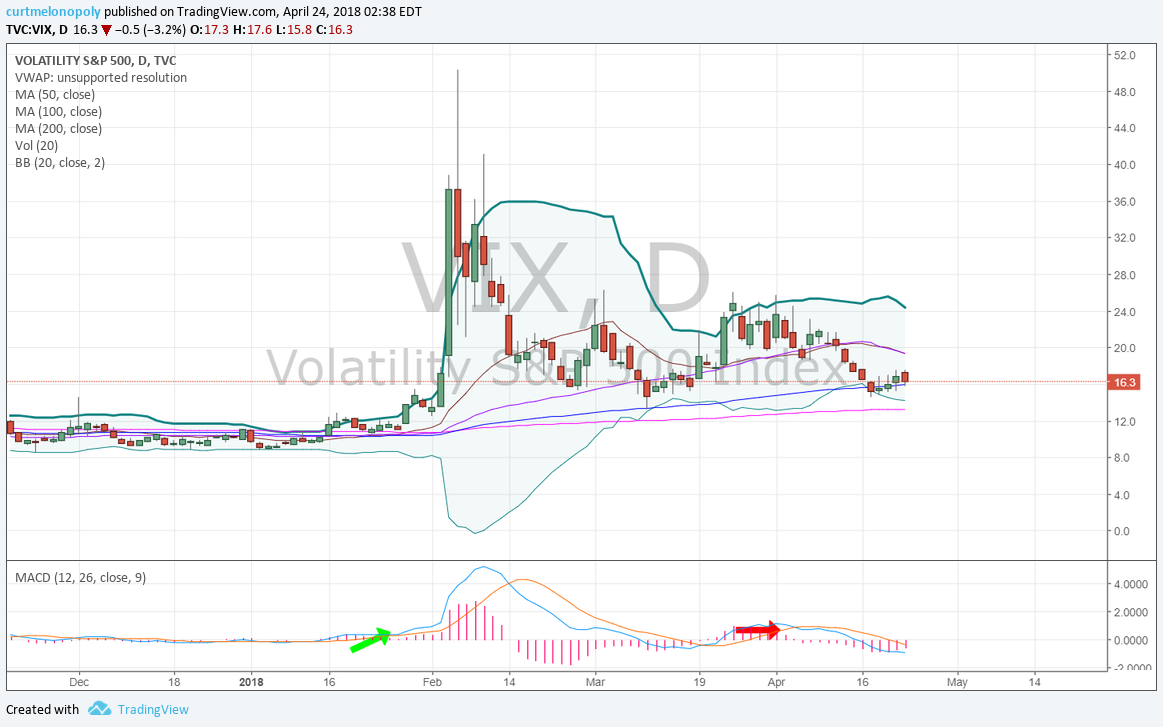
$VIX 60 min quads with buy sell triggers. VIX struggling with 16.9 main resistance. $TVIX $UVXY Apr 24 233 AM

Per recent;
$VIX 60 min quads with buy sell triggers. $TVIX $UVXY Apr 20 1205 AM

Per recent;
$VIX 60 min quads with buy sell triggers. $TVIX $UVXY Apr 9 401 AM

Buy sell swing trading triggers for $VIX:
23.2
22.4
21.6
20.8
20.1
19.3
18.5
17.7
16.9
16.1
15.3
14.5
13.7
12.9
12.1
11.4
10.6
9.8
9.0
$VIX Volatility Index Conventional Charting
$VIX Daily MACD still trending down, getting close to bottom. Riding 100 MA. Price near bottom bollinger.

Per recent;
$VIX Daily MACD still trending down (bearish). Price near bottom Bollinger band.

Per recent;
$VIX mid range in BB over 50 MA MACD moderate. Indecisive.

$VIX Weekly Chart
$VIX structure on the last bullish move is now all but gone. Likely continued decline.

Per recent;
$VIX losing structure for bull move. MACD about to cross down.

Per previous;
$VIX Weekly chart structure in place yet but MACD nearing top. #volatility #chart

Per recent;
$VIX Weekly chart model provides bullish outlook also.
https://www.tradingview.com/chart/VIX/CbShhY1p-VIX-Weekly-chart-model-provides-bullish-outlook-also/

$VIX Look at that Stochastic RSI and MACD is stil trending and quad wall TL but SQZMOM says it all #Crooks #Castles #Aholes $XIV $TVIX $UVXY

$VIX price hit weekly quad support Stochastic RSI trend down still but look for possible bounce. $TVIX $UVXY #volatility

Per recent;
$VIX Weekly Stochastic RSI trending down consistently now.

Per recent;
$VIX weekly I see Stoch RSI too high, divergent spike (too early) & next spike mid late July $XIV $TVIX $UVXY $SVXY $VXX You can’t hide anomalies. Everything has a nature. Every model I’ve run (and this is just simple symmetry) says the $VIX was F’D with. But I’ll watch for now.
$VIX weekly I see a Stoch RSI too high, divergent spike (too early) and next spike mid to late July $XIV $TVIX $UVXY

Good luck with your trades and look forward to seeing you in the room!
Vexatious the $VIX Algo
Article Topics: Vexatious, $VIX, Algo, Volatility, Stocks, Trading, Algorithms, $TVIX, $UVXY, $VXX
Volatility $VIX Chart Models Fri Apr 20 $TVIX, $UVXY, $VXX
Volatility $VIX Charting / Algorithm Observations Report Friday April 20, 2018 $TVIX, $UVXY, $VXX
Good morning! My name is Vexatious $VIX the Algo. Welcome to my new $VIX algorithmic modeling charting trade report for Compound Trading.
Volatility Charting Observations:
$VIX 60 min quads with buy sell triggers. $TVIX $UVXY Apr 20 1205 AM

Per recent;
$VIX 60 min quads with buy sell triggers. $TVIX $UVXY Apr 9 401 AM

Per recent;
$VIX 60 min quads with buy sell triggers. $TVIX $UVXY Mar 26 1020 PM

Real – time $VIX charting link:
Buy sell swing trading triggers for $VIX:
23.2
22.4
21.6
20.8
20.1
19.3
18.5
17.7
16.9
16.1
15.3
14.5
13.7
12.9
12.1
11.4
10.6
9.8
9.0
$VIX Volatility Index Conventional Charting
$VIX Daily MACD still trending down (bearish). Price near bottom Bollinger band.

Per recent;
$VIX mid range in BB over 50 MA MACD moderate. Indecisive.

$VIX Bollinger inside and MACD up. Bullish yet.

Per recent;
$VIX over Bollinger excellent short side risk if… chart notes. – $VIX chart
$VIX over Bollinger excellent short side risk if… chart notes. – $VIX chart https://t.co/t9M5WzNgT7
— Melonopoly (@curtmelonopoly) March 19, 2018
$VIX Weekly Chart
$VIX losing structure for bull move. MACD about to cross down.

Per previous;
$VIX Weekly chart structure in place yet but MACD nearing top. #volatility #chart

Per recent;
$VIX Weekly chart model provides bullish outlook also.
https://www.tradingview.com/chart/VIX/CbShhY1p-VIX-Weekly-chart-model-provides-bullish-outlook-also/

$VIX Look at that Stochastic RSI and MACD is stil trending and quad wall TL but SQZMOM says it all #Crooks #Castles #Aholes $XIV $TVIX $UVXY

$VIX price hit weekly quad support Stochastic RSI trend down still but look for possible bounce. $TVIX $UVXY #volatility

Per recent;
$VIX Weekly Stochastic RSI trending down consistently now.

Per recent;
$VIX weekly I see Stoch RSI too high, divergent spike (too early) & next spike mid late July $XIV $TVIX $UVXY $SVXY $VXX You can’t hide anomalies. Everything has a nature. Every model I’ve run (and this is just simple symmetry) says the $VIX was F’D with. But I’ll watch for now.
$VIX weekly I see a Stoch RSI too high, divergent spike (too early) and next spike mid to late July $XIV $TVIX $UVXY

Per previous;
$VIX Weekly chart. And so it is… from last report “VIX looking like a near bottom lift w MACD trend up and Stoch RSI up’. #volatitily #chart https://www.tradingview.com/chart/VIX/9sQyBtFP-VIX-Weekly-chart-And-so-it-is-from-last-report-VIX-lookin/

$VIX Weekly chart looking like a near bottom lift w MACD trend up and Stoch RSI up. #volatility #chart

Good luck with your trades and look forward to seeing you in the room!
Vexatious the $VIX Algo
Article Topics: Vexatious, $VIX, Algo, Volatility, Stocks, Trading, Algorithms, $TVIX, $UVXY, $XIV, $VXX
