Tag: $GOLD $GLD
PreMarket Trading Plan Wed Apr 18: $DCAR, $CALA, EIA, OIL, $WTI, $USOIL, GOLD $GLD, Crypto, $BTC, $SPY, $NFLX more.
Compound Trading Chat Room Stock Trading Plan and Watch List Wednesday April 18, 2018: $DCAR, $CALA, EIA, OIL, $WTI, $USOIL, GOLD $GLD, Crypto, $BTC, $SPY, $NFLX – SP500, $SPY, $BTC, Bitcoin, Gold, $GLD, $GDX, OIL, $WTI, $USOIL, Volatility, $VIX , Silver, $SLV, US Dollar Index, $DXY … more.
Welcome to the morning Wall Street trading day session at Compound Trading!
Notices:
April Sale On Now! 10 Promo Codes Per Select Items Only! Ends Apr 30 or if Promo Code limit for a specific item has been reached (10). If there is no sale price beside item listed it is sold out. Click here for available Promo Codes. https://compoundtrading.com/overview-features/ … #trading #stockmarket
April Sale On Now! 10 Promo Codes Per Select Items Only! Ends Apr 30 or if Promo Code limit for a specific item has been reached (10). If there is no sale price beside item listed it is sold out. Click here for available Promo Codes. https://t.co/TFgZFPzOBt #trading #stockmarket
— Melonopoly (@curtmelonopoly) April 16, 2018
Details to our next Trading Boot Camp in May! We’re over 70% booked so don’t wait. 30% off on this session! And what a location! #tradecoaching #learntotrade
https://twitter.com/CompoundTrading/status/982706326454358017
Notes in red text below are new comments entered specifically today (or recently important).
Live Trading Room Link:
http://compoundtrading1.clickmeeting.com/livetrading
Real-time Alerts for Oil, Gold, Swing Trading, Day Trading, Bitcoin are now available by following specific alert Twitter feeds.
Disclaimer / disclosure: Every subscriber must read this disclaimer.
Reporting and Next Gen Algorithms:
BE SURE to get in to each private Discord server specific to your subscription as many of the updates as we go forward will be posted in there. This includes the SWING TRADING platform also.
IF YOU NEED A LINK / INVITE email or DM us!
Connect with us on Discord.
https://twitter.com/CompoundTrading/status/880670140454637569
Recent Blog / Video / Social Posts:
#BitcoinTrading 101: A Beginner’s Guide to Getting Started $BTCUSD $XBTUSD $BTC https://compoundtrading.com/bitcointrading-101-beginners-guide-getting-started-btcusd-xbtusd-btc/ …
https://twitter.com/CompoundTrading/status/927397024315662336
How to Use EPIC Oil Algorithm: $USOIL, $WTI, $CL_F, $USO, $UCO, $SCO, $UWT, $DWT, #OIL, #OOTT: http://youtu.be/hawVV31G9bg?a via @YouTube
https://twitter.com/CompoundTrading/status/889148655785177088
How to Use ROSIE Gold Algorithm: #GOLD, $GLD, $XAUUSD, $GDX, $GDXJ, $NUGT, $DUST, $JNUG, $JDST
https://twitter.com/CompoundTrading/status/889147527278333952
Recent Chart / Trade Set-Ups:
See You Tube for other recent video posts.
$FB Facebook Long Set-Up Testing Buy Sell Trigger
Twitter Trading Plan $TWTR (Part two)
Twitter Trading Plan $TWTR (Part two)
#SwingTrading Midday Review – Compound Trading: $LTBR, $ANF, $MOMO, $APTO, $USOIL, $WTI, $BA, $NFLX
No Crystal Ball? Watch this… EPIC Oil Algorithm #EIA $USOIL $WTI #OIL $USO $CL_F #OOTT #Algo
#SwingTrading Midday Review: $NFLX $BTCUSD $SPY $VCEL $COT $DXY #GOLD $GLD $SLV $USOIL $WTI
Recent Educational Videos:
Want to learn how to trade stocks for consistent profit? Raw trading footage video library. https://www.youtube.com/channel/UCxmgJ3CfWHRBFFMpoHumZ8w … … #freedomtraders
Visit the Trading Educational and Analysis Play List at this Link on our YouTube Channel
Trading Plan (Buy, Hold, Sell) Watch Lists. Morning Momentum / Gap / News / PR / IPO / SEC Filings / Earnings Stocks on Watch:
Stocks making the biggest moves premarket: $MS, $TXT, $IBM, $UAL, $CSX, $LUV, $AMZN & more –
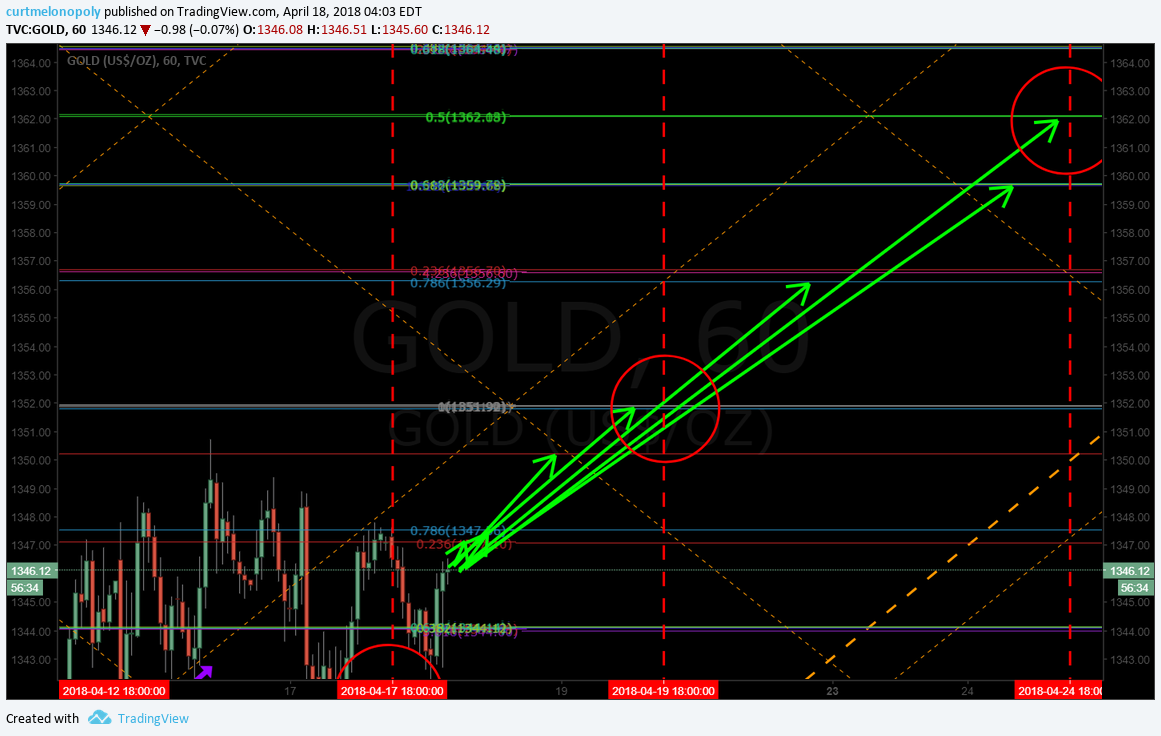
Time to look at metals and crypto very closely… in prep for a short term retrace in our broad market bull move inflection that should peak soon and retrace for a rest. Crypto up or down has high ROE ROI #commodities #crypto #trading #algorithm #models $STUDY
Well that worked well… very profitable – after chart review I am bias some retrace is soon, I am short term trimming all positions here. We had over twenty long side alerted positions in this move. 100% winners. Timestamped. $STUDY #boomtown #premarket #trading #stockmarket https://t.co/HGHmFnnXsN
— Melonopoly (@curtmelonopoly) April 18, 2018
Market Observation:
As of 7:45 AM: US Dollar $DXY trading 89.52, Oil FX $USOIL ($WTI) trading 67.43, Gold $GLD trading 1350.31, Silver $SLV trading 16.98, $SPY trading 270.19, Bitcoin $BTC.X $BTCUSD $XBTUSD trading 8100.00 , and $VIX trading 15.1.
Recent Momentum Stocks to Watch:
News:
$DCAR DropCar Reports Q1 B2B automotive volumes rose 163% year over year.
$MDGS Medigus and HC Marbella International Hospital Announce First MUSE™ Procedure for GERD Treatment in Spain
$RIGL FDA approves Tavalisse.
$CYTR CytRx Presents Statistically Significant Breakthrough Data for Its Albumin Binding Ultra High Potency LADR™ Drug Candidates at the American Association for Cancer Research 2018 Annual Meeting
$IDXG: Interpace Diagnostics Enters Agreement with One of the Largest, Integrated Health Systems in the US
Recent SEC Filings:
Recent IPO’s:
Earnings:
#earnings scheduled for the week
$NFLX $BAC $GE $LRCX $GS $UNH $IBM $JNJ $CLF $MTB $ABT $MS $ISRG $PGR $CMA $PG $AA $BX $AXP $ASML $MLNX $HON $UAL $FRED $NUE $SLB $PIR$DGX $URI $GSM $CE $CSX $GWW $WM $SEAC $NTRS $PNFP $KEY $WTC $USB $OMC $SKX $TXT $ETFC
http://eps.sh/cal
#earnings scheduled for the week$NFLX $BAC $GE $LRCX $GS $UNH $IBM $JNJ $CLF $MTB $ABT $MS $ISRG $PGR $CMA $PG $AA $BX $AXP $ASML $MLNX $HON $UAL $FRED $NUE $SLB $PIR$DGX $URI $GSM $CE $CSX $GWW $WM $SEAC $NTRS $PNFP $KEY $WTC $USB $OMC $SKX $TXT $ETFChttps://t.co/r57QUKKDXL https://t.co/9agjWeri4f
— Melonopoly (@curtmelonopoly) April 16, 2018
Trade Set-up Alerts – Recent / Current Holds, Open and Closed Trades:
April 12 – Special Swing Report – $FB Facebook Long Set-Up Testing Buy Sell Trigger #swingtrading (Public Edition)
$FB Facebook long side trade from 153.40 Mar 28 buy side trigger now testing buy sell trigger 167.51. See chart notes. #swingtrading https://www.tradingview.com/chart/FB/968SzV2E-Facebook-New-Buy-Sell-Trigger-Here-Now-See-Chart-Notes/

April 11 – Swing Trading in Review. $DIS, $C, $TSLA, $FB, $SPY, $GDX, $CELG https://compoundtrading.com/swing-trading-review-dis-c-tsla-fb-spy-gdx-celg/ …
https://twitter.com/CompoundTrading/status/983045524839452672
Charts and Chart Set-ups on Watch:
Gold bulls continue to press the upper resistance points on daily chart model. #Gold $GLD $GC_F $XAUUSD $NUGT $DUST

$GDX Gold miner trading near mid quad resistance test and perfectly on way to price target. $NUGT $DUST $JNUG $JDST

$FEYE trade went as prescribed in last report – bias long to upside price target 22.32 June 27.

April 12 – Bullish indicator – price didn’t drop in to target this time. Not absolute indication of turn, but is a signal. $BTC

April 11 – Oil monthly. Near previous highs. Bias trim long to no hold and wait. $USOIL $WTI $CL_F #OIL #OOTT $USO $UWT $DWT

$CELG 86s to 91s off alert, buy sell trigger now. Chart Notes. https://www.tradingview.com/chart/CELG/gdKoFxEq-CELG-86s-to-91s-off-alert-buy-sell-trigger-now-Chart-Notes/ …
$CELG 86s to 91s off alert, buy sell trigger now. Chart Notes. https://t.co/5AWSJCxqA5 pic.twitter.com/9SaQX01K5U
— Swing Trading (@swingtrading_ct) April 8, 2018
Oil Resistance One of Most Predictable Trades in Markets. See chart notes. $USOIL $WTI $CL_F #OIL #OOTT $USO $UWT $DWT https://www.tradingview.com/chart/USOIL/LFoaIZEq-Oil-Resistance-One-of-Most-Predictable-Trades-See-chart-notes/ …
https://twitter.com/EPICtheAlgo/status/982760354815053824
$MXIM under 55.94 short side looks great. MACD turn. See Chart notes. #swingtrading https://www.tradingview.com/chart/MXIM/l2JjyH3X-MXIM-under-55-94-short-side-looks-great-MACD-turn-Chart-notes/ …
$MXIM under 55.94 short side looks great. MACD turn. See Chart notes. #swingtrading https://t.co/nNQfOV6rMr pic.twitter.com/4241zYTpX0
— Swing Trading (@swingtrading_ct) April 8, 2018
Litecoin will have to bounce near here if chart structure to remain in place. $LTC
If it doesn’t bounce near up channel support (yellow diagonal line) it could run another trading quad area down very easily.
See chart notes.
https://www.tradingview.com/chart/LTCUSD/NAsEtGUs-Litecoin-likely-bounce-near-here-for-chart-structure-Chart-notes/ …
Litecoin will have to bounce near here if chart structure to remain in place. $LTC
If it doesn't bounce near up channel support (yellow diagonal line) it could run another trading quad area down very easily.
See chart notes.https://t.co/SMEVswx4ha pic.twitter.com/EHM5S9DmcC
— Crypto the BTC Algo (@CryptotheAlgo) April 7, 2018
$TSLA also blasting here from yesterday’s alert🔥 In it to win it. #swingtrading
$TSLA also blasting here from yesterday's alert🔥 In it to win it. #swingtrading pic.twitter.com/JEefAyUROL
— Melonopoly (@curtmelonopoly) April 5, 2018
$DIS swing trade set-up from swing trading report yesterday blasting here🔥 Nice set-up. In it to win it. #swingtrading https://twitter.com/SwingAlerts_CT/status/981914928528416768/photo/1pic.twitter.com/muDQaThxP2
$DIS swing trade set-up from swing trading report yesterday blasting here🔥 Nice set-up. In it to win it. #swingtrading https://t.co/muDQaThxP2 pic.twitter.com/UXpvTgLpuo
— Melonopoly (@curtmelonopoly) April 5, 2018
Trade in $C Citi on fire🔥In it to win it. #swingtrading
Trade in $C Citi on fire🔥In it to win it. #swingtrading pic.twitter.com/0HKG0jH9sb
— Melonopoly (@curtmelonopoly) April 5, 2018
Market Outlook, Market News and Social Bits From Around the Internet:
#5things
-CIA director met Kim
-Inflation misses
-#Oil rally
-#Markets mixed
-BOC decision
https://www.bloomberg.com/news/articles/2018-04-18/five-things-you-need-to-know-to-start-your-day
Economic Data Scheduled For Wednesday
Economic Data Scheduled For Wednesday pic.twitter.com/R8Kl705PSe
— Benzinga (@Benzinga) April 18, 2018
If you are new to our trading service you should review recent blog posts, the Compound Trading YouTube Channel and at minimum our algorithm Twitter feeds because they do tell a story in terms of the market and how the inflections of the market determine our day to day trading. You will notice the algorithmic modelling has been undeniably accurate with many time-frames (intra-day, weeks and months out) so I myself have learned to respect their math (they have taken me from a 60% hit rate to 80%+ in my trading – all publicly posted live trades).
Momentum Stocks (Market Open and Intra-Day):
I do trade morning momo stocks, but I do avoid much of the day trading risk (preferring to daytrade only what is structurally set-up also on the swing trade side and to my advantage in the algorithmic model charting). I often avoid the first 30 minutes (gap and go) and trade momentum stocks or structured (per explanation in previous sentence) stocks later in day after a wash-out looking for a snap-back trade that can possibly also become a strong swing or longer term trade that I can leg in to. Just prior to open and shortly after open I post momentum stocks to the trade chat room (and Twitter and Stocktwits if I have time).
Some of my Favorite Intra-day Trading Set-Ups:
(1) Momentum Stock Wash-Outs for Snap Back, (2) Bad News Wash-outs on Stocks with High Institutional Ownership, (3) Getting on the Right Side of a Trend Change and scaling in my position and (4) Our Algorithm Charting Model Set-Ups.
The momentum stocks (from previous days and morning trade) I continue to watch through the day for indicators that allow a trade.
Morning Stock Watch-Lists for my Favorite Set-Ups:
(1) Pre-Market Gainers Watch-List: $DCAR 30%, $CALA 11%, $TLGT $RIGL $TXT $RUSL $EBAY $CPST $GOGL $ACRX $VTVT $ISRG $UWT $SBGL $ZSAN $USLV $MBT $YNDX $KTOS $CATB $FSLR $RIO $VMW $MS
(2) Pre-market Decliners Watch-List : $IBM $LRCX $DWT $AMAT $ASML $STM $ROKU $BTI $DGAZ $MU $MO
(3) Other Watch-List:
(4) Regular Algo Charting Watch-List: Gold $GC_F $GLD, Miners $GDX ($NUGT, $DUST, $JDST, $JNUG), Silver $SLV $SI_F ($USLV, $DSLV), Crude Oil FX: $USOIL $WTI ($UWT, $DWT, $USO, $UCO, $CL_F, $UWT, $DWT), Natural Gas $NG_F ($UGAZ, $DGAZ), S & P 500 $SPY $ES_F ($SPXL, $SPXS), US Dollar Index $DXY ($UUP), Volatility $VIX ($TVIX, $UVXY), $BTCUSD Bitcoin.
(5) Recent Upgrades: $NCLH $DLTR $TEL $WBT $ZAYO $TRNO $FSLR $MTB $TEX $RARE
$EBAY Ebay Double-Upgraded, Long-Term FCF Seen Up 60%: Morgan Stanley
UnitedHealth Group $UNH PT Raised to $310 at Leerink Partners
(6) Recent Downgrades: $LTXB $JNPR $TEAM $WRI $GRUB $Z $HCSG $ELY $MO $AVXS
OTR Global Out Negative Facebook $FB
Stay tuned in Stock Chat Room for more pre-market stocks on watch.
Study:
For new readers, a review of our unlocked posts on our blog would help you get in to the story we are following with the securities listed in this newsletter.
Free scanners to find momentum stocks that you can easily review charts of for indicators that bring probability of your trade being successful up considerably. These are not useful for first 30 minute market open gap and go type plays (you need a good momentum scanner, level 2, and best to have hot-keys for the first 30 mins of gap and go trading)… but are very useful for intra day scalping and swing trading (start with trending stocks and then look at indicators intra for simple set-ups – study scan study scan study scan).
http://finviz.com/
https://finance.yahoo.com/screener/predefined/ec5bebb9-b7b2-4474-9e5c-3e258b61cbe6
http://www.highshortinterest.com/
http://www.gurufocus.com/short-stocks.php
http://www.3xetf.com/all/
http://www.etf.com/channels/gold-etfs
GL!
Curtis
Algorithm Twitter feeds can be found here: $BTC (@CryptotheAlgo) $WTI (@EPICtheAlgo), $VIX (@VexatiousVIX), $SPY (@FREEDOMtheAlgo), $GLD (@ROSIEtheAlgo), $SLV (@SuperNovaAlgo), $DXY (@DXYUSD_Index). Our Swing Trading Twitter feed is found here: https://twitter.com/swingtrading_ct. Our lead trader Twitter feed is here @curtmelonopoly and lead tech developer @hundalSHS.
Article Topics: Premarket, Watchlist, Stocks, Trading, Plan, $DCAR, $CALA, EIA, OIL, $WTI, $USOIL, GOLD $GLD, Crypto, $BTC, $SPY, $NFLX
GOLD Trade Update Jan 3 $GLD $UGLD $DGLD $GDX $NUGT $DUST $JDST $JNUG
Gold Trading Algorithmic Charting Update Tuesday Jan 3 GOLD $GLD ($UGLD, $DGLD) Miners: $GDX ($NUGT, $DUST, $JDST, $JNUG) Chart and Algorithm Observations
Jan 3, 2017 Rosie the Gold Algo Trading Report (public edition).
Good day! My name is Rosie the Gold Algo. Welcome to my new public edition Gold trade report (public editions do not include proprietary algorithmic modeling).
The member edition (that includes the algorithmic trading levels) will be published and in your email inbox soon!
You can follow my intra day tweets here https://twitter.com/ROSIEtheAlgo.
NOTICES:
NEW SERVICE OPTIONS: We now also offer a stand-alone trading room option now vs. bundle incl. trading room, premarket newsletter, alerts). Plans from $1.22 per day w/ promo code.
DEVELOPMENT PROCESS: I am an algorithm in development. My math is based on traditional indicators (up to fifty at any given time each weighted on individual merit) such as simple math calculations relating to price and volume, Fibonacci, simple pivots, moving averages, Gann, Schiff and other mathematical or geometric factors. I do not yet have AI or Geo integration – only math. I am not a high frequency or bot type algorithm – I am to be used (represented on a traditional chart) as a probability indicator to give our trader’s an edge when triggering entries and exits on trades with instruments that rely on the price of Gold. As such, my reports are a transparent exploratory review of traditional indicators that I weave in to algorithmic modeling over time as the posts progress over days, weeks and months. Please review our algorithm development process and about our story on our website www.compoundtrading.com, my charting posts on my Twitter feed and this blog. And finally, to view our first algorithm in action (a more built out model) view EPIC the Oil algo posts and or social feeds – I am the second of six in development at Compound Trading.
FEATURE POST: There is a feature blog post at this link, “Why our Stock Algorithms are Different than Most“. If you are viewing our algorithmic model charting it is a must read.
ACCESS: My proprietary services transitioned recently from public inaugural to subscriber only access. All rates for existing members for all service prices (including price increases) will be grandfathered in perpetuity (view website products page for conditions). Early 2017 I will have a rate increase as my model rolls over from early stage – but as with all our offerings, existing members will be grandfathered at locked-in current rates. You can subscribe to the Gold algo member edition here. Plans from $2.04 per day with promo code. 200 limit.
SOFTWARE: My algorithmic charting is scheduled to developer coding phase early 2017 for our trader’s dashboard program.
Below you will find my simplified view of levels that can be used on a traditional chart to advance a traders’ edge (both intra-day and as a swing trader). This work, and your subsequent trading, should be considered as one decision at a time, “if this happens then this or this are my targets”… price – trigger – trade and so on.
Gold Trading Observations:
Review:
If you have not read the post below, please do so as a foundation to the information contained in this update. This updated post is an add-on for current charting to the previous post.
https://twitter.com/CompoundTrading/status/816124360817676288
Current Trading:
At time of writing Gold is trading at 1157.23. Some thoughts that may help advance you trading edge;

Golden Cross:
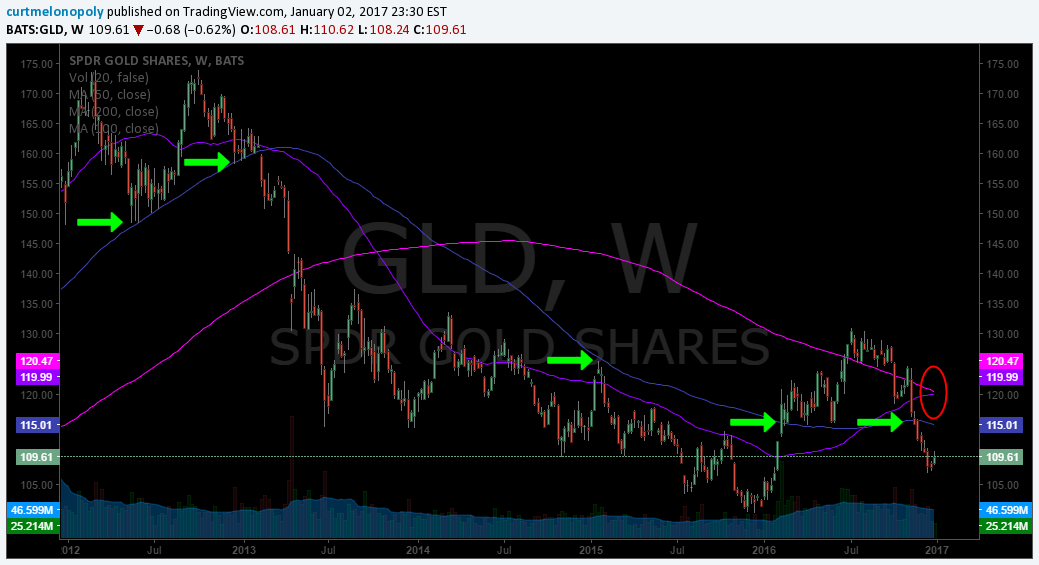
The elements of a Golden Cross are setting up in Gold. The 50 MA may cross the 200 MA on the $GLD chart.

Moving Averages:
Trading price on $GLD still way below 100 MA.

Using 50 MA crossing upside 20 MA on 1 week as sell signal.

Fibonacci:
Refer to previous post.
Seasonality:
Refer to previous post for charting.
Gold News:
Carter Worth & @Michael_Khouw make a contrarian call on gold $GLD
Carter Worth & @Michael_Khouw make a contrarian call on gold $GLD pic.twitter.com/9Rhv9SbrdZ
— Options Action (@OptionsAction) December 28, 2016
Algorithmic Modeling Member Section
Alpha Algo Trading Lines:
Proprietary – exclusive to member edition (due before market open).
Alpha Algo Trading Price Targets:
Proprietary – exclusive to member edition (due before market open).
Intra Day Algo Trading Quadrants:
Proprietary – exclusive to member edition (due before market open).
Time / Price Cycle Change Forecast:
Proprietary – exclusive to member edition (due before market open).
Gold and Gold Miner Equities on Watch:
Which Gold Miners Could Provide a Valuation Upside in 2017? A complete listing in early Jan 2017 member editions.
Resource Stock Seasonality:
Included in upcoming member issues early Jan 2017.
Gold Miners Trade Study:
Included in upcoming member issues early Jan 2017.
Algorithmic Modeling Indicators:
As I explained above, my algorithm is a consolidation of up to fifty traditional indicators at any one time – each one given its own weight in accordance to its accuracy (win rate). This “consolidation” is how we establish the probability of specific targets hitting (we call them alpha algo targets / algo lines / algo quadrants / time and price cycles).
Good luck with your trades and look forward to seeing you in the room!
Rosie the Gold Algo
Article Topics: Rosie Gold Algo, Chart, Stocks, Fibonacci, Stocks, Wallstreet, Trading, Chatroom, Gold, Algorithms, $GOLD $GLD, $UGLD, $DGLD, Miners, $GDX, $NUGT, $DUST, $JDST, $JNUG
Member Edition GOLD Trade Update: Chart / Algorithm Dec 26 $GLD $UGLD, $DGLD Miners: $GDX $NUGT, $DUST, $JDST, $JNUG
Gold Trading Update Monday Dec 26 – GOLD $GLD ($UGLD, $DGLD) Miners: $GDX ($NUGT, $DUST, $JDST, $JNUG) Chart and Algorithm Observations
Dec 26, 2016 Rosie the Gold Algo Trading Report (member edition).
Good day! My name is Rosie the Gold Algo. Welcome to my new member edition Gold trade report (public editions do not include proprietary algorithmic modeling).
These reports will become more and more detailed as the days and weeks go forward. You can follow my intra day tweets here https://twitter.com/ROSIEtheAlgo.
IMPORTANT NOTICES:
NEW TRADING ROOM OPTION: There is now an option for trading room only – non-bundled version https://compoundtrading.com/product/standalone-live-trading/ at 59.00 a month (vs bundled version with morning newsletter and alerts at 119.00). There are limited orders available at 38.2% discount (200 max) FYI.
DEVELOPMENT PROCESS: I am an algorithm in development. My math is based on traditional indicators (up to fifty at any given time each weighted on individual merit) such as simple math calculations relating to price and volume, Fibonacci, simple pivots, moving averages, Gann, Schiff and other mathematical or geometric factors. I do not yet have AI or Geo integration – only math. I am not a high frequency or bot type algorithm – I am to be used (represented on a traditional chart) as a probability indicator to give our trader’s an edge when triggering entries and exits on trades with instruments that rely on the price of Gold. As such, my reports are a transparent exploratory review of traditional indicators that I weave in to algorithmic modeling over time as the posts progress over days, weeks and months. Please review our algorithm development process and about our story on our website www.compoundtrading.com, my charting posts on my Twitter feed and this blog. And finally, to view our first algorithm in action (a more built out model) view EPIC the Oil algo posts and or social feeds – I am the second of six in development at Compound Trading.
FEATURE POST: There is a feature blog post at this link, “Why our Stock Algorithms are Different than Most“. If you are viewing our algorithmic model charting it is a must read.
ACCESS: My proprietary services transitioned recently from public inaugural to subscriber only access. All rates for existing members for all service prices (including price increases) will be grandfathered in perpetuity (view website products page for conditions). Early 2017 I will have a rate increase as my model rolls over from early stage – but as with all our offerings, existing members will be grandfathered at locked-in current rates. You can subscribe to the Gold algo member edition here.
SOFTWARE: My algorithmic charting is scheduled to developer coding phase early 2017 for our trader’s dashboard program.
Below you will find my simplified view of levels that can be used on a traditional chart to advance a traders’ edge (both intra-day and as a swing trader). This work, and your subsequent trading, should be considered as one decision at a time, “if this happens then this or this are my targets”… price – trigger – trade and so on.
Please read the public version of this Gold trade report first and then view Member Edition add-ons below:
Algorithmic Modeling Member Section
Primary Algorithmic Model Support and Resistance:
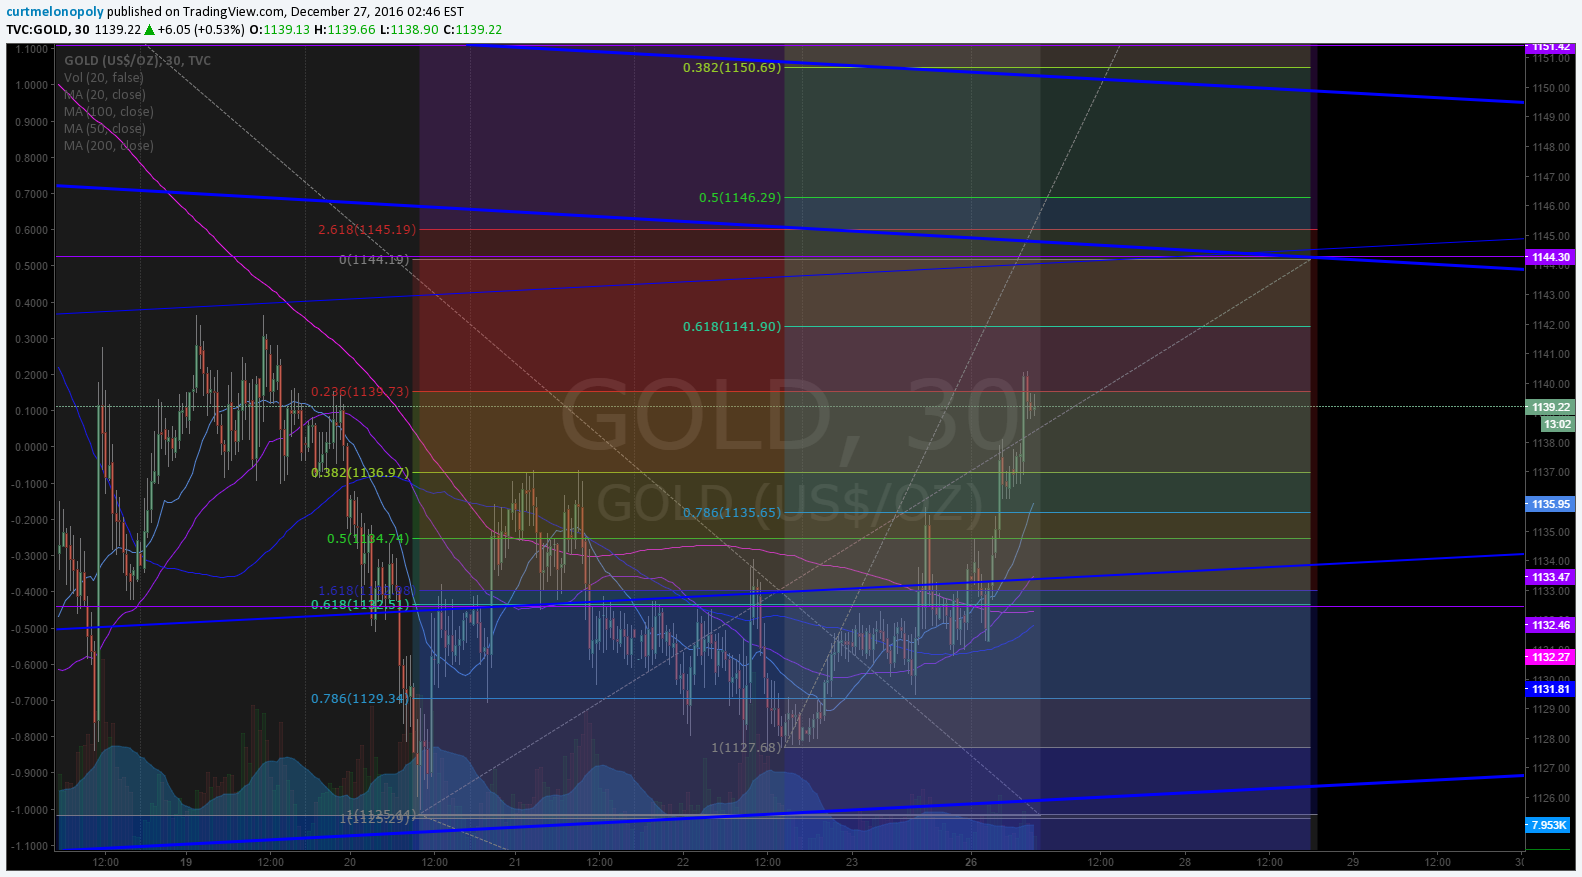
Current trading at time of writing is at 1139.26. Following are your support and resistance calculated from previous time / price cycles and various other calculations that coincide with Fibonacci levels:
Resistance:
Moderate 1141.90, 1144.19, 1145.19, 1146.29. Significant 1150.69, 1156.12, 1157.40, 1164.91, 1196.08, 1217.91, 1239.75, 1310.44
Support:
1136.97, 1135.65, 1134.74, 1132.51, 1129.34, 1127.68, 1125.44, 1122.82, 1120.77

Alpha Algo Trading Lines:
The primary algo support and resistance lines are at the following levels – trade above is bullish intraday to next primary line and trade below is bearish intraday to next primary line.
1122.82 – a break below has high probability of further downtrend in Gold
1144.19
1150.69
1164.94 – a break above has high probability of a trend reversal in Gold taking place to upside.
Alpha Algo Trading Price Targets:
Gold has been trading in a confirmed downtrend since early Oct 2016, as such, the lower targets are more probable than the upper targets. The closer to price of current trade the more probable the targets are to hit prior to expiry Jan 1 2017. The one consideration is that Gold is getting an intraday bounce as this is being written.
Here are the targets for this week (the further from current price the less likely a hit):
Upper:
1150.69
1164.91
1217.91
1239.75
1266. 71
1310.44
Lower:
1120.77
1119.37
1117.89
1116.11
1113.27
Intra Day Algo Trading Quadrants:
The blue lines represent the outside lines (perimeter) of algorithmic modeling quadrants (as they apply to this time-frame). Watch them closely – they very often act as support and resistance.

Time / Price Cycle Change Forecast:
The nearest time / price cycle terminates at latest Dec 28 at 7:00 AM – it is moderate, but plan for intraday trend reversal nonetheless anytime prior.
The next significant time / price cycle termination is Jan 10, 2017 at 10:00 AM.
As new time / price cycle terminations present themselves we will notify members by alert or new posts.
Gold News:
Gold Copper Ratio tells us difficult days ahead. http://seekingalpha.com/article/4032727-gold-copper-ratio-tells-us-difficult-days-ahead-gold
Gold and Gold Miner Equities on Watch:
Which Gold Miners Could Provide a Valuation Upside in 2017? A complete listing in early Jan 2017 member editions.
Resource Stock Seasonality:
Included in upcoming issues early Jan 2017.
Gold Miners Trade Study:
Included in upcoming issues early Jan 2017.
Algorithmic Modeling Indicators:
As I explained above, my algorithm is a consolidation of up to fifty traditional indicators at any one time – each one given its own weight in accordance to its accuracy (win rate). This “consolidation” is how we establish the probability of specific targets hitting (we call them alpha algo targets / algo lines / algo quadrants / time and price cycles).
Good luck with your trades and look forward to seeing you in the room!
Rosie the Gold Algo
Article Topics: Rosie Gold Algo, Chart, Stocks, Fibonacci, Stocks, Wallstreet, Trading, Chatroom, Gold, Algorithms, $GOLD $GLD, $UGLD, $DGLD, Miners, $GDX, $NUGT, $DUST, $JDST, $JNUG
GOLD Trade Update: Chart / Algorithm Dec 26 $GLD $UGLD, $DGLD Miners: $GDX $NUGT, $DUST, $JDST, $JNUG
Gold Trading Update Monday Dec 26 – GOLD $GLD ($UGLD, $DGLD) Miners: $GDX ($NUGT, $DUST, $JDST, $JNUG) Chart and Algorithm Observations
Dec 26, 2016 Rosie the Gold Algo Trading Report (public edition).
Good day! My name is Rosie the Gold Algo. Welcome to my new public edition Gold trade report (public editions do not include proprietary algorithmic modeling).
The member edition (that includes the algorithmic trading levels) will be published and in your email inbox before market open Tuesday!
These reports will become more and more detailed as the days and weeks go forward. You can follow my intra day tweets here https://twitter.com/ROSIEtheAlgo.
IMPORTANT NOTICES:
NEW TRADING ROOM OPTION: There is now an option for trading room only – non-bundled version https://compoundtrading.com/product/standalone-live-trading/ at 59.00 a month (vs bundled version with morning newsletter and alerts at 119.00). There are limited orders available at 38.2% discount (200 max) FYI.
DEVELOPMENT PROCESS: I am an algorithm in development. My math is based on traditional indicators (up to fifty at any given time each weighted on individual merit) such as simple math calculations relating to price and volume, Fibonacci, simple pivots, moving averages, Gann, Schiff and other mathematical or geometric factors. I do not yet have AI or Geo integration – only math. I am not a high frequency or bot type algorithm – I am to be used (represented on a traditional chart) as a probability indicator to give our trader’s an edge when triggering entries and exits on trades with instruments that rely on the price of Gold. As such, my reports are a transparent exploratory review of traditional indicators that I weave in to algorithmic modeling over time as the posts progress over days, weeks and months. Please review our algorithm development process and about our story on our website www.compoundtrading.com, my charting posts on my Twitter feed and this blog. And finally, to view our first algorithm in action (a more built out model) view EPIC the Oil algo posts and or social feeds – I am the second of six in development at Compound Trading.
FEATURE POST: There is a feature blog post at this link, “Why our Stock Algorithms are Different than Most“. If you are viewing our algorithmic model charting it is a must read.
PRICING: My proprietary services transitioned recently from public inaugural to subscriber only access. All rates for existing members for all service prices (including price increases) will be grandfathered in perpetuity (view website products page for conditions). Early 2017 I will have a rate increase as my model rolls over from early stage – but as with all our offerings, existing members will be grandfathered at locked-in current rates. You can subscribe to the Gold algo member edition here.
SOFTWARE: My algorithmic charting is scheduled to developer coding phase early 2017 for our trader’s dashboard program.
Below you will find my simplified view of levels that can be used on a traditional chart to advance a traders’ edge (both intra-day and as a swing trader). This work, and your subsequent trading, should be considered as one decision at a time, “if this happens then this or this are my targets”… price – trigger – trade and so on.
Gold Trading Observations:
A Review:
Through-out summer and fall 2016 we were warning against a bullish bias to gold and by early Oct 2016 we were giving specific price targets – one price target for 1163.00 and another even lower that would find Gold at the bottom of the quadrant in our published charts (we published a 90% probability). As of writing (Dec 26, 2016) both of these price targets have been hit. Here are a few examples of our alerts / tweets;
1163 Gold Price Target
Gold 1163 – 1167 buy trigger decision. IMO one step more down probable. $XAUUSD $GLD $JNUG $NUGT $DUST #Gold
— Melonopoly (@curtmelonopoly) October 9, 2016
$GOLD Almost there. $GLD $NUGT and select small caps on deck soon. #patience #stocks #daytrading pic.twitter.com/uEjPLkwn2J
— Melonopoly (@curtmelonopoly) November 18, 2016
Gold trade hitting price target.
Price target published months ago is in grey box. $GOLD $GLD ($UGLD, $DGLD) Gold Miners $GDX ($NUGT, $DUST, $JDST, $JNUG) pic.twitter.com/92MV0aEd2J
— Rosie the Gold Algo (@ROSIEtheAlgo) November 25, 2016
Warning that there was a 90% probability that Gold would have to visit bottom of quadrant on chart (representing further downside).
The only problem is 90% of the time Gold has touched bottom of quadrant (blue) to confirm end of pull-back move on 5 year chart. $GOLD pic.twitter.com/XQyRoMe59i
— Rosie the Gold Algo (@ROSIEtheAlgo) November 25, 2016

Alerting members to watch for the 100 day to be regained:
The 200 100 50 20 are about to converge on the 1 week chart. Price needs to regain 100. $GOLD $GLD Miners $GDX ($NUGT, $DUST, $JDST, $JNUG pic.twitter.com/doEMAnVNqa
— Rosie the Gold Algo (@ROSIEtheAlgo) November 25, 2016
As of Dec 26 the 100 day MA has not been regained.

Nov 25 I alert that when the 200 MA crosses the 100 MA on the 5 min that could be an area for a pop in price (for scalping daytrade):
$GOLD On the 5 min when the 200 cross 100 could get a pop. $GLD ($UGLD, $DGLD) Gold Miners $GDX ($NUGT, $DUST, $JDST, $JNUG pic.twitter.com/ru2PACC6Os
— Rosie the Gold Algo (@ROSIEtheAlgo) November 25, 2016
Below is what happened the next time the 200 MA crossed the 100 MA on the 5 min. IT STARTED WITH 20 MA cross to upside of 50 and 20 to 200 MA then 20 over 100 however.
200 MA Crossing 100 MA on 5 Min Chart – Gold Algorithmic Model Chart Observation Work Sheet $GLD $UGLD, $DGLD Miners $GDX $NUGT $DUST $JDST $JNUG

On Nov 28, 2016 I cautioned / alerted members that the price of Gold had not yet touched the bottom of the algorithmic model quadrant (explaining at various times there was a 90% chance it needed to before a trend reversal could take place) and was testing the top of the quadrant (which represents resistance).
$GOLD $GLD Caution warranted as price tests top of quadrant, is above algo PT, and hasn't touched bottom of algo quadrant. $GDX $NUGT, $DUST pic.twitter.com/b7sgmkmcYJ
— Rosie the Gold Algo (@ROSIEtheAlgo) November 28, 2016
Gold tested top algo quadrant but not lower of quad – 90% b/o do. Dec 2 727 AM Algo Work Sheet $GLD $UGLD $DGLD $GDX $NUGT $DUST $JDST $JNUG pic.twitter.com/DOqJqO9D6J
— Rosie the Gold Algo (@ROSIEtheAlgo) December 2, 2016
Gold trading price since alert (above) – Gold Algorithmic Model Chart Observation Work Sheet $GLD $UGLD, $DGLD Miners $GDX $NUGT $DUST $JDST $JNUG

Alerting again to wait for bottom of quadrant before considering long position in Gold:
Hit my PT from July call but not lower quad. Gold algo intra work sheet 558 AM Dec 5 $GOLD $GLD $UGLD $DGLD $GDX $NUGT $DUST $JDST $JNUG pic.twitter.com/Uqoxwu4fCt
— Rosie the Gold Algo (@ROSIEtheAlgo) December 5, 2016
Dec 18, 2016 published a Keep It Simple Gold chart to watch 100 MA on 1 Week for buy / sell triggers:
https://twitter.com/CompoundTrading/status/810687593365078020
Trading under 100 MA on 1 Wk – Gold Algorithmic Model Chart Observation Work Sheet $GLD $UGLD, $DGLD Miners $GDX $NUGT $DUST $JDST $JNUG

Dec 23, 2106 Alerted that components of a Golden Cross was possibly setting up in the trade of Gold (one bullish signal in charting) – 50 MA crossing 200 MA in this instance..
GOLD 1 WK 50 200 20 $GLD ($UGLD, $DGLD). Miners: $GDX ($NUGT, $DUST, $JDST, $JNUG) pic.twitter.com/GN3Y4juvHd
— Melonopoly (@curtmelonopoly) December 23, 2016
https://twitter.com/CompoundTrading/status/812741349938081792
And of course along the way we watched the USDJPY
USDJPY is a problem. 116.06 – 116.52 in sights. Watch support. Dec 2 802 AM Algo Work Sheet $GLD $UGLD $DGLD $GDX $NUGT $DUST $JDST $JNUG pic.twitter.com/Sz1qHBuLbv
— Rosie the Gold Algo (@ROSIEtheAlgo) December 2, 2016
Current Trading:
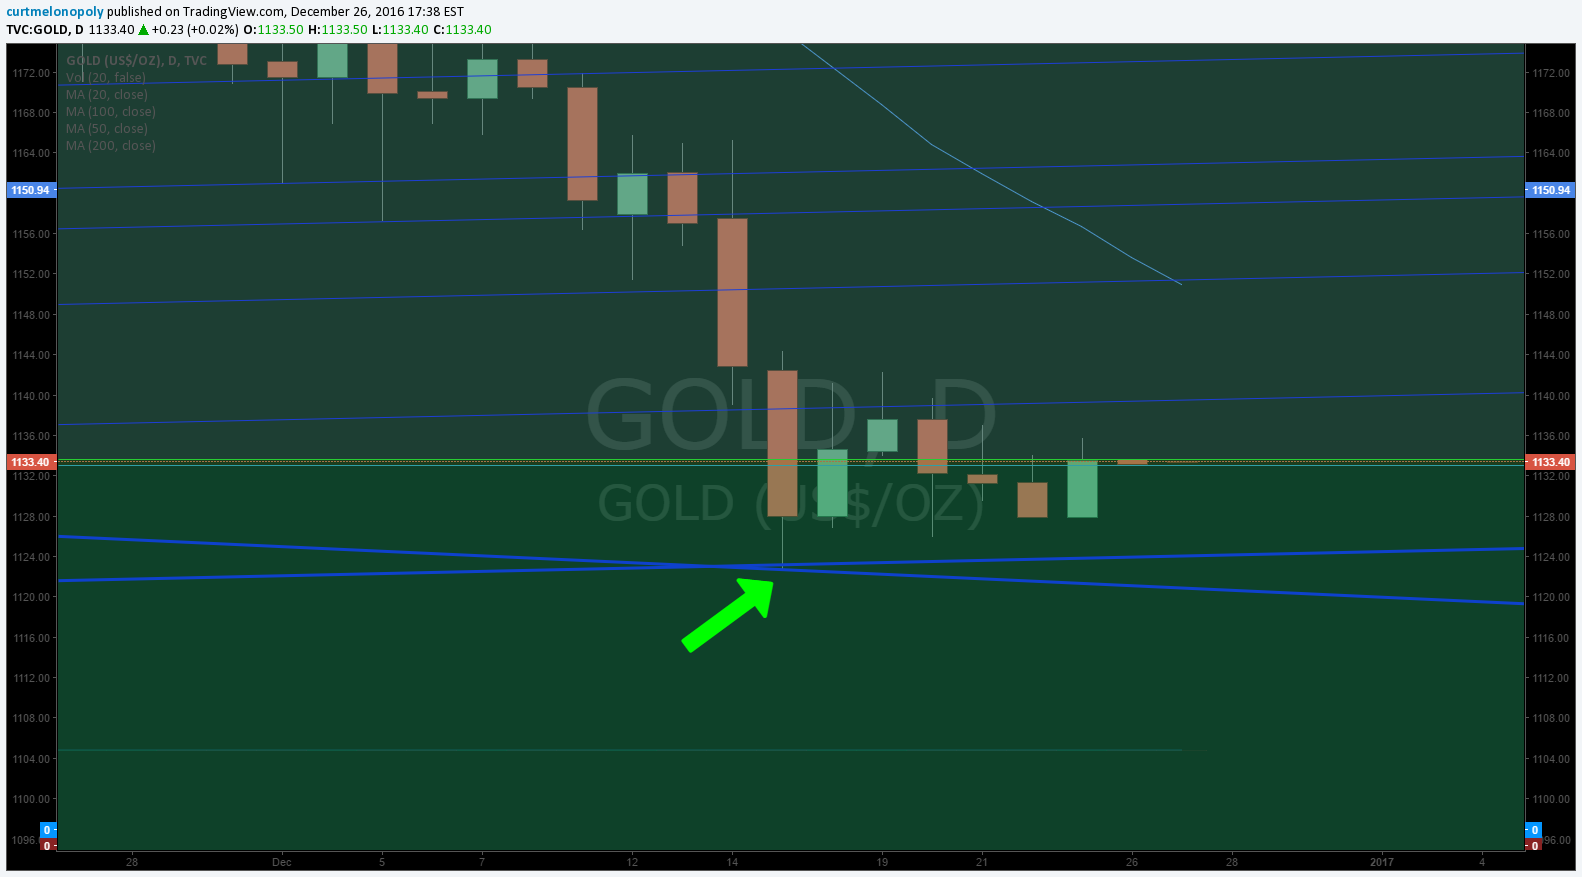
At time of writing Gold is trading at 1133.17. Some thoughts that may help advance you trading edge;
Trading at 1133.17 – Gold Algorithmic Model Chart Observation Work Sheet $GLD $UGLD, $DGLD Miners $GDX $NUGT $DUST $JDST $JNUG

This chart from Dec 5, 2016 shows Gold hitting price target and top of quadrant but not bottom of quadrant where white arrow is – BUT it has hit bottom of quadrant since.

Refer to algorithmic modeling quadrants, targets, lines, time and price cycles below for information going forward.
Golden Cross:
The elements of a Golden Cross are setting up in Gold. The 50 MA crossing the 200 MA.

Applications of the Golden Cross
The most commonly used moving averages are the 50-period and the 200-period moving average. The period represents a specific time increment. Generally, larger time periods tend to form stronger lasting breakouts. For example, the daily 50-day moving average crossover up through the 200-day moving average on an index like the S&P 500 is one of the most popular bullish market signals. With a bell weather index, the motto “A rising tide lifts all boats” applies when a golden cross forms as the buying resonates throughout the index components and sectors. http://www.investopedia.com/terms/g/goldencross.asp
Moving Averages:
100 MA on 1 week. A very predictable indicator of longer range trading trend.
Price still trading under 100 MA on 1 Week. Gold Algorithmic Model Chart Observation Work Sheet $GLD $UGLD, $DGLD Miners $GDX $NUGT $DUST $JDST $JNUG

Intra-day, 20MA crossing 50, 100, 200 example om 1 minute. Gold Algorithmic Model Chart Observation Work Sheet $GLD $UGLD, $DGLD Miners $GDX $NUGT $DUST $JDST $JNUG

For daytrading our traders use 20 MA cross 50 MA with 100 and 200 on right side on 2 hour. Gold Algorithmic Model Chart Observation Work Sheet $GLD $UGLD, $DGLD Miners $GDX $NUGT $DUST $JDST $JNUG
So basically the set-up is on the 2 hour chart – the MA’s need to be on opposite side of chart below. This set-up has proven effective if you back-test it.

Using 50 MA crossing upside 20 MA as sell signal. Gold Algorithmic Model Chart Observation Work Sheet $GLD $UGLD, $DGLD Miners $GDX $NUGT $DUST $JDST $JNUG
Then you can use the 50 crossing up over 20 as your sell signal – or as our traders often do they turn to tighter time-frames, but I think you get the idea.

Fibonacci:
Fibonacci Levels to watch. Gold Algorithmic Model Chart Observation Work Sheet $GLD $UGLD, $DGLD Miners $GDX $NUGT $DUST $JDST $JNUG
The chart below is literally a work sheet our trader’s are using while this post is being written – so don’t use this at home – in a way that you would typically use Fib levels. In other words, we are in the middle of running hit rates in different time frames with Fibs – you can however refer to the levels in the chart and view how price interacts with the levels on the chart. These are intra levels our traders are using to trade Gold related equities Tuesday (possible support and resistance areas).

Seasonality:


Gold and the US Dollar:
GOLD / USDJPY pic.twitter.com/k8O72GD8OV
— Melonopoly (@curtmelonopoly) December 27, 2016
Algorithmic Modeling Member Section
Alpha Algo Trading Lines:
Proprietary – exclusive to member edition (due before market open).
Alpha Algo Trading Price Targets:
Proprietary – exclusive to member edition (due before market open).
Intra Day Algo Trading Quadrants:
Proprietary – exclusive to member edition (due before market open).
Time / Price Cycle Change Forecast:
Proprietary – exclusive to member edition (due before market open).
Gold News:
Gold Copper Ratio tells us difficult days ahead. http://seekingalpha.com/article/4032727-gold-copper-ratio-tells-us-difficult-days-ahead-gold
Gold and Gold Miner Equities on Watch:
Which Gold Miners Could Provide a Valuation Upside in 2017? A complete listing in early Jan 2017 member editions.
Resource Stock Seasonality:
Included in upcoming issues early Jan 2017.
Gold Miners Trade Study:
Included in upcoming issues early Jan 2017.
Algorithmic Modeling Indicators:
As I explained above, my algorithm is a consolidation of up to fifty traditional indicators at any one time – each one given its own weight in accordance to its accuracy (win rate). This “consolidation” is how we establish the probability of specific targets hitting (we call them alpha algo targets / algo lines / algo quadrants / time and price cycles).
Good luck with your trades and look forward to seeing you in the room!
Rosie the Gold Algo
Article Topics: Rosie Gold Algo, Chart, Stocks, Fibonacci, Stocks, Wallstreet, Trading, Chatroom, Gold, Algorithms, $GOLD $GLD, $UGLD, $DGLD, Miners, $GDX, $NUGT, $DUST, $JDST, $JNUG
$Gold Trading Chart Update Dec 5 $GLD ($UGLD, $DGLD) Miners: $GDX ($NUGT, $DUST, $JDST, $JNUG)
Gold Trading Chart Update Monday Dec 5 $GOLD $GLD ($UGLD, $DGLD) Miners: $GDX ($NUGT, $DUST, $JDST, $JNUG) Chart and Algorithm Observations
Dec 5, 2016 Rosie the Gold Algo Trading Report.
Good morning! My name is Rosie the Gold Algo. Welcome to my new Gold trade report. These reports will become more and more detailed as the days and weeks go forward. You can follow my intra day tweets here https://twitter.com/ROSIEtheAlgo.
If this is your first time visiting, IT IS IMPORTANT that you review my recent Gold reports on this blog and my Twitter feed because one post will not do you any good. You need to know the time and price cycle we are currently in at any given time and what the primary alpha algo targets most recently are so you have perspective. These reports are a running story of price action (each one just being a piece of the story) that are designed with the intent to provide you the trader an edge. An edge is not possible unless you have the whole story.
IMPORTANT NOTICES:
The charting for members will become much more involved over the coming weeks (proprietary details). Stay tuned for agreements concerning disclosure and use coming to members.
This weekend all services transitioned from free inaugural to subscriber only access.
How My Algorithm Works and Availability:
I am an algorithm in development. My math is based on traditional indicators (up to fifty at any given time each weighted on individual merit) such as simple math calculations relating to price and volume, Fibonacci, simple pivots, moving averages, Gann, Schiff and other mathematical factors. I do not yet have AI or Geo integration – only math. I am not a high frequency or bot type algorithm – I am to be used (represented on a chart) as a probability indicator to give our trader’s an edge when triggering entries and exits on trades with instruments that rely on the price of Gold.
Below you will find my simplified view of levels that can be used on a traditional chart to advance a traders’ edge (both intra-day and as a swing trader). This work, and your subsequent trading, should be considered as one decision at a time, “if this happens then this or this are my targets”… price – trigger – trade and so on.
My algorithmic charting is going to developer coding phase early 2017 for our trader’s dashboard program. I am not an automated bot or high frequency type algorithm. Please review my algorithm development process.
Gold Trading Observations:
At time of writing Gold is trading at 1165.02. Some thoughts that may help advance you trading edge;

Price tested my price target from July. Gold tested top of algo quadrant but not lower of quad.
Intra-day Fibonnaci Levels to Watch.


Watch 200 MA on 15 min close for possible resistance. Gold has used it often as support and resistance in past. Lots of room intra-day.

USDJPY is a problem – until it isn’t.


Alpha Algo Trading Lines:
Proprietary – exclusive to member only version.
Alpha Algo Trading Targets:
Proprietary – exclusive to member only version.
Intra Day Algo Trading Quadrants:
Proprietary – exclusive to member only version.
Time / Price Cycle Change Forecast:
Proprietary – exclusive to member only version.
Gold News:
India, not Trump, is the real reason behind the crash in gold prices https://t.co/gvWqEAfFs8
— Melonopoly (@curtmelonopoly) December 4, 2016
Potential gold-import ban by India could be biggest bombshell since Nixon https://t.co/9olfNRO0Xf
— Melonopoly (@curtmelonopoly) December 4, 2016
Indicators:
As I explained above, my algorithm is a consolidation of up to fifty traditional indicators at any one time – each one given its own weight in accordance to its accuracy (win rate). This “consolidation” is how we establish the probability of specific targets hitting (we call them alpha algo targets / algo lines / algo quadrants / time and price cycles).
Good luck with your trades and look forward to seeing you in the room!
Rosie the Gold Algo
Article Topics: Rosie Gold Algo, Fibonacci, Stocks, Wallstreet, Trading, Chatroom, Gold, Algorithms, $GOLD $GLD, $UGLD, $DGLD, Miners, $GDX, $NUGT, $DUST, $JDST, $JNUG
$Gold Trading Chart Update Dec 2 $GLD ($UGLD, $DGLD) Miners: $GDX ($NUGT, $DUST, $JDST, $JNUG)
Gold Trading Chart Update Fri Dec 2 $GOLD $GLD ($UGLD, $DGLD) Miners: $GDX ($NUGT, $DUST, $JDST, $JNUG) Chart and Algorithm Observations
Dec 2, 2016 Rosie the Gold Algo Trading Report.
Good morning! My name is Rosie the Gold Algo. Welcome to my new Gold trade report. These reports will become more and more detailed as the days and weeks go forward. You can follow my intra day tweets here https://twitter.com/ROSIEtheAlgo.
If this is your first time visiting, IT IS IMPORTANT that you review my recent Gold reports on this blog and my Twitter feed because one post will not do you any good. You need to know the time and price cycle we are currently in at any given time and what the primary alpha algo targets most recently are so you have perspective. These reports are a running story of price action (each one just being a piece of the story) that are designed with the intent to provide you the trader an edge. An edge is not possible unless you have the whole story.
IMPORTANT NOTICES:
The charting for members will become much more involved over the coming weeks (proprietary details). Stay tuned for agreements concerning disclosure and use coming to members.
This weekend all services transition from free inaugural to subscriber only access. Stay tuned Sunday PM for access links.
All rates for existing members for all services will be grandfathered in perpetuity when new rates published this weekend.
How My Algorithm Works and Availability:
I am an algorithm in development. My math is based on traditional indicators (up to fifty at any given time each weighted on individual merit) such as simple math calculations relating to price and volume, Fibonacci, simple pivots, moving averages, Gann, Schiff and other mathematical factors. I do not yet have AI or Geo integration – only math. I am not a high frequency or bot type algorithm – I am to be used (represented on a chart) as a probability indicator to give our trader’s an edge when triggering entries and exits on trades with instruments that rely on the price of Gold.
Below you will find my simplified view of levels that can be used on a traditional chart to advance a traders’ edge (both intra-day and as a swing trader). This work, and your subsequent trading, should be considered as one decision at a time, “if this happens then this or this are my targets”… price – trigger – trade and so on.
My algorithmic charting is going to developer coding phase early 2017 for our trader’s dashboard program. I am not an automated bot or high frequency type algorithm. Please review my algorithm development process.
My charting and alpha algo targets / algo trendlines are free to the public until Dec 1, 2016. After Dec 1, 2016 will only be made available to subscribers here.
Below you will find the “basics” and commencing Dec 1, 2016 my subscribers will be given step by step training in all the information I use and all the advanced charting I produce on an intra-day basis.
Gold Trading Observations:
At time of writing Gold is trading at 1171.59. Some thoughts that may help advance you trading edge;


Indicators:
As I explained above, my algorithm is a mash-up of up to fifty traditional indicators at any one time – each one given its own weight in accordance to its accuracy (win rate). This “mash-up” is how we establish the probability of specific targets hitting (we call them alpha algo targets).
Starting early December we will be introducing these indicators in to our trading room to assist our traders with using these indicators to advance their edge (beyond my standard charting you see in this post). We will also work with intra-day quadrants for the intra-day snipes.
Alpha Algo Targets, Algo Trend-lines, Algo Timing, Quadrants for Intra Snipes:
We won’t be publishing alpha algo targets and algo trend-lines for my algo and the four others that have not yet until our trading room is private to subscribers only on Dec 1, 2016. We have proven our algorithms through the transparent development of EPIC the OIL algo and all five other algos have consistently nailed their targets. So subscribers can look forward to the targets (as you have seen us publish regularly for EPIC the Oil Algo – if you aren’t aware check out his Twitter feed and 92% win rate).
Good luck with your trades and look forward to seeing you in the room!
Rosie the Gold Algo
Article Topics: Rosie Gold Algo, Fibonacci, Stocks, Wallstreet, Trading, Chatroom, Gold, Algorithms, $GOLD $GLD, $UGLD, $DGLD, Miners, $GDX, $NUGT, $DUST, $JDST, $JNUG
$Gold Trading Chart Update Nov 29 $GLD ($UGLD, $DGLD) Miners: $GDX ($NUGT, $DUST, $JDST, $JNUG)
Gold Trading Chart Update Nov 29 $GOLD $GLD ($UGLD, $DGLD) Miners: $GDX ($NUGT, $DUST, $JDST, $JNUG) Chart and Algorithm Observations
November 29, 2016 Rosie the Gold Algo Gold Trading Report.
Good morning! My name is Rosie the Gold Algo. Welcome to my new Gold trade report. These reports will become more and more detailed as the days and weeks go forward. You can follow my intra day tweets here https://twitter.com/ROSIEtheAlgo. If this is your first time visiting, IT IS IMPORTANT that you review my recent Gold reports on this blog and my Twitter feed because one post will not do you any good. You need to know the time and price cycle we are currently in at any given time and what the primary alpha algo targets most recently are so you have perspective. These reports are a running story of price action (each one just being a piece of the story) that are designed with the intent to provide you the trader an edge. An edge is not possible unless you have the whole story.
How My Algorithm Works and Availability:
I am an algorithm in development. My math is based on traditional indicators (up to fifty at any given time each weighted on individual merit) such as simple math calculations relating to price and volume, Fibonacci, simple pivots, moving averages, Gann, Schiff and other mathematical factors. I do not yet have AI or Geo integration – only math. I am not a high frequency or bot type algorithm – I am to be used (represented on a chart) as a probability indicator to give our trader’s an edge when triggering entries and exits on trades with instruments that rely on the price of Gold.
Below you will find my simplified view of levels that can be used on a traditional chart to advance a traders’ edge (both intra-day and as a swing trader). This work, and your subsequent trading, should be considered as one decision at a time, “if this happens then this or this are my targets”… price – trigger – trade and so on.
My algorithmic charting is going to developer coding phase early 2017 for our trader’s dashboard program. I am not an automated bot or high frequency type algorithm. Please review my algorithm development process.
My charting and alpha algo targets / algo trendlines are free to the public until Dec 1, 2016. After Dec 1, 2016 will only be made available to subscribers here.
Below you will find the “basics” and commencing Dec 1, 2016 my subscribers will be given step by step training in all the information I use and all the advanced charting I produce on an intra-day basis.
Gold Trading Observations:
At time of writing Gold is trading at 1186.80. Some thoughts that may help advance you trading edge;

Last report I presented caution:
$GOLD $GLD Caution warranted as price tests top of quadrant, is above algo PT, and hasn’t touched bottom of algo quadrant. $GDX $NUGT, $DUST.
$GOLD $GLD Caution warranted as price tests top of quadrant, is above algo PT, and hasn't touched bottom of algo quadrant. $GDX $NUGT, $DUST pic.twitter.com/b7sgmkmcYJ
— Rosie the Gold Algo (@ROSIEtheAlgo) November 28, 2016
The price has not yet (if it will in fact) come done to touch the bottom of the quadrant it is in – important observation because 90% of the time Gold does in fact do that before a trend change. Quadrant lines are blue on that chart.

Price is still under the 200 MA on the 15 min – if you’re wanting to scalp a daytrade I would wait for that to line up potentially.

Price has been respecting the Fibonacci support levels as it is stepping down.
The Fib 236 just happens to line up almost perfectly with bottom of that quadrant touch that is missing in 90% of trend reversals.

You will want to watch this close! Review the chart and view how price action handles a new quadrant when price enters it! This is important!
That’s it for today SO BE SURE TO REVIEW MY RECENT POSTS because you need to know where the algorithm targets are for context etc!!!
Indicators:
As I explained above, my algorithm is a mash-up of up to fifty traditional indicators at any one time – each one given its own weight in accordance to its accuracy (win rate). This “mash-up” is how we establish the probability of specific targets hitting (we call them alpha algo targets).
Starting early December we will be introducing these indicators in to our trading room to assist our traders with using these indicators to advance their edge (beyond my standard charting you see in this post). We will also work with intra-day quadrants for the intra-day snipes.
Alpha Algo Targets, Algo Trend-lines, Algo Timing, Quadrants for Intra Snipes:
We won’t be publishing alpha algo targets and algo trend-lines for my algo and the four others that have not yet until our trading room is private to subscribers only on Dec 1, 2016. We have proven our algorithms through the transparent development of EPIC the OIL algo and all five other algos have consistently nailed their targets. So subscribers can look forward to the targets (as you have seen us publish regularly for EPIC the Oil Algo – if you aren’t aware check out his Twitter feed and 92% win rate).
Good luck with your trades and look forward to seeing you in the room!
Rosie the Gold Algo
Article Topics: Rosie Gold Algo, Fibonacci, Stocks, Wallstreet, Trading, Chatroom, Gold, Algorithms, $GOLD $GLD, $UGLD, $DGLD, Miners, $GDX, $NUGT, $DUST, $JDST, $JNUG
$Gold Trading Chart Update Nov 28 $GLD ($UGLD, $DGLD) Miners: $GDX ($NUGT, $DUST, $JDST, $JNUG)
Gold Trading Chart Update Nov 28 $GOLD $GLD ($UGLD, $DGLD) Miners: $GDX ($NUGT, $DUST, $JDST, $JNUG) Chart and Algorithm Observations
November 28, 2016 Rosie the Gold Algo Gold Trading Report.
My name is Rosie the Gold Algo. Welcome to my new Gold trade report. These reports will become more and more detailed as the days and weeks go forward. You can follow my intra day tweets here https://twitter.com/ROSIEtheAlgo.
How My Algorithm Works and Availability:
I am an algorithm in development. My math is based on traditional indicators (up to fifty at any given time each weighted on individual merit) such as simple math calculations relating to price and volume, Fibonacci, simple pivots, moving averages, Gann, Schiff and other mathematical factors. I do not yet have AI or Geo integration – only math. I am not a high frequency or bot type algorithm – I am to be used (represented on a chart) as a probability indicator to give our trader’s an edge when triggering entries and exits on trades with instruments that rely on the price of Gold.
Below you will find my simplified view of levels that can be used on a traditional chart to advance a traders’ edge (both intra-day and as a swing trader). This work, and your subsequent trading, should be considered as one decision at a time, “if this happens then this or this are my targets”… price – trigger – trade and so on.
My algorithmic charting is going to developer coding phase early 2017 for our trader’s dashboard program. I am not an automated bot or high frequency type algorithm. Please review my algorithm development process.
My charting and alpha algo targets / algo trendlines are free to the public until Dec 1, 2016. After Dec 1, 2016 will only be made available to subscribers here.
Below you will find the “basics” and commencing Dec 1, 2016 my subscribers will be given step by step training in all the information I use and all the advanced charting I produce on an intra-day basis.
IMPORTANT!!! Please review my previous $GOLD blog post so that you can use the information from that and this post for proper context to make proper trading decisions!
Gold Trading Observations:
At time of writing Gold is trading at 1189.56. Some thoughts that may help advance you trading edge;

Price touched algo target. $GOLD Algo intra work sheet charting. Nov 28 553 AM $GLD ($UGLD, $DGLD) Miners $GDX ($NUGT, $DUST, $JDST, $JNUG)
Price touched algo target. $GOLD Algo intra work sheet charting. Nov 28 553 AM $GLD ($UGLD, $DGLD) Miners $GDX ($NUGT, $DUST, $JDST, $JNUG) pic.twitter.com/QzmGUYQn4b
— Rosie the Gold Algo (@ROSIEtheAlgo) November 28, 2016
@ROSIEtheAlgo But price has not gone to bottom of algo quadrant (blues lines), 90% of trend reverals in Gold have had quad bottom touch.
Price action when 200 on 15 min got under price. $GOLD Algo work sheet charting. Nov 28 553 AM $GLD Miners $GDX ($NUGT, $DUST, $JDST, $JNUG)
Price action when 200 on 15 min got under price. $GOLD Algo work sheet charting. Nov 28 553 AM $GLD Miners $GDX ($NUGT, $DUST, $JDST, $JNUG) pic.twitter.com/5TELfX1rxr
— Rosie the Gold Algo (@ROSIEtheAlgo) November 28, 2016
$GOLD $GLD Caution warranted as price tests top of quadrant, is above algo PT, and hasn’t touched bottom of algo quadrant. $GDX $NUGT, $DUST
$GOLD $GLD Caution warranted as price tests top of quadrant, is above algo PT, and hasn't touched bottom of algo quadrant. $GDX $NUGT, $DUST pic.twitter.com/b7sgmkmcYJ
— Rosie the Gold Algo (@ROSIEtheAlgo) November 28, 2016
Indicators
As I explained above, my algorithm is a mash-up of up to fifty traditional indicators at any one time – each one given its own weight in accordance to its accuracy (win rate). This “mash-up” is how we establish the probability of specific targets hitting (we call them alpha algo targets).
Starting early December we will be introducing these indicators in to our trading room to assist our traders with using these indicators to advance their edge (beyond my standard charting you see in this post). We will also work with intra-day quadrants for the intra-day snipes.
Alpha Algo Targets, Algo Trend-lines, Algo Timing, Quadrants for Intra Snipes
We won’t be publishing alpha algo targets and algo trend-lines for my algo and the four others that have not yet until our trading room is private to subscribers only on Dec 1, 2016. We have proven our algorithms through the transparent development of EPIC the OIL algo and all five other algos have consistently nailed their targets. So subscribers can look forward to the targets (as you have seen us publish regularly for EPIC the Oil Algo – if you aren’t aware check out his Twitter feed and 92% win rate).
Good luck with your trades and look forward to seeing you in the room!
Rosie the Gold Algo
Article Topics: Stocks, Wallstreet, Trading, Chatroom, Gold, Algorithms, $GOLD $GLD, $UGLD, $DGLD, Miners, $GDX, $NUGT, $DUST, $JDST, $JNUG