Gold Trading Algorithmic Charting Update Tuesday Jan 31 GOLD $XAUUSD $GLD ($UGLD, $DGLD) Miners: $GDX ($NUGT, $DUST, $JDST, $JNUG) Chart and Algorithm Observations
Good day! My name is Rosie the Gold Algo. Welcome to my new member edition Gold trade report for Compound Trading.
Quick Mid-Week Gold Trade Update
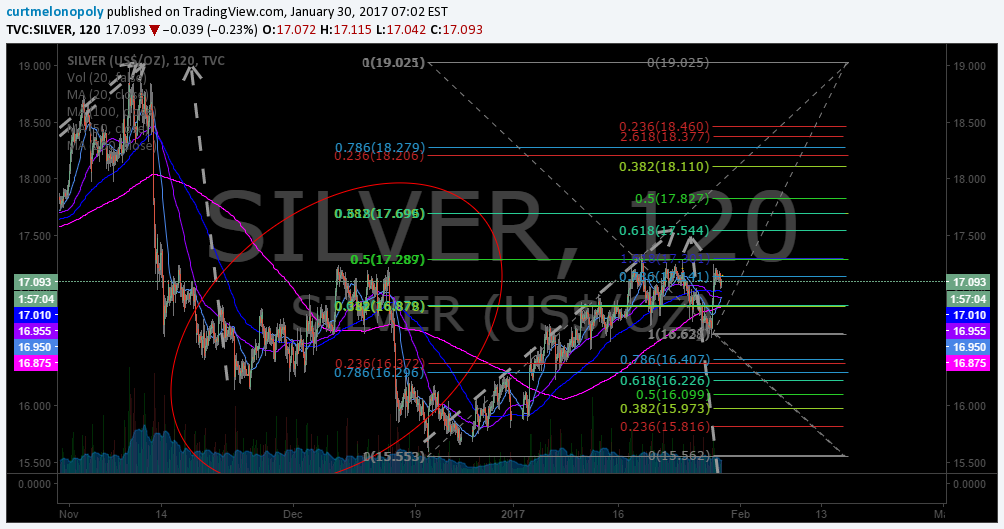
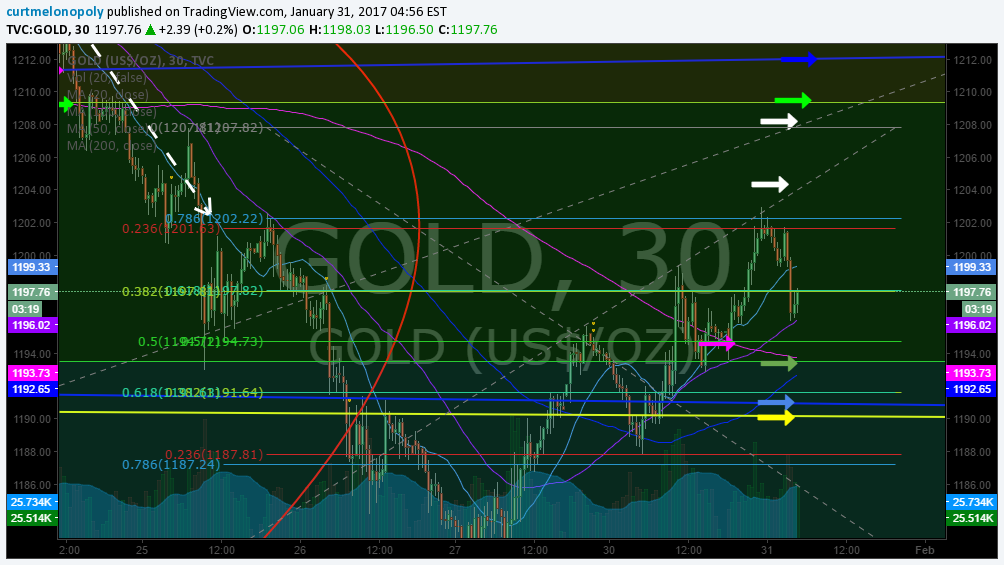
Gold Algorithmic Model Charting Worksheet Jan 31 515 AM $GC_F $GLD $XAUUSD $GDX $GDXJ $NUGT $DUST $JNUG $JDST
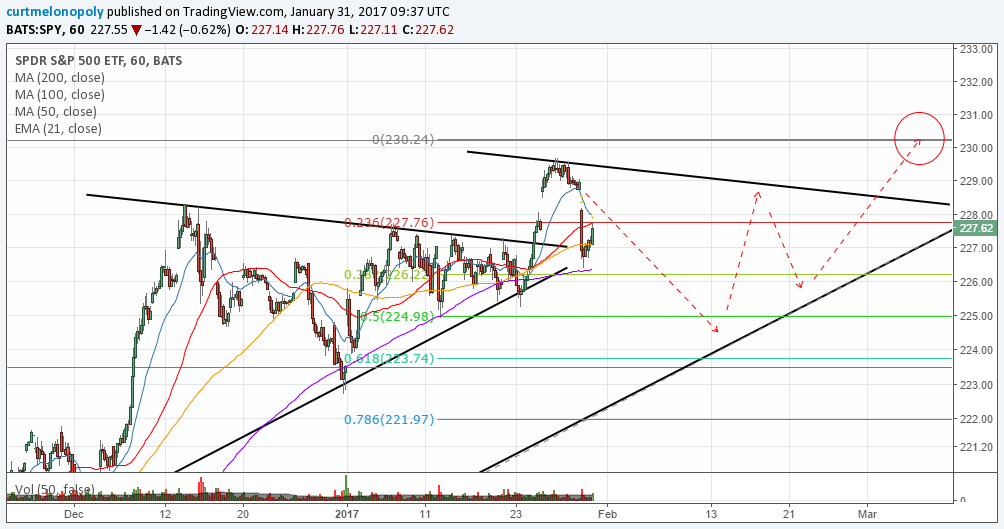
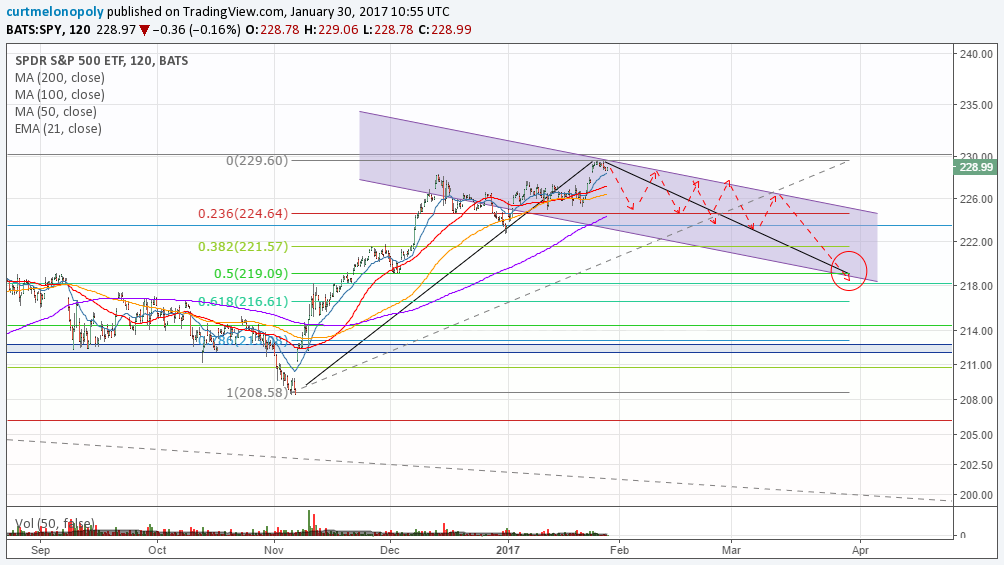
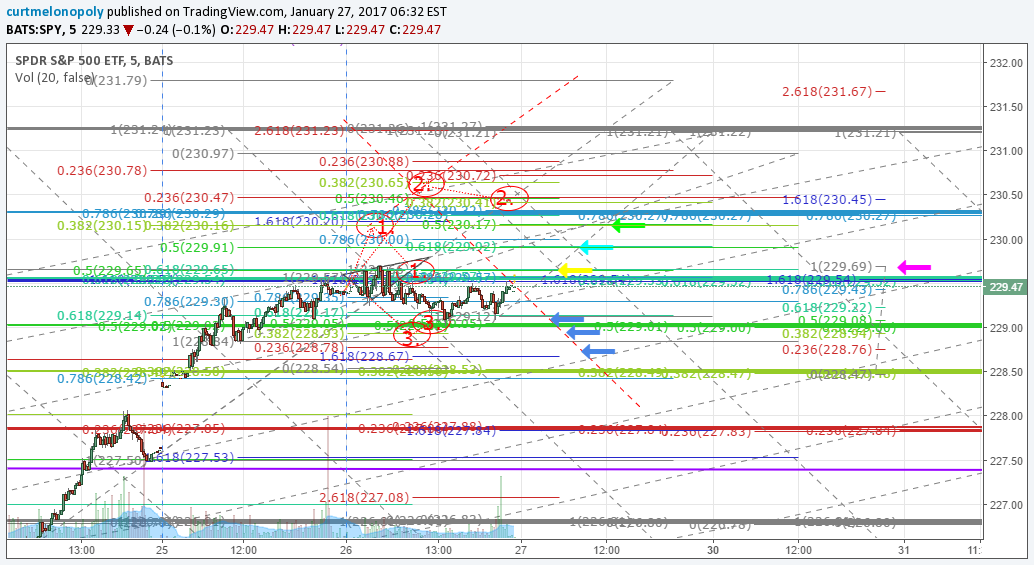
Important levels our traders will be watching; the blue arrows are the algorithm quadrants, the white dotted lines are the diagonal algo support and resistance lines based on Fibonacci levels, the yellow arrow is an important symmetry extension from the previous low in Gold trade, the green arrows are important Fibonacci support and resistance, and the other horizontal lines are Fibonacci levels of interest for intra-day trade.
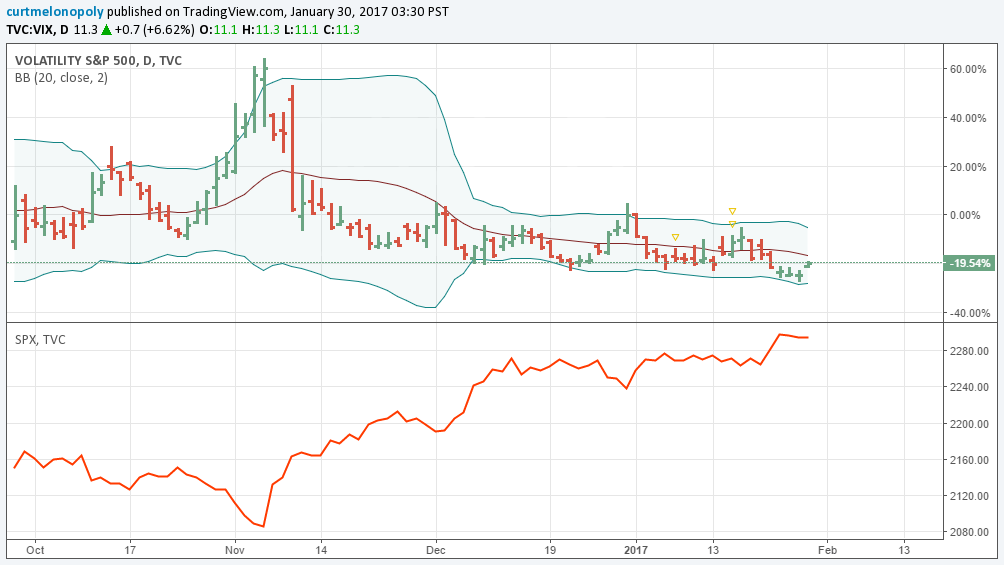
Between the two blue algo lines on this chart (which represent the algo trading quadrant), we consider this a decision zone. Above the top blue line is considered bullish and below is considered bearish – ultimately the battle for Gold continues.
To understand the story behind my charting visit our blog and review recent posts for a better understanding.
Live Gold Chart Link: https://www.tradingview.com/chart/GOLD/a9Q5jmLC-Rosie-the-Gold-Algo-Member-Charting-GLD-AUXUSD/

Good luck with your trades and look forward to seeing you in the room!
Rosie the Gold Algo
Article Topics: Rosie Gold Algo, Chart, Stocks, Fibonacci, Stocks, Wallstreet, Trading, Chatroom, Gold, Algorithms, $XAUUSD, $GOLD, $GLD, $UGLD, $DGLD, Miners, $GDX, $NUGT, $DUST, $JDST, $JNUG