Compound Trading Tuesday May 9, 2017 Review of; Chat Room Stock Day Trading, Swing Trading, Algorithm Chart Trading, Videos and Live Stock Alerts. $CLNT, $UWT, $USOIL, $TSLA, $BA, $NFLX – $PVCT, $LIGA, $ONTX, $ASM, $SSH, $LGCY, $TRCH, $ESEA, $MGTI etc …
Intro:
Compound Trading is a trading group active in day trading, swing trading and algorithmic model charting (black box).
Time stamped entries (in permanent archive) copied to this blog are direct live log chat from chat trade room as they occurred (random chat not applicable is deleted from transcript below but raw video footage is as it occurred – uncut). Chat trade room is recorded daily for trade archive (embedded below and available on our YouTube channel).
In addition to chat, this trade-room has live voice broadcast (that covers in detail what indicators we are looking for in and out off each trade. Typically at market open and for chart review during lunch hour at minimum) and has live chart screen sharing right from our monitors. At times guest traders and associate traders will screen share charting and/or voice broadcast.
EVERY CALL WE MAKE, EVERY PUBLIC INTERACTION, REPRESENTATION OF TRADE (ON EVERY VENUE) IS VIDEO RECORDED (TRADING ROOM), ON SOCIAL MEDIA OR ON BLOG / WEBSITE TIME-STAMPED FOR PERMANENT RECORD AND ABSOLUTE TRANSPARENCY. PLEASE ALSO REFER TO OUR PUBLIC DISCLOSURE https://compoundtrading.com/disclosure-disclaimer/ .
Notices:
Members. News About our Oil, Swing Trading, SPY, Gold, and Alerts packages!
https://twitter.com/CompoundTrading/status/861573420613603328
Accepting interest for mods for upcoming 24 hr Oil trading lounge launch [email protected] $CL_F $USOIL $WTI #Oil #Trading #OOTT
https://twitter.com/EPICtheAlgo/status/860210973570850816
Notice: Our lead trader coaching schedule is fully booked and waiting list started. Keep that in mind if enrolling or email in advance.
https://twitter.com/CompoundTrading/status/858970678342451200
Tuesday was day seven of trading challenge.
We Want (Need) You! Apply to Nearest Recruiting Station. Part 4 “Freedom Traders” Series. https://compoundtrading.com/want-need-apply-nearest-recruiting-station-part-4-freedom-traders-series/ …
https://twitter.com/CompoundTrading/status/858581529727049730
Last market trading session Post Market Stock Trading Results can be found here:
Stock Trading Results Mon May 8 – Day Six: Two Week Trading Challenge $HOTR, $AXSM
https://twitter.com/CompoundTrading/status/861855526405234688
Most recent Premarket Trading Plan Watch-list can be found here (locked to respect members and unlocked to public about a week later for transparency): There wasn’t one processed on Tuesday – we did it live in the trading room FYI.
Protected: PreMarket Trading Plan Mon May 8 $STRP, $ARRY, $MRK, $COH, $KATE, $CRSP, $FCSC, $ITCI, $AXSM, $REGN, $INO
https://twitter.com/CompoundTrading/status/861557044809265152
Please note, for the next while, you will have to review the raw trading room footage to catch Premarket Chart Set-Ups, Market Open Trades, Intra-day Trades and Mid Day Chart Set Ups. Our staff time is being utilzed up for other components of the platform and we also are producing the high quality learning library for our premium members. Once done, we’ll return to publishing the segments daily.
Most Recent Public Swing Trading K.I.S.S Simple Charting can be found here: Swing Trading Simple Charts (Public) Apr 16 $SPY, $VIX, $USOIL $WTIC, $GLD, $GDX, $SLV, $DXY, $USDJPY, #GOLD, #SILVER
https://twitter.com/CompoundTrading/status/853551912599400448
Premarket Session:
No premarket newsletter or premarket review this morning, I am on a conference until right before open. See u in room at 9:25 AM for open!
No premarket newsletter or premarket review this morning, I am on a conference until right before open. See u in room at 9:25 AM for open!
— Melonopoly (@curtmelonopoly) May 9, 2017
Market Day, Chat Room Trades and Personal Trades:
Tuesday everyone (literally) in the room was winning – great group in there – feel like a proud dad. Anyway, it was a great day BUT we missed getting part of the transcript of that damn server issue with that trading room we are testing (the first part), but the raw trading room video is in full but still the video doesn’t tell the whole story (chat etc). But a great day.
Two clean trades today with wins – one in $CLNT and one in $UWT (details further below in post). The swing trades of course were rocking for me on that side of our platform (some listed below) and of course the algorithm trading side you can’t compete with – that is going very well also. Great day and a great year.
Getting so many messages can’t keep up with all the winning today. Congrats to ya ‘all.
Getting so many messages can't keep up with all the winning today. Congrats to ya 'all.
— Melonopoly (@curtmelonopoly) May 9, 2017
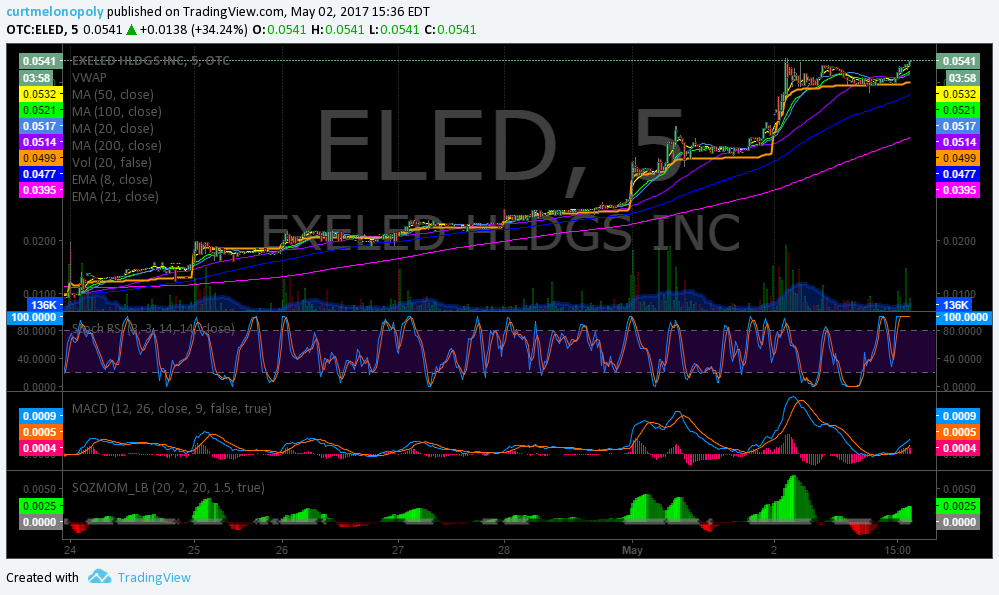
$CLNT Got a good chunk of the move today. Will be on raw trade room footage on You Tube later. #daytrading
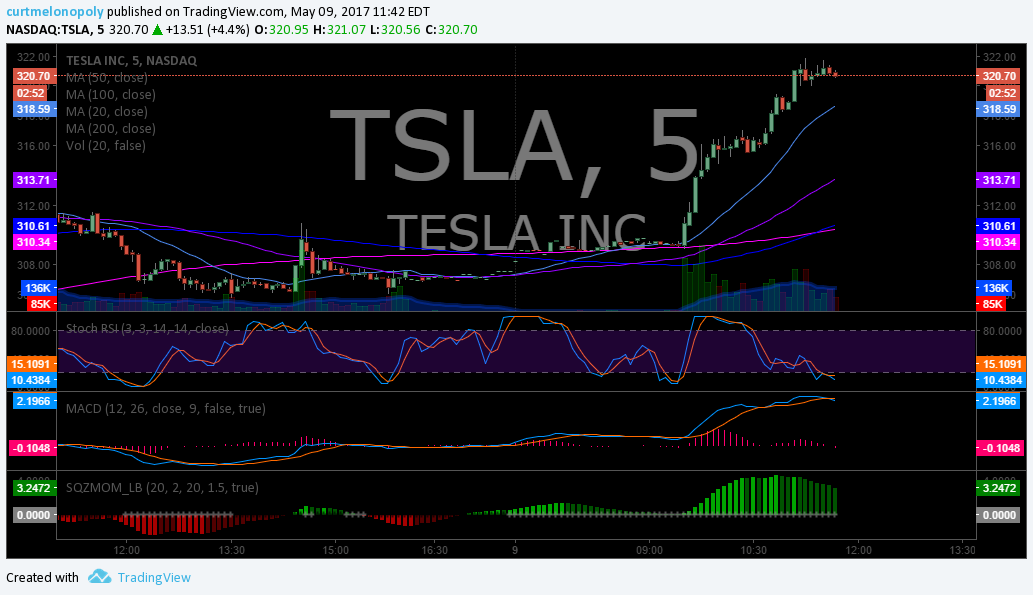
And Tesla and many other issues were big winners for our members today. $TSLA

EPIC the Oil Algo got me in at exactly the right time once again. Hasn’t missed in seven months.
In a small oil related long test here 1800 $UWT 13.85 see how it goes. Won’t give it much rope. #oil #OOTT
In a small oil related long test here 1800 $UWT 13.85 see how it goes. Won't give it much rope. #oil #OOTT
— Melonopoly (@curtmelonopoly) May 9, 2017
Selling now $UWT 14.24 average closing 1800 shares $USOIL $WTI #OIL #OOTT
Selling now $UWT 14.24 average closing 1800 shares $USOIL $WTI #OIL #OOTT https://t.co/F6CRzTRZ3J
— Melonopoly (@curtmelonopoly) May 9, 2017
Learning How-to Trade Stocks, Chart Set-Ups, Lessons and Educational:
If you’re learning how to trade morning momo break-outs you may want to find this trade on the raw footage in the transcript area of post below (You Tube video).

Want to learn how to trade stocks for a consistent profit? Raw trading footage video library. https://www.youtube.com/channel/UCxmgJ3CfWHRBFFMpoHumZ8w … #freedomtraders
Want to learn how to trade stocks for a consistent profit? Raw trading footage video library. https://t.co/nf8mdGBvpT #freedomtraders
— Melonopoly (@curtmelonopoly) May 7, 2017
Momentum stocks. Learn when to buy, hold, sell, short. It’s more predictable than many think. How to use indicators.
Momentum stocks. Learn when to buy, hold, sell, short. It's more predictable than many think. How to use indicators. https://t.co/TEErRdgR15
— Melonopoly (@curtmelonopoly) May 7, 2017
If there’s anything I can do to help with your trading drop me a line on contact page or DM https://compoundtrading.com/contact/ #howto #trade #stocks
If there's anything I can do to help with your trading drop me a line on contact page or DM https://t.co/1CNAfDsAeI #howto #trade #stocks
— Melonopoly (@curtmelonopoly) May 8, 2017
Stocks, ETN’s, ETF’s I am holding:
I am holding (in order of sizing – all moderately small size – under 5% of my daytrading acounts) – $ONTX, $ASM, $SSH, $LGCY, $TRCH, $ESEA, $MGTI, $LIGA (this is the daytrading portfolio and does not represent swing trading service portfolio): Looking at moving out of all these small positions over the next month or so.
Note-able Momentum Stocks Today (via FinViz):
| Ticker | Last | Change | Volume | Signal | |
| CLNT | 5.45 | 66.67% | 17201758 | Top Gainers | |
| WRLD | 88.00 | 38.58% | 1417200 | Top Gainers | |
| EMMS | 3.26 | 26.36% | 2019600 | Top Gainers | |
| TDOC | 28.60 | 25.16% | 3437875 | Top Gainers | |
| VRX | 12.05 | 24.10% | 125124900 | Top Gainers | |
| CVU | 7.00 | 22.81% | 313928 | Top Gainers | |
| WRLD | 88.00 | 38.58% | 1417200 | New High | |
| W | 61.73 | 20.73% | 11911400 | New High | |
| ZN | 1.85 | 8.19% | 795900 | New High | |
| CAMT | 4.36 | 8.19% | 2101468 | New High | |
| IAC | 101.99 | 1.43% | 973000 | Overbought | |
| STRP | 230.68 | 7.42% | 665582 | Overbought | |
| TOK | 59.46 | -0.03% | 2344200 | Unusual Volume | |
| GBF | 113.15 | 0.15% | 555127 | Unusual Volume | |
| EMMS | 3.26 | 26.36% | 2019600 | Unusual Volume | |
| ELLO | 8.39 | 1.08% | 92531 | Unusual Volume | |
| T | 38.22 | -0.91% | 21550600 | Upgrades | |
| AAMC | 75.50 | 1.82% | 4017 | Earnings Before | |
| MDSY | 0.73 | 4.29% | 40300 | Insider Buying |
Algorithm Charting News:
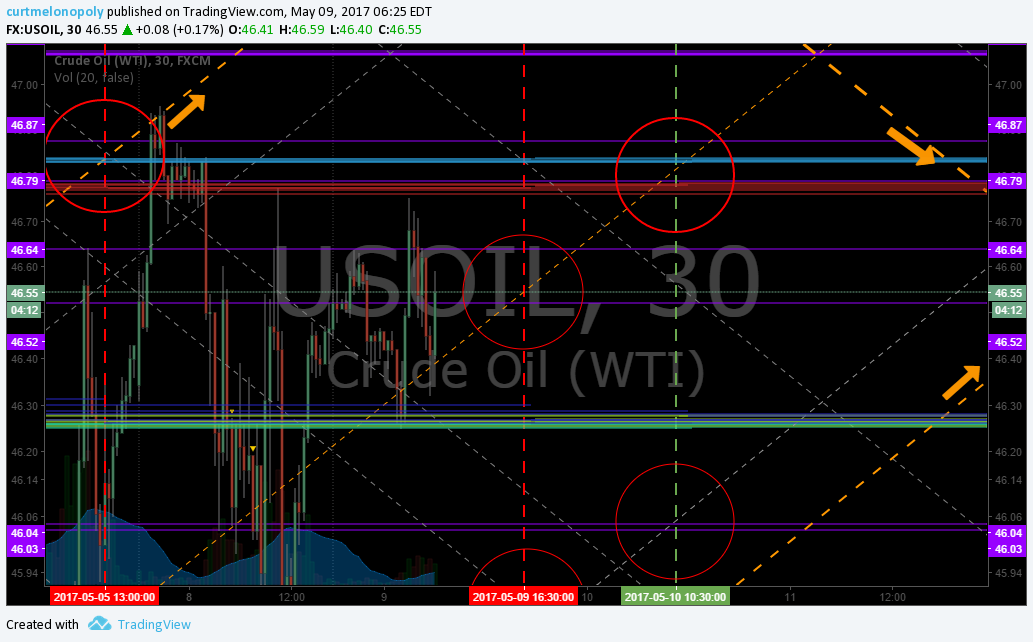
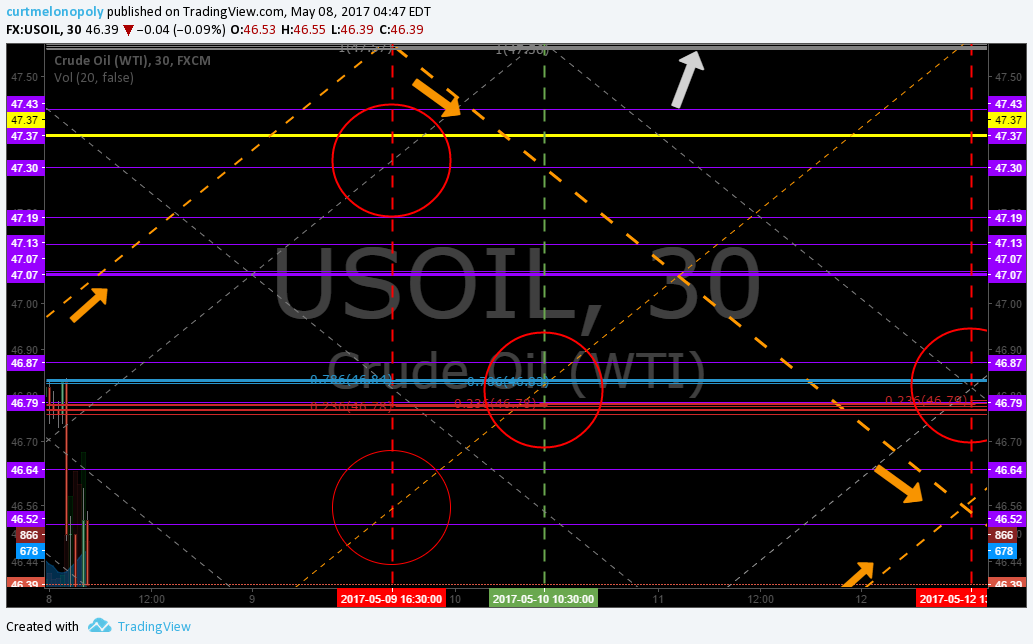
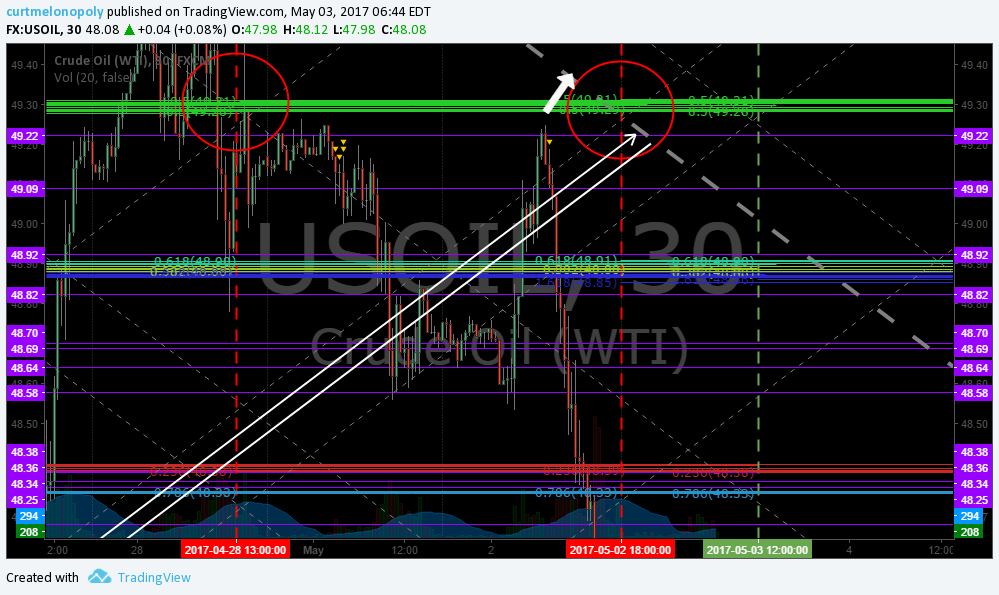
Imagine having that kind of intelligence days in advance! Our members knew days in advance what conventional charting could never tell them – where oil would bounce.
Check out the timing of our lead traders $UWT trade today and tell us he didn’t know:) It is by the way, live on the raw trading room coverage in the video in the transcript section below. Transparent, no fool around, precision accuracy that NO retail available algorithm for oil can give you. No retail available algorithm or charting. None.
Support hit perfect, target hit, on way to next target. EPIC the Oil Algorithm Chart FX $USOIL $WTI #OIL $USO $UWT $DWT $CL_F #OOTT #Algo
https://twitter.com/EPICtheAlgo/status/862220779957526528
Wowza. Live video of direct price and time target hit Wed 10:30 #EIA report. $USOIL $WTI #Algo #OIL #OOTT
Wowza. Live video of direct price and time target hit Wed 10:30 #EIA report. $USOIL $WTI #Algo #OIL #OOTT https://t.co/mqNh8T6QVb
— Melonopoly (@curtmelonopoly) May 4, 2017
$NVIDIA beat. 1.94 v 1.91. 1% to .01% ♜♚♛♜ #AI
$NVIDIA beat. 1.94 v 1.91. 1% to .01% ♜♚♛♜ #AI
— Melonopoly (@curtmelonopoly) May 9, 2017
The Charting Algorithm Twitter feeds can be found here: $WTI (@EPICtheAlgo), $VIX (@VexatiousVIX), $SPY (@FREEDOMtheAlgo), $GLD (@ROSIEtheAlgo), $SLV (@SuperNovaAlgo), $DXY (@DXYUSD_Index).
Swing Trading Notes / News:
$GOOGL Long since 859.01 Trading 948.45 with SQZMOM green MACD ramped and decent vol. #holding #swingtrade Kings Queens and Castles.
$GOOGL Long since 859.01 Trading 948.45 with SQZMOM green MACD ramped and decent vol. #holding #swingtrade Kings Queens and Castles. pic.twitter.com/U04zmOBX1f
— Melonopoly (@curtmelonopoly) May 4, 2017
Swing trade members published forecast for $GOOGL “Feb 3 – 1003.17 Price Target in 2017”
Swing trade members published forecast for $GOOGL "Feb 3 – 1003.17 Price Target in 2017"
— Melonopoly (@curtmelonopoly) May 4, 2017
$XRT SPDR S&P Retail ETF Trading 43.02. Holding from 41.67 but MACD may turn down any second, and if so I will likely close. #swingtrade
$XRT SPDR S&P Retail ETF Trading 43.02. Holding from 41.67 but MACD may turn down any second, and if so I will likely close. #swingtrade pic.twitter.com/O42X5699wg
— Melonopoly (@curtmelonopoly) May 4, 2017
$VFC Swing trade went well, now we watch. Closed 57.84 April 27 before earnings.from 53.50 entry no hold through earnings. #swingtrading
$VFC Swing trade went well, now we watch. Closed 57.84 April 27 before earnings.from 53.50 entry no hold through earnings. #swingtrading pic.twitter.com/K4nHusKQUS
— Melonopoly (@curtmelonopoly) May 4, 2017
$NFLX Swing trade going well. Long at 148.40 trading 156.08. SQZMOM and MACD trending but Stoch RSI may cool soon, vol decent. #swingtrade
$NFLX Swing trade going well. Long at 148.40 trading 156.08. SQZMOM and MACD trending but Stoch RSI may cool soon, vol decent. #swingtrade pic.twitter.com/gVcujGgoMe
— Melonopoly (@curtmelonopoly) May 9, 2017
May 8 – $BA Boeing Swing trade going well. Trading 186.13. Long 180.06. Holding. MACD, Stoch RSI, SQZMOM all trending. #swingtrading
May 8 – $BA Boeing Swing trade going well. Trading 186.13. Long 180.06. Holding. MACD, Stoch RSI, SQZMOM all trending. #swingtrading pic.twitter.com/KX0KOryxfx
— Melonopoly (@curtmelonopoly) May 9, 2017
The Swing Trading Twitter feed is here: https://twitter.com/swingtrading_ct.
US Dollar $DXY $USDJPY $UUP & Currencies of Note:
NA
Gold $GLD, $XAUUSD, $GC_F :
NA
Gold Miner’s $GDX:
NA
Silver $SLV:
NA
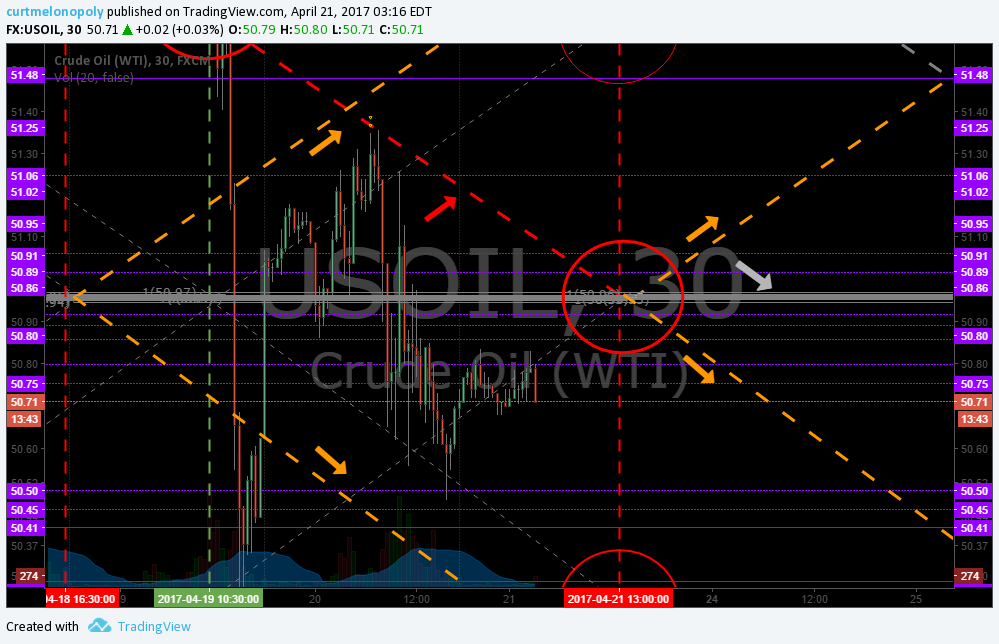
Crude Oil $USOIL $WTI:
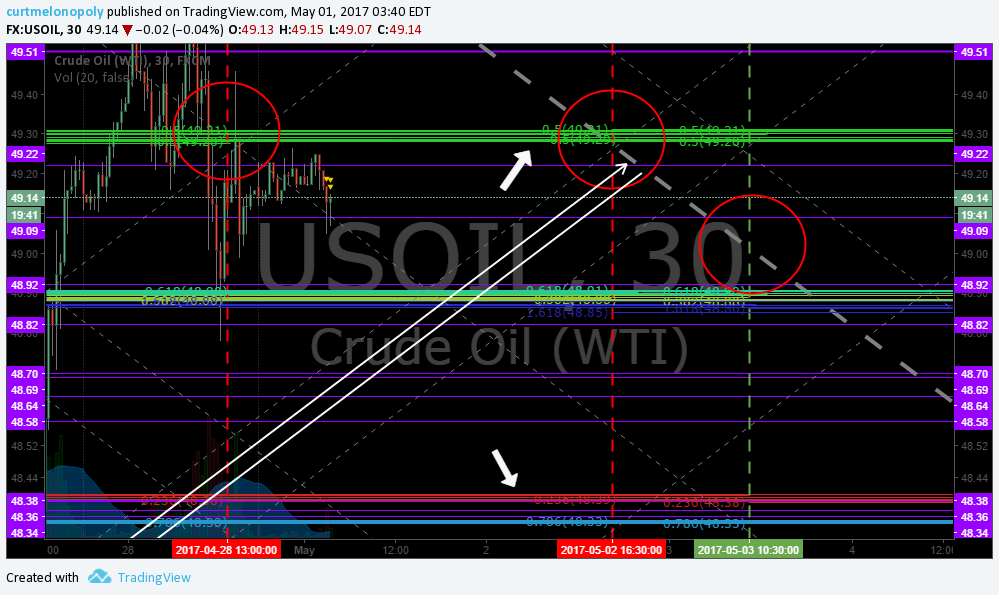
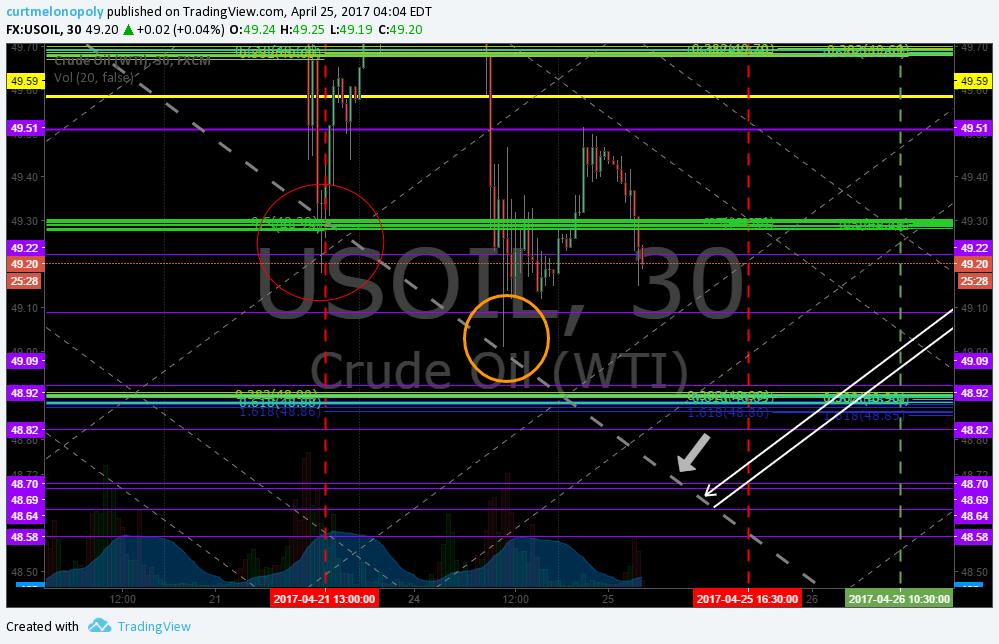
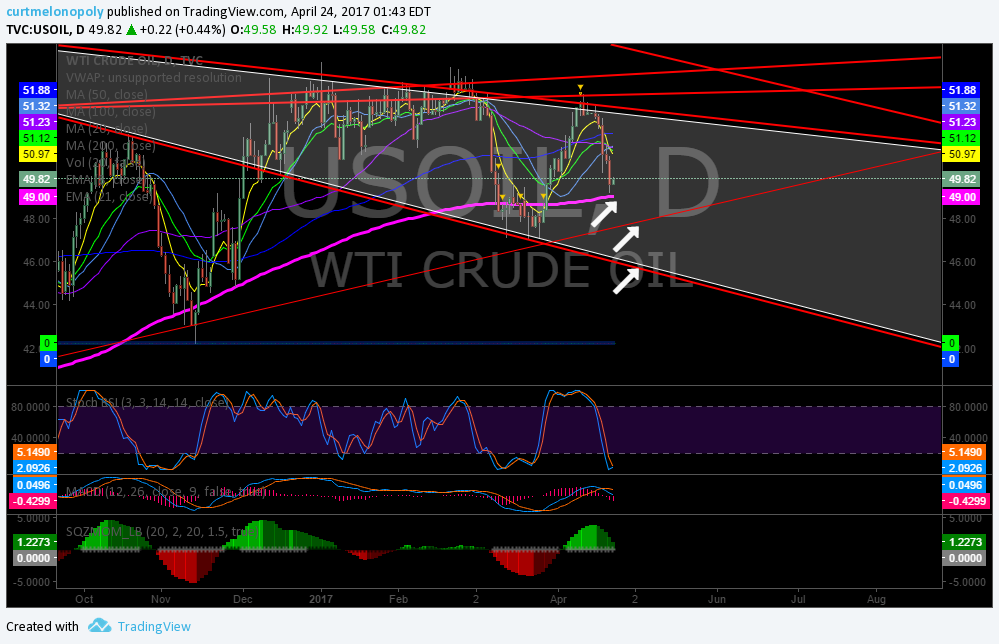
A warning our members got days ago that is playing out as charted.
Be very careful here. oil regained bottom of the channel. EPIC Oil Algorithm charting May 9 642 AM FX $USOIL $WTIC #OIL $CL_F $USO $UCO $SCO $UWT $DWT #OOTT

Across #shale industry, drilling activity increasing even faster than it did in final stages of its first boom, up until 2014 @FT
Across #shale industry, drilling activity increasing even faster than it did in final stages of its first boom, up until 2014 @FT pic.twitter.com/GJn2J5wZnL
— 13D Research & Strategy (@WhatILearnedTW) May 9, 2017
#Oil Re-balancing Watch: @EIAgov continues to see oversupply into 2018 #OOTT
#Oil Re-balancing Watch: @EIAgov continues to see oversupply into 2018 #OOTT pic.twitter.com/kmBK58QzNO
— Javier Blas (@JavierBlas) May 9, 2017
Volatility $VIX:
The historical seasonal tendency is for $VIX levels to trend lower until around July
The historical seasonal tendency is for $VIX levels to trend lower until around July pic.twitter.com/Sb25W1SPro
— Topdown Charts (@topdowncharts) May 9, 2017
$SPY S&P 500 / $SPX:
NA
$NG_F Natural Gas:
NA
Markets Looking Forward:
#earnings $NVDA $VRX $DIS $JCP $PCLN $ACIA $TSN $ON $NTES $PLUG $KITE $TEVA $SNAP $AGN $NWL $TSEM $JD $HZNP $SYY ??
#earnings $NVDA $VRX $DIS $JCP $PCLN $ACIA $TSN $ON $NTES $PLUG $KITE $TEVA $SNAP $AGN $NWL $TSEM $JD $HZNP $SYY 🎯🚀 https://t.co/lRUHPnPhh5
— Melonopoly (@curtmelonopoly) May 7, 2017
Not a prediction, but worth noting where markets were, and went to, after volatility first got down here the last cycle. h/t
Not a prediction, but worth noting where markets were, and went to, after volatility first got down here the last cycle. h/t @topdowncharts pic.twitter.com/IK8wvbbOc2
— Michael Santoli (@michaelsantoli) May 8, 2017
TECHNICALLY SPEAKING: So goes oil prices, so goes earnings and the S&P 500.
TECHNICALLY SPEAKING: So goes oil prices, so goes earnings and the S&P 500. https://t.co/Cudq5ve4NI pic.twitter.com/qODEwLoz5b
— Lance Roberts (@LanceRoberts) May 9, 2017
Live Trading Chat Room Video Raw Footage and Transcript:
Two Part video (Part 1 embed is below and go to Compound Trading Youtube channel for Part 2 of live feed from day and other charting from the day).
Compound Trading Stock Chat-room Transcript:
Please note: Miscellaneous chatter removed from transcript and some discussions I will add notes with information I’ve gleaned in discussions online with traders on DM etc also for further explanation (noted with *). Most days at 9:30 ET market open there is moderator live broadcast explaining trades and at times during the day there is also live broadcast market updates and trade set-up explanations (so you have to scroll through video feed to market open etc to catch live broadcast portions – in future we will note in in transcript when we are on the mic so viewers can correlate time with transcript with video feed when reviewing trades).
Note: We are testing a new trading room. This particular room does not list a time stamp with each chat entry – we are working on a fix. Also, please note, sometimes pieces of the transcript are missing (also something we are working on). But the video is raw and complete.
ALSO PLEASE NOTE the first part of the day transcript is missing but the video is there and we didn’t miss much of the first part of day – sorry!
Market Maven: unless 8ma goes
Spiegel: I don’t know why but I chickened out at 6
Market Maven: bcause 100% was coming spiegel
Market Maven: good exit
quarryrock_1: NVDA rip
quarryrock_1: sold some $DIS $1.51
quarryrock_1: out of half my disney
Market Maven: Closed 6.45 all
lenny: 6.38
lenny: Might try a stoch rsi bounce soon
quarryrock_1: roll up your sleeves Curt today is gonnna be great!
Curt M_1: lololol
Curt M_1: congrats y’all
lenny: in the stoch rsi bounce here
lenny: 6.24
quarryrock: would like to see NVDA through $105 later
lenny: out 6.47
lenny: 6.37
lenny: correction
Spiegel: TSLA calls up 50%. But CLNT stock beat that
quarryrock: Added $NCLH Cs 5/19 1.96
Curt M_1: I’m up 5500.00 on the 2 wk challenge so I’m 25% there with 25% time left
quarryrock: $55 strike
quarryrock: wow nice!
Spiegel: Curtis, you better throw it all at one of those .0001 or .0002 stocks and hope for the best.
Curt M_1: lol
quarryrock: i got spanked on $MEET and $EFA both losses today
Flash F: $FCX great moves today
Spiegel: TSLA just killing it today.
quarryrock: nice on TSLA wow
Spiegel: wish I had bought the calls at the open. Could have been a double now
Spiegel: got distracted looking for penny stock movers
quarryrock: sorry my NVDA are $108s not $105 my bad
Spiegel: CLNT setting up for round 2. Usually buying the first pullback on a stock that has risen from the open like that works.
Curt M_1: going to make coffee – some reason really need one:)
Curt M_1: bbr
Spiegel: mine just went cold with all the excitement
Curt M_1: brb lol
quarryrock: $YELP spike!
quarryrock: come on $DIS $112 and im putting this to bed!!!
Flash F: watching $YELP very close (I’m in it)
Spiegel: Looks good. I just joined you flash
quarryrock: nice!
Spiegel: Option premium very hihgh with that one. I might do a covered call with it.
Spiegel: After it’s risen
Flash F: $SHOP beast
Flash F: $VIX might break forever soon
quarryrock: my trade on DIS is to try to play with house money into the report. will only leave partial position open for it.
Sandra: $WUBA highs continue
Spiegel: I just noticed YELP announces earnings after the close today
Spiegel: they crushed them last time
Spiegel: 333% positive earnings surprise
quarryrock: wow they are pushing yelp down. might be a nice bounce later
Spiegel: stopped out
Spiegel: that was quick. Minor loss though on 100 shares
Spiegel: $20
Spiegel: I wouldnt have bought if I knew earnings were tonight
quarryrock: YELP should find $35.50 later as options mkt pricing 13% move off that strike – lets see
Flash F: Shorting $TSLA – I don’t get it. Why people try.
Spiegel: im holding unless it gives me a reason otherwise
Spiegel: although I’ll admit is has gone too far, too fast. Can’t hold this type of gain all day
Flash F: I even understand why people would short it short time frame but there’s people that think its going to crash
Flash F: $TSLA isn’t going to crash and burn
lenny: ya i agree – it will have pull backs but curt’s right about the fact that the peasants (us) get a piece in the castle so to speak – a piece of the future bla bla i agree with all that
Curt M_1: mmmm coffffee
Curt M_1: now I’m ready
Spiegel: Curtis, views on TSLA at this juncture
Spiegel: please and thank you
quarryrock: Added $35 Cs $YELP
quarryrock: sold more $DIS 1.53
quarryrock: only thing left is original buy at $1.91
quarryrock: huge gains today on this one
Spiegel: TSLA going to hit $320!
Spiegel: Calls from $6 to 10.80 now
Spiegel: I should get out
quarryrock: $112 in 3,2,1 House of Mouse!
quarryrock: SLW catching a bid
quarryrock: big green candle in $YELP
lenny: yup
Spiegel: CLNT may have pulled back enough to go back in
quarryrock: did anybody see that nintendo news last night as it relates to NVDA?
Curt M_1: Even tho I’m tempted because I’m in need of some juice here…. I’m going to wait for time of day… this afternoon should have bullish action
Curt M_1: should
Curt M_1: undless it gets going of course
Market Maven: there is a bullish momo in market it might run earlier
Curt M_1: u guys could be right
Curt M_1: I really have my eye on oil too – over the next 24 hours – could be good
quarryrock: i give super high odds they ramp nvda into the close
Curt M_1: all systems look go on $NVDA now
Curt M_1: see lol whoa
quarryrock: wow ripper now!!
Curt M_1: yuge volune coming in
Spiegel: what about TSLA? fans want to know!
Flash F: One of the best years I’ve had in forty of em
Flash F: Gold may never come back. VIX may die forever. The markets may just go up forever. Managed markets.
Curt M_1: $TSLA SQZMOM is rounding top but that means nothing. 100 MA about to breach 200 MA on 5 that’s super bullish.
Curt M_1: volume coming in to wow
Spiegel: still have my call
Curt M_1: crazy action
Curt M_1: Congrats all
Curt M_1: Flash you nailed it again
Curt M_1: they sold in to that spike on $NVDA really hard wow
quarryrock: lots of Bears because of AMD
quarryrock: im not convinced they miss here – could beat nicely
Spiegel: NVDA cracked but TSLA still going.
Spiegel: THAT’s the star of the day for big caps
Spiegel: how is the stochRSI still so low for it after that huge run?
Curt M_1: Its an overbough oversold type indicator – not momo
Curt M_1: when its trending down or flat and price is trending up you buy with both hands and feet
Curt M_1: especially when stoch rsi trending down and price trending up
Curt M_1: right now its crossed down and it looks like MACD is going to also and SQZMOM is
Spiegel: NVDA bouncing
Spiegel: bounced right off 200 and 100 ema
quarryrock_1: $FOSL ripping ahead of ER
Market Maven: $CLNT snap back underway
Market Maven: knocking on VWAP
Spiegel: recomend buying here?
Market Maven: challenging
Market Maven: maybe in scalps small size
Spiegel: I did but just want to here verification from the pro
Spiegel: hear
Market Maven: curts right about time of day careful
Market Maven: ha
Curt M_1: this time of day I’d consider it if MACD crossed up on 5
Curt M_1: $AQB on volatility halt FYI
quarryrock: took a small scalp on $NVDA here all out for now
quarryrock: they may want a $103 pin
Sandra: I” be on mic at 12:10 dealing with some office admin staff clerical phone calls clients and not sure what else lol – need the beach eed the beach
Curt M_1: hey sandra
Curt M_1: it has to be put under my name next time
Market Maven: bahaha
Market Maven: I trained her
Curt M_1: Anyway – thanks for doing that but let peeps know its me talking lol
Curt M_1: Anyway – I” be on at 12:10
Sandra: ok sorry ha
Sandra: but maven’s right she did train mehahahaha
Market Maven: how is the office over there sandy?
Sandra: busy very busy but good and I’m learning here on the trades – not up as much as you tho
Sandra: up 34% YTD
Market Maven: that’s crazy good for your first year
Market Maven: how’s the technology integration coming?
lenny: we’ll be ready for july 1 for sure
Sandra: ya lenny’s right – likely June 18th or so we’ll launch the room
Sandra: lenny’s been great
Sandra: hes up 300% tho
quarryrock: curt as of now im +$4345 on the challenge
quarryrock: but have a ton open in options so lets see how my trades play out
Curt M_1: whoa we’re close
Curt M_1: i didn’t think i had a chance
Market Maven: u don’t hahahahah
quarryrock: hahaha
Curt M_1: sassy mm
Sandra: anyway maven thanks for all the help!
Market Maven: cheers !
Curt M_1: any tickers you want to look at get em in now 1 min to mic>>>>>>>>>>>>>>>>
Tradergirl: oil? poss?
quarryrock: wow NVDA !!!!!
quarryrock: sold too soon !!!
quarryrock: $P in play
Tradergirl: thx kk ya, if holds here, speaks volumes
Spiegel: I’m guessing the oil market is so huge that no matter how many are in the room trading EPIC it won’t affect prices for long?
ny75: fslr and hd
Spiegel: Just bought that one! How did you know?
Tradergirl: thank you so much kk, we are on same page fwiw
quarryrock: $W having a huge day
quarryrock: $VRX squeeze continues
ny75: FSLR
Spiegel: FSLR
Spiegel: 🙂
Leanne: You need more assistants now!
Spiegel: AAOI (which should be a swing pick)
Spiegel: Was $47 when I first brought it up last week
ny75: hd
Spiegel: what happened to AAOI
Spiegel: long from $46.40
quarryrock: rolled up $TGT now to next week $60 Cs .70
Spiegel: 24th
Spiegel: swing list potential?
Spiegel: I’m good!
Spiegel: yeah!
Leanne: And I’m absorbing all this goodness in here, thanks everyone for letting me be a sponge
Spiegel: HIIQ
Spiegel: wasn’t going to bother you but couldn’t help it
quarryrock: retailers all moving nice
quarryrock: $KSS over $40
quarryrock: and the options will start to blast off
Curt M_1: Wow great session – some great charts there!
Curt M_1: Back in 20 mins
quarryrock: $LULU rumors
quarryrock: there goes $KSS !!!!
quarryrock: strangled $VRX here $12.50 weekly Cs with the $11.50 next week Ps
quarryrock: looking to capture the volatility potential both ways
Spiegel: Oil dumping – could be getting near buy point?
Spiegel: UWT under $154
Spiegel: under $3.80
Spiegel: Geez, under $13.80
Spiegel: thinking……thinking…..
Curt M_1: Algo charts work fine on our PCs but not on these laptops.
Curt M_1: getting too big
Curt M_1: too big for cheapie laptops
Curt M_1: it just hit the algo line support
Curt M_1: that orange line
Curt M_1: I’m going to take a long test here as long as it holds the orange line we’re good
Curt M_1: if not oh boy watch out
Spiegel: You need to catch up. Better include it! 🙂
Curt M_1: $UWT 1800 13.85 Long for a test
Spiegel: We need to see a pic of your bulldog
Leanne: OMG the deep breathing!
Spiegel: he gets his own seat?!
Curt M_1: hope so – be right back:)
Spiegel: nicely timed – good thing I alerted it
Curt M_1: Hey Spiegel!
Curt M_1: Thanks Brother!
Curt M_1: You and EPIC will get along just fine:)
Spiegel: I’m hoping to form a beautiful, commited, long term relationship with it
Market Maven: haha you’re not the only ones
lenny: EPIC is well you know…
Spiegel: EPIC
lenny: I still haven’t figured out the math and Curt’s explained it 50 times to me
lenny: yup
quarryrock: $TGT beautiful
Spiegel: Instead of UWT I bought UCO calls
Curt M_1: nice
Spiegel: terrible spread though
Spiegel: FSLR broke hihghs again
Curt M_1: Just watch that orange line close. That’s a get out fast line. You can always re enter.
Spiegel: Curtus, how much time lag is there between your clickmeeting charts and what we see?
quarryrock: $KSS ?♀
quarryrock: break out
Spiegel: I can’t believe that after UCO has gone up 25 cents from where I bought it they’ve only raised the bid on the calls by a nickel!
Spiegel: the calls have almost no time value in them now even though theres 3 days left
Spiegel: FSLT closing in on $36
quarryrock: Retail is going crazy!!!
Spiegel: FSLR I mean
quarryrock: sold some $P calls for $500
Spiegel: FSLR did indeed break #36
Spiegel: $36
quarryrock: $NCLH POP!
Spiegel: My first oil trade here. So once in, I guess we should worry over every little dip or hiccup in price as long as it honors the channel?
Curt M_1: correct
Curt M_1: orange line
Curt M_1: 🙂
Spiegel: above orange = hold on!
Curt M_1: going long side in downtrend harder so not the best but we’ll see
Curt M_1: ha
Curt M_1: OPEC knows the chart
Curt M_1: if oil loses that orange line then there’s only one more below (the grey one down below) and then oil tanks all over again. So then you watch for a rumor at the orange or grey line – rumor comes all the time there. Well not all the time but you know what I mean. they know the chart
Spiegel: by rumor you mean a rumor leaked to the media about something that will affect oil prices?
Curt M_1: correct
Curt M_1: when price hits magic algo lines they start the rumor mill
Curt M_1: no rumor when price hits below grey line short
Curt M_1: if rumor comes at grey line long
Curt M_1: But there’s always a yellow line about .20 cents under the grey line and that’s the zone or area of support – they hammer the stops between the grey line and yellow line and then take off again
Curt M_1: look over epics historical charts you’ll see a yellow horizontal line
Spiegel: I’ll look for that
Spiegel: AAOI yet another new hihg
Hedgehog Trader: Curt- what makest thou of $RGSE chart? (not urgent)
Hedgehog Trader: I do wonder if oil bounces back that RGSE might break above 50 dma
Curt M_1: See that orange line up above? Oil not likely to get thru there FYI to upside
Curt M_1: it may but its gonna be a challenge
quarryrock_1: $YELP certainly not inspiring confidence today
Curt M_1: $RGSE has lots of indecision but it looks like this may be bottom. High probability.
Hedgehog Trader: thanks Curt – it does look worth watching
Spiegel: solar must be hot for some reason
Hedgehog Trader: iirc it had a big share rollback and had some insider buying right after
Spiegel: let me check my Yahoo solar list
Hedgehog Trader: $SOL is one that is trying to peek above 50 dma
Hedgehog Trader: $TAN the solar etf has some room above it- up 1% today
Hedgehog Trader: $JASO at fresh highs but not huge volume
Spiegel: CSIQ + 2.14%, JASO + 3.93, SPWR + 2.75%, JKS +3.3%. Yup! Solar is hot!
Hedgehog Trader: all solar plays
Hedgehog Trader: yep
Spiegel: haven’t looked at that list in awhile
Spiegel: I was going to say SCTY down but I forgot TSLA bought them out
Hedgehog Trader: my $NAK keeps going up- probably only miner showing life right now
Spiegel: gotta be
Spiegel: that thing seems to move independent of the metal
quarryrock: Here comes the House of Mouse!
Spiegel: house of mouse?
Spiegel: DISney
Spiegel: of course
Spiegel: UWT lookin gooood
quarryrock: yup LOL!
quarryrock: come on $SLW how about a ramp into the close
Spiegel: Winner of most ridiculous spread award goes to NWMT. .02 X .065
Spiegel: that’s level 2. Level 1 is .06 X .40
quarryrock: took off the $VRX calls small loss leaving next weeks puts on
quarryrock: long $YELP $34.45 will be selling shortly
Spiegel: don’t want to hold through earnings?
quarryrock: this is a scalp
quarryrock: have calls for ER
Spiegel: ah
Spiegel: I read they had a huge 333% earnings surprise last Q
Spiegel: Although this time Zacks doesn’t think it’ll be that good
quarryrock: Yelp Options now implying a 21.5% move
quarryrock: wow im bullish
quarryrock: this is a beautiful scalp!
quarryrock: im out .55
quarryrock: plus .55
quarryrock: STC 50% of my $YELP 35 Cs for +.30 small win
Curt M_1: $HNRG some decent range between 7,97 and 8.08 resistance
Curt M_1: sorry 7.67
Spiegel: There goes my sleep tonight. I’ll be watching this OIL chart constantly
Curt M_1: haha
Curt M_1: I’ll likely take profits b4 close
Curt M_1: i’m in a trading challenge lol
Spiegel: but if not in a trading challenge you would…….
Spiegel: HOLD?!?!
quarryrock: wouldnt shock me if they ramp VRX into the close to kill any shorts playing for a fade
Curt M_1: I don’t hold often no
Spiegel: I should sell and take this first oil trade win. Good psychologically going forward
Curt M_1: if i was short at res in a downtrend like now yes
Curt M_1: but this is opposite
Curt M_1: Selling now $UWT 14.24 average closing
quarryrock: not going to play NVDA tonite
lenny: Curt never lost on oil plpays I dont think
Curt M_1: small cuts yes
lenny: ya but lose nope
Curt M_1: End of day 7 of two week 20k double account trading challenge +6250.00 ?? Three days left ugh runway getting real short #tradingchallenge
quarryrock: nice!
Spiegel: you beating that quarry?
quarryrock: not yet
Spiegel: gotta be close
Curt M_1: love that ” not yet” winners talk that way….. so much winning you’ll get tired of winning haha
quarryrock_1: haha. well had a nice day today so far
Spiegel: It’s been a great day – TSLA, CLNT, FSLR, AAOI and UCO
Spiegel: and I was going to add HIIQ but it just dipped
quarryrock_1: awesome!
Curt M_1: Spiegel on the bank team
Market Maven: congrats SP
lenny: you’ll get tired of winning:)
Sandra: funny guys
Sandra: it is nice to win thoough
quarryrock_1: wow they are gonna bring NVDA to $103
quarryrock_1: and here comes the SLW GDX ramp on cue!!!!
Spiegel: thanks everyone
Stan: i agree winning is awesome
Spiegel: RGSE having a nice pop
Spiegel: until I typed that and killed it
Spiegel: ok, its back
Hedgehog Trader: ha
quarryrock: ok Curt its make or break for me – long calls in DIS SLW NCLH YELP all equal weighted Im BULLISH !
Curt M_1: omg thats awesome
quarryrock: Disney fully paid for house money
quarryrock: YELP only one im nervous about
Shafique: well guys been a slice once again thanks!
Shafique: i won
Shafique: bye
cara: hat was funny
cara: bye shaf!
Stan: c ya tomorrow all
Curt M_1: thanks for coming out hope u did well stan
Stan: oh yeh all great stuff
Curt M_1: have a great nite kids
Flash F: later
Hedgehog Trader: cheers
If this post was of benefit to you, be kind and share on social media!
Follow our lead trader on Twitter:
Article Topics: $CLNT, $UWT, $USOIL, $TSLA, $BA, $NFLX – $UGAZ, $DGAZ, $NUGT, $DUST, $USLV, $DSLV, $UWT, $DWT, $JNUG, $JDST, Compound Trading, Learning, How To, Trade, Trading, Educational, Lessons, Results, Wall Street, Stocks, Day Trading, Swing Trading, Investing, Chat Room, Trading Results, $GLD, $GDX, $USOIL, $WTIC, $USD/JPY, $SPY, $DXY, $VIX, $GC_F, $USO, $UCO, $SCO, $CL_F, S&P 500